


To analyse the psychometric properties, internal structure, and relationship with anthropometric indicators of the Body Shape Questionnaire (BSQ) among Mexican university students according to the measurement invariance approach.
MethodsAn instrumental study was carried out to assess the psychometric properties, validity, and reliability of the BSQ. The analysis of the measurement invariance was performed using the Least Squares Estimation, and weighted by adjusted variance and polychoric correlations after assessing different measurement models for BSQ in each group. The scores of the final version were correlated with anthropometric indicators by the Pearson correlation coefficient.
ResultsAs regards the dimensional analysis, all of the previous models for BSQ have favourable adjustment rates, although those with a single factor show more robust evidence. The configural invariance was accepted; suggesting that the one-dimensional structure is common for both men and women. However, 16-item factorial loadings were statistically different between the groups. Hence, they were discarded and an 18-item version (BSQ-18) was obtained, which is considered invariant as regards gender. In addition, there is a direct relationship between the scores of the BSQ-18 version and the body mass index, waist circumference, and fat percentage. Satisfactory indicators were found as regards stability.
ConclusionsThe BSQ-18 can be used with men and women, and has high reliability indicators to be conducted in clinical settings to assess eating disorders and obesity among university students.
Analizar las propiedades psicométricas, estructura interna y relación con indicadores antropométricos del Body Shape Questionnaire (BSQ) en universitarios mexicanos, partiendo de un enfoque de la invarianza de medición.
MétodosSe realizó un estudio instrumental, orientado a la evaluación de las propiedades psicométricas, validez y fiabilidad, del BSQ. Se realizó análisis de invarianza de la medición por el método de estimación mínimos cuadrados ponderados con varianza ajustada y correlaciones policóricas, previa evaluación de diferentes modelos de medición del BSQ en cada grupo. Las puntuaciones de la versión final se correlacionaron con indicadores antropométricos mediante el coeficiente de correlación de Pearson.
ResultadosEn el análisis dimensional, todos los modelos previos del BSQ presentan índices de ajuste favorables, aunque aquellos de un solo factor presente son los que tienen evidencia más robusta. Se aceptó la invarianza configural, lo que indica que la estructura unidimensional es común a varones y mujeres. Sin embargo, las cargas factoriales de 16 ítems fueron estadísticamente diferentes entre los grupos, por lo que se descartaron y se obtuvo una versión de 18 ítems (BSQ-18), que se considera invariante respecto al sexo. Además, hay relación directa entre las puntuaciones de la versión del BSQ-18 y el índice de masa corporal, la circunferencia de cintura y el porcentaje de grasa. En cuanto a la fiabilidad, se hallaron indicadores satisfactorios.
ConclusionesEl BSQ-18 es aplicable tanto a varones como a mujeres y tiene indicadores de fiabilidad elevados que posibilitan su uso en entornos clínicos para la evaluación en el abordaje de trastornos de la conducta alimentaria y obesidad en jóvenes universitarios.
Body image satisfaction refers to a person’s feelings about and mental image of his or her own body’s size, shape and appearance.1 Body image dissatisfaction has been researched primarily in females as it is a risk factor for eating disorders2; however, at present, studies with men are being undertaken because eating disorders and risk behaviours for eating disorders are also seen in males, if at a lesser prevalence.3 Given the importance of this variable, validated and reliable instruments are needed for its analysis.
One of the most widely used instruments for evaluating body dissatisfaction is the Body Shape Questionnaire (BSQ).4 The psychometric properties of this instrument have been analysed in various countries according to various methodologies. For example, the original study did not use factor analysis to determine the scale’s dimensionality, although this is deduced to have been an implicit choice as the use of a single score was proposed. Subsequent instrumental studies of the BSQ involved one-dimensional,5 2-factor6,7 and 4-factor8,9 structures, but they were based on an exploratory method for deriving factors, specifically the Little Jiffy approach (analysis of main components, Kaiser rule and Varimax rotation), the implementation of which in psychometric studies is being questioned due to the unsuitability of the procedures (e.g. the lack of discrimination between communality and specificity).10 One of the consequences of this is that, as orthogonal rotation is used, interfactor correlations are not reported, even when the presence of significant cross loads could indicate factor overlap.6 After that, ostensibly equivalent short forms were developed11,12 that assumed the construct to be one-dimensional. Later on, using a confirmatory approach,13 the original version and the short forms were analysed as one-dimensional, and favourable fit indicators were obtained. For this reason, it is highly likely that a single latent variable accounts for BSQ scores. Finally, while there is an account of an analysis of the BSQ-1411 in Mexican adolescents,14 a detailed analysis of the results reveals it to be an improper solution considering that the variance explained for each item cannot exceed the unit; this would render the results inconclusive.
Furthermore, doubt has been cast on the use of questionnaires designed to measure females' body image satisfaction in groups of males as differences between the sexes in representations of this construct have been observed. In other words, measurement is not invariant.15 Measurement invariance (MI) is a necessary condition for establishing fair comparisons between groups, i.e. comparisons without bias inherent to the measurement process.16
Some studies have reported that in groups of young people, females, compared to males, perceive themselves as fatter,17 have more fear of gaining weight and concern for their body image, experience more irritability and dissatisfaction with their figure, and go on more diets.18 On the other hand, one study found no differences by sex in adolescents 12–13 years of age, although it did observe variations in subsequent ages, indicating that body image dissatisfaction starts around 12–16 years of age.19 However, the above-mentioned studies may have overlooked the MI analysis, meaning that the validity of their inferences may be compromised.
In the Mexican population in particular, underweight women perceive themselves to have a normal body weight, whereas obese women underestimate their obesity. Obese men have a body image consistent with their body mass index (BMI), but underweight men underestimate their own size.20 It has been reported that waist circumference (WC) is an important factor in body self-concept8 and that people with a higher waist-to-hip ratio and a higher WC are more sensitive to their own overweight or obese status and have a desire to look thinner.9 Young men whose main leisure activity is sport show greater body image satisfaction; this association is not seen in women.10
The objectives of this study are to analyse: a) the MI of the BSQ between males and females, subsequent to a study of the BSQ’s internal structure, with respect to both the various models found in the literature and the short-form 14-item questionnaire; b) the differences in means between males and females with the resulting version of the BSQ; and c) the relationship between anthropometric indicators and BSQ scores.
This study is significant because it is the first study of the BSQ to analyse its internal structure from an MI perspective with a view to discovering possible measurement bias related to sex since, although similar BSQ scores have been seen in some age groups, others have shown differences. However, despite the debate with regard to sex, the BSQ may be useful for future research. Although body image is considered important for females due to existing social pressure, at present males are not free from said social pressure; hence, it might apply to both sexes. Moreover, the known relationship between body image satisfaction and mental health is to be taken into consideration.11
Ethical considerationsThe research protocol was reviewed and approved by an independent ethics committee (record number DGI40500201891). The study participants were informed of the study's aims and signed the informed consent form. Data confidentiality was ensured.
MethodsAn instrumental study was conducted with the aim of evaluating the BSQ's psychometric properties, validity and reliability.
ParticipantsA non-probabilistic sample consisting of 1,474 students (48.8% males and 51.2% females) from Universidad Veracruzana [Veracruz University] in Mexico (mean age 19 ± 2.3 years) was enrolled. That sample consisted of young people from all the areas of academic study offered in the Veracruz region: biological/agricultural sciences, health sciences, economics/administration, humanities and technical subjects.
InstrumentsThe Spanish version of the BSQ,6 which evaluates body image satisfaction or dissatisfaction through 34 items, each with a six-option ordinal response, was used.
In addition, anthropometric measurements were taken to determine BMI (weight and height), body fat percentage (BFP) and WC. Trained dieticians took the anthropometric measurements. The subjects' height was measured with them wearing neither shoes nor hair accessories. The subjects were weighed while wearing as little clothing as possible, with no footwear and with an empty bladder, using an OMRON scale with a body composition monitor, which also measured BFP. WC was measured with the torso uncovered by locating the midpoint between the costal margin and the iliac crest while ensuring the abdomen was relaxed.
ProcedureInitially, the intelligibility of the scale was analysed by requesting the opinion of 40 Mexican university students (20 males) with the same characteristics as the sample evaluated. This revealed that five items (5, 8, 9, 24 and 28) used words that were difficult to understand for both groups as they were not used in a Mexican context. Hence, certain words were replaced (“carne” was replaced with “cuerpo” [body fat]; “fijarse” was replaced with “poner atención” [focus on] and “michelines” was replaced with “llantas” [love handles]). As item 15 referred to “vestidos” (clothes), which in Mexico means only “dresses”, it was replaced with the generic term “ropa” (clothing).
Three experts on body image-related topics and on working with young people reviewed this revised version in order to ensure that the items' intended meaning was not lost. Subsequently, another 40 students (20 males) were asked for their opinion on the revised version; as they found its items comprehensible, it was considered finalised.
Finally, students were invited to take part in the study, and those who agreed to do so were provided with the informed consent form and the questionnaire for them to fill in individually.
Data analysisA preliminary analysis of distribution, asymmetry (g1) and kurtosis (g2) statistics was performed in order to observe distance from univariate normality, with maximum expected values of 2 and 7, respectively.21
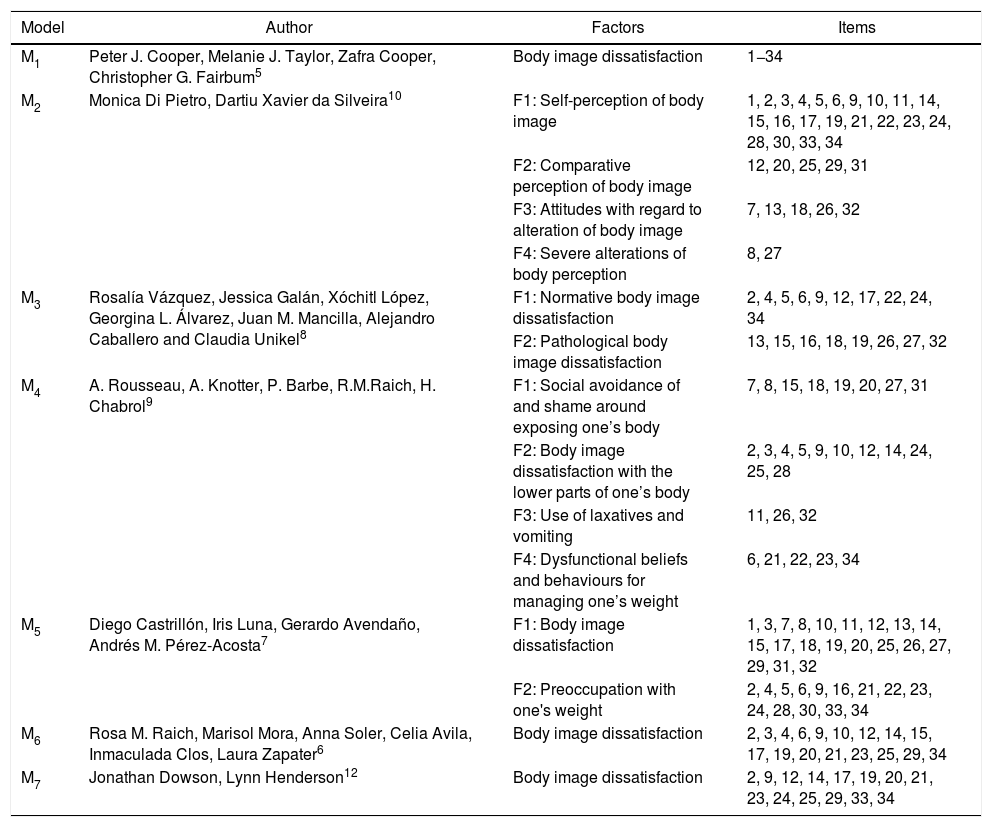
The MI analysis was performed with the program Mplus version 722 using the weighted least squares estimation method with variance adjusted based on polychoric matrices as the items were ordinal measures. For the assessment of the individual models, the root mean square error of approximation (RMSEA) (≤0.06), Tucker-Lewis index (TLI), comparative fit index (CFI) (≥0.95)23 and weighted root mean square residual (WRMR) (<0.90) fit statistics were used.24 The results of the χ2 test were not recorded due to its sensitivity to the sample size, which could have resulted in inaccurate conclusions considering the dimensions of the study sample (n >1,000). Before the MI analysis, all the models found in the literature were evaluated in each group of males and females (Table 1), and the one with the best psychometric indicators (fit statistics) was selected:
BSQ measurement models.
| Model | Author | Factors | Items |
|---|---|---|---|
| M1 | Peter J. Cooper, Melanie J. Taylor, Zafra Cooper, Christopher G. Fairbum5 | Body image dissatisfaction | 1−34 |
| M2 | Monica Di Pietro, Dartiu Xavier da Silveira10 | F1: Self-perception of body image | 1, 2, 3, 4, 5, 6, 9, 10, 11, 14, 15, 16, 17, 19, 21, 22, 23, 24, 28, 30, 33, 34 |
| F2: Comparative perception of body image | 12, 20, 25, 29, 31 | ||
| F3: Attitudes with regard to alteration of body image | 7, 13, 18, 26, 32 | ||
| F4: Severe alterations of body perception | 8, 27 | ||
| M3 | Rosalía Vázquez, Jessica Galán, Xóchitl López, Georgina L. Álvarez, Juan M. Mancilla, Alejandro Caballero and Claudia Unikel8 | F1: Normative body image dissatisfaction | 2, 4, 5, 6, 9, 12, 17, 22, 24, 34 |
| F2: Pathological body image dissatisfaction | 13, 15, 16, 18, 19, 26, 27, 32 | ||
| M4 | A. Rousseau, A. Knotter, P. Barbe, R.M.Raich, H. Chabrol9 | F1: Social avoidance of and shame around exposing one’s body | 7, 8, 15, 18, 19, 20, 27, 31 |
| F2: Body image dissatisfaction with the lower parts of one’s body | 2, 3, 4, 5, 9, 10, 12, 14, 24, 25, 28 | ||
| F3: Use of laxatives and vomiting | 11, 26, 32 | ||
| F4: Dysfunctional beliefs and behaviours for managing one’s weight | 6, 21, 22, 23, 34 | ||
| M5 | Diego Castrillón, Iris Luna, Gerardo Avendaño, Andrés M. Pérez-Acosta7 | F1: Body image dissatisfaction | 1, 3, 7, 8, 10, 11, 12, 13, 14, 15, 17, 18, 19, 20, 25, 26, 27, 29, 31, 32 |
| F2: Preoccupation with one's weight | 2, 4, 5, 6, 9, 16, 21, 22, 23, 24, 28, 30, 33, 34 | ||
| M6 | Rosa M. Raich, Marisol Mora, Anna Soler, Celia Avila, Inmaculada Clos, Laura Zapater6 | Body image dissatisfaction | 2, 3, 4, 6, 9, 10, 12, 14, 15, 17, 19, 20, 21, 23, 25, 29, 34 |
| M7 | Jonathan Dowson, Lynn Henderson12 | Body image dissatisfaction | 2, 9, 12, 14, 17, 19, 20, 21, 23, 24, 25, 29, 33, 34 |
MI was evaluated gradually according to the specialised literature.25 In configural invariance, equality of instrument configuration in males and females was restricted; to evaluate metric invariance, equality of factor loadings (λ) between groups was proposed; finally, strong invariance reported equality of thresholds (τ) between groups. Strict invariance (residual equality) was not evaluated, as strong invariance was sufficient to compare the means for the groups evaluated.
Degree of MI was evaluated by comparing fit statistics between nested models (e.g. comparing the configural invariance model to the metric invariance model). Specifically, CFI and RMSEA variations were considered based on proposals by Chen26 adapted for these purposes (rejecting invariance if ΔCFI <–0.01 and ΔRMSEA ≥0.01), Meade27 (rejecting if ΔCFI <–0.002 and ΔRMSEA ≥0.007) and Marsh28 (it is expected that ΔTLI = 0).
Given that the above-mentioned indicators (CFI and RMSEA) assessed the model in a general way, modification indices were considered29 in order to ascertain whether it was necessary to make item-level changes to the model (e.g. determine which parameters should be abandoned) to improve its fit, with the objective of detecting non-invariant items on a different level, thus arriving at partial invariance.
To finish, latent mean differences between males and females were calculated; both statistically significant differences (p < 0.05) and practically significant differences (Δκ*)30 were determined and assessed according to the following criteria: 0.2 = small, 0.5 = moderate and 0.8 = large. According to the literature reviewed, higher scores could be expected in women. The relationship of BFP and WC to the scores for the final version of the BSQ was established in the same way; a direct, significant association (>0.20) was expected.31
Reliability was calculated both for the construct and for the scores seen. For construct reliability, the ω coefficient was calculated,32 expecting magnitudes >0.80.33 For score reliability, the tau-equivalent model (statistical equality of factor loadings) was evaluated as a requirement for the use of the coefficient alpha. Based on the congeneric model (the final 18-item version), the factor loadings were equalised and the two nested models were compared according to the criteria used in the MI analysis (ΔCFI). It was then reported along with its 95% confidence intervals (95% CIs).34
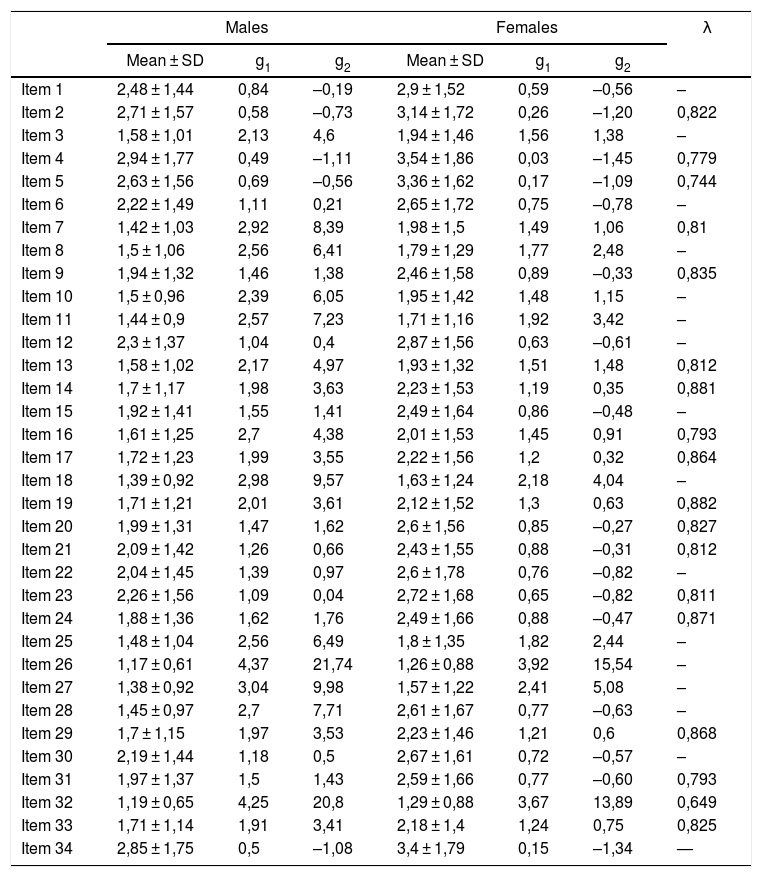
ResultsThe descriptive characteristics of the items (Table 2) had slightly higher averages in the group of females, although the indicators of asymmetry and kurtosis were seen to be homogeneous between the two groups, with acceptable magnitudes for most items (g1 <2; g2 <7).
Descriptive statistics for BSQ items by group (n = 2,036).
| Males | Females | λ | |||||
|---|---|---|---|---|---|---|---|
| Mean ± SD | g1 | g2 | Mean ± SD | g1 | g2 | ||
| Item 1 | 2,48 ± 1,44 | 0,84 | –0,19 | 2,9 ± 1,52 | 0,59 | –0,56 | – |
| Item 2 | 2,71 ± 1,57 | 0,58 | –0,73 | 3,14 ± 1,72 | 0,26 | –1,20 | 0,822 |
| Item 3 | 1,58 ± 1,01 | 2,13 | 4,6 | 1,94 ± 1,46 | 1,56 | 1,38 | – |
| Item 4 | 2,94 ± 1,77 | 0,49 | –1,11 | 3,54 ± 1,86 | 0,03 | –1,45 | 0,779 |
| Item 5 | 2,63 ± 1,56 | 0,69 | –0,56 | 3,36 ± 1,62 | 0,17 | –1,09 | 0,744 |
| Item 6 | 2,22 ± 1,49 | 1,11 | 0,21 | 2,65 ± 1,72 | 0,75 | –0,78 | – |
| Item 7 | 1,42 ± 1,03 | 2,92 | 8,39 | 1,98 ± 1,5 | 1,49 | 1,06 | 0,81 |
| Item 8 | 1,5 ± 1,06 | 2,56 | 6,41 | 1,79 ± 1,29 | 1,77 | 2,48 | – |
| Item 9 | 1,94 ± 1,32 | 1,46 | 1,38 | 2,46 ± 1,58 | 0,89 | –0,33 | 0,835 |
| Item 10 | 1,5 ± 0,96 | 2,39 | 6,05 | 1,95 ± 1,42 | 1,48 | 1,15 | – |
| Item 11 | 1,44 ± 0,9 | 2,57 | 7,23 | 1,71 ± 1,16 | 1,92 | 3,42 | – |
| Item 12 | 2,3 ± 1,37 | 1,04 | 0,4 | 2,87 ± 1,56 | 0,63 | –0,61 | – |
| Item 13 | 1,58 ± 1,02 | 2,17 | 4,97 | 1,93 ± 1,32 | 1,51 | 1,48 | 0,812 |
| Item 14 | 1,7 ± 1,17 | 1,98 | 3,63 | 2,23 ± 1,53 | 1,19 | 0,35 | 0,881 |
| Item 15 | 1,92 ± 1,41 | 1,55 | 1,41 | 2,49 ± 1,64 | 0,86 | –0,48 | – |
| Item 16 | 1,61 ± 1,25 | 2,7 | 4,38 | 2,01 ± 1,53 | 1,45 | 0,91 | 0,793 |
| Item 17 | 1,72 ± 1,23 | 1,99 | 3,55 | 2,22 ± 1,56 | 1,2 | 0,32 | 0,864 |
| Item 18 | 1,39 ± 0,92 | 2,98 | 9,57 | 1,63 ± 1,24 | 2,18 | 4,04 | – |
| Item 19 | 1,71 ± 1,21 | 2,01 | 3,61 | 2,12 ± 1,52 | 1,3 | 0,63 | 0,882 |
| Item 20 | 1,99 ± 1,31 | 1,47 | 1,62 | 2,6 ± 1,56 | 0,85 | –0,27 | 0,827 |
| Item 21 | 2,09 ± 1,42 | 1,26 | 0,66 | 2,43 ± 1,55 | 0,88 | –0,31 | 0,812 |
| Item 22 | 2,04 ± 1,45 | 1,39 | 0,97 | 2,6 ± 1,78 | 0,76 | –0,82 | – |
| Item 23 | 2,26 ± 1,56 | 1,09 | 0,04 | 2,72 ± 1,68 | 0,65 | –0,82 | 0,811 |
| Item 24 | 1,88 ± 1,36 | 1,62 | 1,76 | 2,49 ± 1,66 | 0,88 | –0,47 | 0,871 |
| Item 25 | 1,48 ± 1,04 | 2,56 | 6,49 | 1,8 ± 1,35 | 1,82 | 2,44 | – |
| Item 26 | 1,17 ± 0,61 | 4,37 | 21,74 | 1,26 ± 0,88 | 3,92 | 15,54 | – |
| Item 27 | 1,38 ± 0,92 | 3,04 | 9,98 | 1,57 ± 1,22 | 2,41 | 5,08 | – |
| Item 28 | 1,45 ± 0,97 | 2,7 | 7,71 | 2,61 ± 1,67 | 0,77 | –0,63 | – |
| Item 29 | 1,7 ± 1,15 | 1,97 | 3,53 | 2,23 ± 1,46 | 1,21 | 0,6 | 0,868 |
| Item 30 | 2,19 ± 1,44 | 1,18 | 0,5 | 2,67 ± 1,61 | 0,72 | –0,57 | – |
| Item 31 | 1,97 ± 1,37 | 1,5 | 1,43 | 2,59 ± 1,66 | 0,77 | –0,60 | 0,793 |
| Item 32 | 1,19 ± 0,65 | 4,25 | 20,8 | 1,29 ± 0,88 | 3,67 | 13,89 | 0,649 |
| Item 33 | 1,71 ± 1,14 | 1,91 | 3,41 | 2,18 ± 1,4 | 1,24 | 0,75 | 0,825 |
| Item 34 | 2,85 ± 1,75 | 0,5 | –1,08 | 3,4 ± 1,79 | 0,15 | –1,34 | — |
λ: factor loadings, final model (BSQ-18); g1: asymmetry; g2: kurtosis; SD: standard deviation.
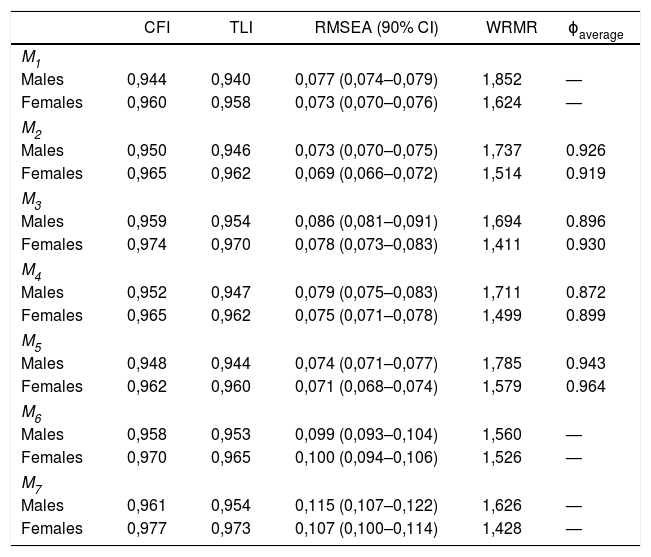
With regard to the prior dimensional analysis of the BSQ models found, all of them (from M1 to M7) had favourable fit indicators, although this was observed to the greatest degree in the group of females (Table 3). In general, interfactor correlations (ϕaverage >0.850) were so high that they indicated multicollinearity, i.e. empirical overlap between factors which did not allow for independent interpretation of each of them. In this regard, M1 and M7 best represented the (one-dimensional) construct, but M1 was used as M7 was a short form, and given that this is the first study aimed at evaluating the MI of the BSQ, it would be appropriate to start with the full scale.
Fit statistics for the BSQ models with respect to sex.
| CFI | TLI | RMSEA (90% CI) | WRMR | ϕaverage | |
|---|---|---|---|---|---|
| M1 | |||||
| Males | 0,944 | 0,940 | 0,077 (0,074–0,079) | 1,852 | — |
| Females | 0,960 | 0,958 | 0,073 (0,070–0,076) | 1,624 | — |
| M2 | |||||
| Males | 0,950 | 0,946 | 0,073 (0,070–0,075) | 1,737 | 0.926 |
| Females | 0,965 | 0,962 | 0,069 (0,066–0,072) | 1,514 | 0.919 |
| M3 | |||||
| Males | 0,959 | 0,954 | 0,086 (0,081–0,091) | 1,694 | 0.896 |
| Females | 0,974 | 0,970 | 0,078 (0,073–0,083) | 1,411 | 0.930 |
| M4 | |||||
| Males | 0,952 | 0,947 | 0,079 (0,075–0,083) | 1,711 | 0.872 |
| Females | 0,965 | 0,962 | 0,075 (0,071–0,078) | 1,499 | 0.899 |
| M5 | |||||
| Males | 0,948 | 0,944 | 0,074 (0,071–0,077) | 1,785 | 0.943 |
| Females | 0,962 | 0,960 | 0,071 (0,068–0,074) | 1,579 | 0.964 |
| M6 | |||||
| Males | 0,958 | 0,953 | 0,099 (0,093–0,104) | 1,560 | — |
| Females | 0,970 | 0,965 | 0,100 (0,094–0,106) | 1,526 | — |
| M7 | |||||
| Males | 0,961 | 0,954 | 0,115 (0,107–0,122) | 1,626 | — |
| Females | 0,977 | 0,973 | 0,107 (0,100–0,114) | 1,428 | — |
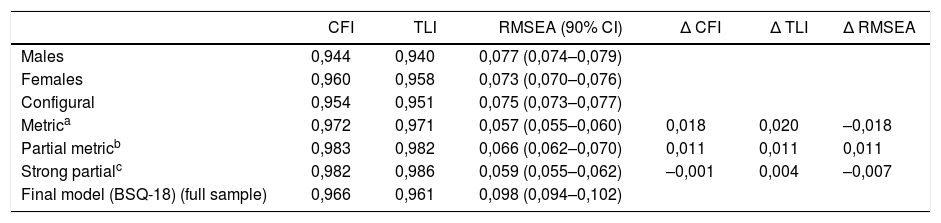
Next, configural invariance presented suitable fit statistics, indicating that the one-dimensional structure was shared by males and females. Although it is true that variations in fit indices (CFI, TLI and RMSEA) favoured fulfilment of this step, the information provided by the modification indices (χ2 > 10; p < 0.001) indicated that the factor loadings for 16 items (1, 3, 6, 8, 10, 11, 12, 15, 18, 22, 25, 26, 27, 28, 30 and 34) were not statistically significant between groups. In relation to the strong invariance performed with the 18 remaining items, just one threshold turned out not to be invariant; this did not significantly impact consideration of the 18-item version of the BSQ (BSQ-18) as invariant with respect to sex,35 with factor loadings of a moderate to high magnitude (λ > 0.60) which were statistically significant (Table 4).
Fit statistics for the measurement invariance of the BSQ with respect to sex.
| CFI | TLI | RMSEA (90% CI) | Δ CFI | Δ TLI | Δ RMSEA | |
|---|---|---|---|---|---|---|
| Males | 0,944 | 0,940 | 0,077 (0,074–0,079) | |||
| Females | 0,960 | 0,958 | 0,073 (0,070–0,076) | |||
| Configural | 0,954 | 0,951 | 0,075 (0,073–0,077) | |||
| Metrica | 0,972 | 0,971 | 0,057 (0,055–0,060) | 0,018 | 0,020 | –0,018 |
| Partial metricb | 0,983 | 0,982 | 0,066 (0,062–0,070) | 0,011 | 0,011 | 0,011 |
| Strong partialc | 0,982 | 0,986 | 0,059 (0,055–0,062) | –0,001 | 0,004 | –0,007 |
| Final model (BSQ-18) (full sample) | 0,966 | 0,961 | 0,098 (0,094–0,102) |
Finally, with regard to latent mean differences, females had significantly greater body image dissatisfaction than males (Δκ = 0.442; t = 7.967; p < 0.001) with a moderate magnitude (Δκ* = 0.412).30
Finally, a significant direct relationship was found between BMI and BSQ-18 scores in the full sample (r = 0.395; p < 0.001), as well as in males only (rmales = 0.413; p < 0.001) and females only (rfemales = 0.442; p < 0.001). BSQ-18 scores were found to have a similar relationship to WC (r = 0.327; p < 0.001; rmales = 0.412; p < 0.001; rfemales = 0.434; p < 0.001) and to BFP (r = 0.465; p < 0.001; rmales = 0.412; p < 0.001; rfemales = 0.445; p < 0.001).
Regarding construct reliability, a satisfactory ω coefficient (0.947) was found. With respect to the tau-equivalence analysis, the fit of the model was suitable (CFI = 0.974; RMSEA = 0.085) and did not significantly differ from the congeneric model (final model; Table 4). In that sense, the coefficient alpha could be calculated, which resulted in a high magnitude (α = 0.957; 95% CI, 0.952−0.961).
DiscussionRecognition that eating disorders are not a problem exclusive to females calls for a psychometric review of instruments used to evaluate eating disorders with more rigorous analytical models. Given the growing body of studies that compare men to women with regard to body image dissatisfaction and the lack of reports that analyse the potential for sex bias in the BSQ, which was originally developed for women, this study was conducted using an MI approach.
A literature review found various models with two or more factors,5–9 but in this study the model with the best psychometric function in males and females separately was the original (one-dimensional) model.4 A notable finding of that analysis was the high interfactor correlation in the other models, which may point to factor overlap not reported in prior studies which could have yielded invalid results.
Moreover, once the MI parameters had been analysed, it was found that various items yielded different representations of the construct between males and females; this would point to biased measurement which would preclude proper between-group comparison, as seen in other similar studies.15 For this reason, after the MI analysis was performed, it was possible to obtain an 18-item version (BSQ-18) applicable to both males and females. Similarly, high reliability indicators (>0.95) were obtained which would make its use in clinical settings possible. Finally, the BSQ-18 showed significant associations with anthropometric indicators (such as BMI), which reveals its validity with respect to external criteria.
Having a scale validated in a Mexican population applicable to males and females and enabling evaluation of body image satisfaction may provide information that aids in preventing the onset of both physiological and mental diseases (such as eating disorders), since at present both sexes are subject to health-endangering behaviour resulting from body image dissatisfaction,3 although this study reaffirmed the prior finding that females suffer from greater body image dissatisfaction than males.18
The relationship found between greater body image dissatisfaction and a higher BMI, WC and BFP also demonstrated its potential usefulness in studying obesity problems which are increasingly common among young people. While the study of the relationship between body image satisfaction and obesity is incipient,8,9 this scale opens up the possibility of conducting studies that elucidate the extent to which body image dissatisfaction influences obesity and vice versa. This instrument would also enable evaluation of the effect of both treatment and prevention interventions.
Conflicts of interestThe authors have no conflicts of interest to declare.
The authors would like to thank Dr Antonia Barranca Enríquez and Dr Carolina Palmeros Exsome as well as all the staff at the Coordinación de Odontología [Organisation for Dentistry] and the Coordinación de Nutrición [Organisation for Nutrition] of the Centros de Estudios y Servicios en Salud [Centres for Health Studies and Services] at the Universidad Veracruzana who helped with the data collection.
Please cite this article as: Dominguez-Lara S, Aguirre-Pérez S, Romo-González T, Herrera-Meza S, Campos-Uscanga Y. Análisis psicométrico del Body Shape Questionnaire en universitarios mexicanos. Rev Colomb Psiquiat. 2020;49:154–161.
