


Social stigma is the assigning of negative stereotypes to people with schizophrenia. Different measurement tools have been used to evaluate this, including knowledge scales. The aim of this study was to evaluate the public stigma by measuring this knowledge and relate the degree of information with variables that have shown to influence on stigma presented by the affected population.
MethodsThe sample was composed of 399 people and the inclusion criterion was being between 18 and 65 years of age. The “questionnaire of knowledge on schizophrenia” was applied, as well as a questionnaire to collect sociodemographic information. Participants were recruited in places with large crowds. The following analyses were performed: multiple correlations, non-parametric bivariate and hierarchical clusters.
ResultsThe questionnaire had two dimensions: “beliefs on the knowledge of schizophrenia” and “attitudes towards schizophrenia”. There are significant differences between them, and the contact with people with SMI. In the analysis of clusters, there was difference in the two groups according to the combination of the two dimensions of the tools.
ConclusionsIt is highlighted that none of the dimensions measures true knowledge, and the questionnaire has an attitudinal dimension. More than contact itself, it is the type of interaction of a relevant variable at the level of stigma that questions the traditional hypothesis of contact. Further research is required on the characteristics of the tool and the aspects of the contact associated to a lower level of stigma in the population.
El estigma público es la adscripción de estereotipos negativos a las personas con diagnóstico de esquizofrenia. Se han utilizado distintos instrumentos para evaluarlo, entre los que destacan las escalas de conocimiento. El objetivo del estudio es evaluar el estigma público a través de una medida de conocimiento y relacionar el nivel de información con variables con demostrada influencia en el estigma que presenta la población.
MétodosLa muestra fue de 399 personas; el criterio de inclusión fue tener entre 18 y 65 años. Se aplicó el Cuestionario de conocimiento sobre la esquizofrenia y un instrumento para recolectar información sociodemográfica. Los participantes fueron reclutados en lugares de gran afluencia de público. Se realizaron análisis de correspondencias múltiples no paramétricos bivariables y de conglomerados jerárquicos.
ResultadosEl cuestionario presenta dos dimensiones: «Creencias sobre el conocimiento de la esquizofrenia» y «Actitudes hacia la esquizofrenia»; existen diferencias significativas entre estas y el contacto con personas con un trastorno mental grave. En el análisis por conglomerados, se encontraron 3 grupos diferenciados en función de la combinación de las 2 dimensiones del instrumento.
ConclusionesDestaca que ninguna de las 2 dimensiones mide conocimiento veraz, y el cuestionario tiene una dimensión actitudinal. Más que el contacto en sí, es el tipo de interacción una variable relevante en el nivel de estigma, lo que cuestiona la hipótesis tradicional del contacto. Se requiere investigar mejor las características del instrumento y los aspectos del contacto que se asocian a un menor nivel de estigma en la población.
Stigma can be considered as the principal source of suffering for people diagnosed with severe mental illnesses (SMI), mainly schizophrenia, because of the significant psychosocial impact it generates.1,2 Stigma refers to the process of labelling, loss of status and discrimination a person is subject to when they have a characteristic that the social group belittles.3 Among the main consequences of stigma are the deterioration in self-image,4 difficulties in access to employment, housing and social relationships,5 and the barrier effect it generates in health services.6
Stigma is a complex phenomenon with different degrees; researchers distinguish between structural stigma, public stigma and self-stigma.7
In public stigma, the general population ascribes negative stereotypes to a social group based on prejudice, which translates into discriminatory behaviour.8 People who are diagnosed with schizophrenia are often seen as violent, dangerous, unpredictable and not competent to make their own decisions.9,10 A number of different variables have been found to influence peoples’ attitudes. They include age, educational level and previous contact with somebody with SMI.11 Although in Latin America, and particularly in Chile, the subject has been little studied,12,13 research results are consistent with those found in other parts of the world; there are prejudices and negative attitudes towards people with schizophrenia.14,15
Public stigma has been studied through the beliefs and attitudes of the population towards people with a psychiatric diagnosis.16 Different instruments have been used to evaluate the stigma, including the social distance scales, the semantic differential scale and attitude and knowledge scales.17,18 Some studies show a relationship between the level of information a person has about a psychiatric diagnosis and their attitudes towards that population. This seems to be a dialectical relationship, as it has been found that prejudices towards a certain social group influence the degree and type of information people absorb about that group.18
Information can reduce prejudices, both directly through the questioning of myths, and indirectly by increasing awareness of these people's situation. The information is essentially assessed using quick-to-complete true/false and multiple-choice questionnaires. Measures such as these have the advantage of being relatively easy to apply and score, and they are sensitive to change, so they are used in anti-stigma programmes and reduce social desirability.18
Of these instruments, the information scale used by the World Psychiatric Association to evaluate the educational components of its “open the doors” programme is one of the most widely used.10,19 This measurement tool was adapted and used in a research study in Argentina.13
The few studies to have evaluated stigma in Chile have mainly used attitude scales and instruments of their own. It would therefore be useful to have other measures endorsed in different cultural contexts; particularly if we consider that stigma is a public health problem, as it directly affects the chances of recovery and, consequently, of social inclusion of individuals with severe psychiatric illnesses such as schizophrenia.
The aim of this study was to assess public stigma by measuring knowledge and relating the level of information with variables which, in other cultural contexts, have been shown to influence the stigma the population attaches to people with schizophrenia.
Material and methodsWe conducted a descriptive, cross-sectional study using surveys.
ParticipantsA convenience sample was taken of the general population in the province of Concepción in Chile. The only criterion for inclusion was to be aged 18–65. The sample consisted of 399 people, with a mean age of 39.14±12.56 years (range 18–65). In terms of level of education, 53% had higher education (technical or university); 38% secondary education, and just 8.8% had primary education only. There were no subjects with no formal education.
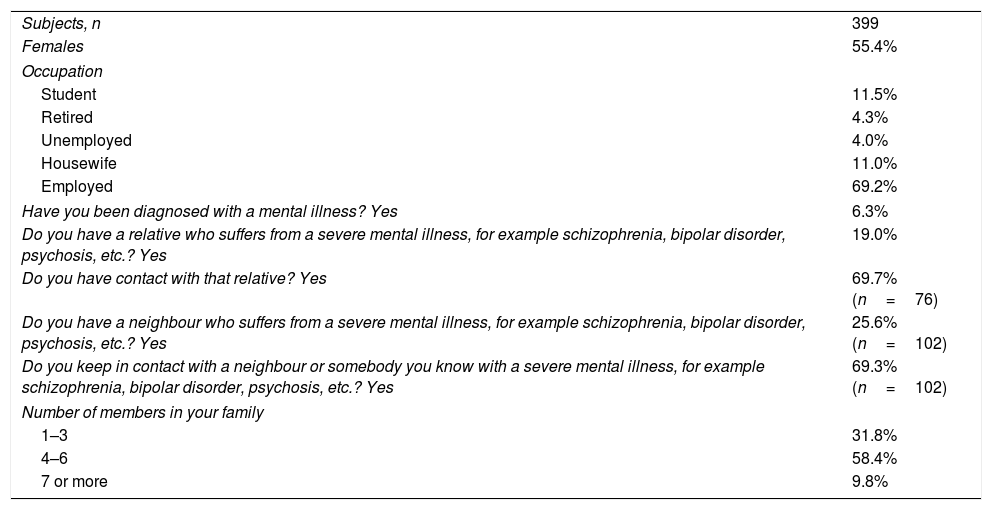
Other socio-demographic characteristics and background and knowledge about schizophrenia are shown in Table 1.
Socio-demographic data for the sample.
| Subjects, n | 399 |
| Females | 55.4% |
| Occupation | |
| Student | 11.5% |
| Retired | 4.3% |
| Unemployed | 4.0% |
| Housewife | 11.0% |
| Employed | 69.2% |
| Have you been diagnosed with a mental illness? Yes | 6.3% |
| Do you have a relative who suffers from a severe mental illness, for example schizophrenia, bipolar disorder, psychosis, etc.? Yes | 19.0% |
| Do you have contact with that relative? Yes | 69.7% (n=76) |
| Do you have a neighbour who suffers from a severe mental illness, for example schizophrenia, bipolar disorder, psychosis, etc.? Yes | 25.6% (n=102) |
| Do you keep in contact with a neighbour or somebody you know with a severe mental illness, for example schizophrenia, bipolar disorder, psychosis, etc.? Yes | 69.3% (n=102) |
| Number of members in your family | |
| 1–3 | 31.8% |
| 4–6 | 58.4% |
| 7 or more | 9.8% |
Instrument used by the WHO in the implementation of the “open the doors” programme.1,19 In this study, we used the version adapted in Argentina,13 which consists of ten items: eight items have a yes/no/don’t know answer format; the ninth item, which investigates the causes of schizophrenia, gives the multiple choice options: genetic, environmental or both; and the last item, on knowledge about more effective treatments, gives the options: medication, psychotherapy or both.
We added an additional item which asked the question, “does medical treatment help them to remain stable?”, with the choice being yes/no/don’t know. This question would allow us to evaluate the information people have about the relationship between the illness and medical care, which (in the Chilean context) is relevant for assessing the consolidation of a community mental health model (Table 2). The instrument provides a total score of up to 11 points.
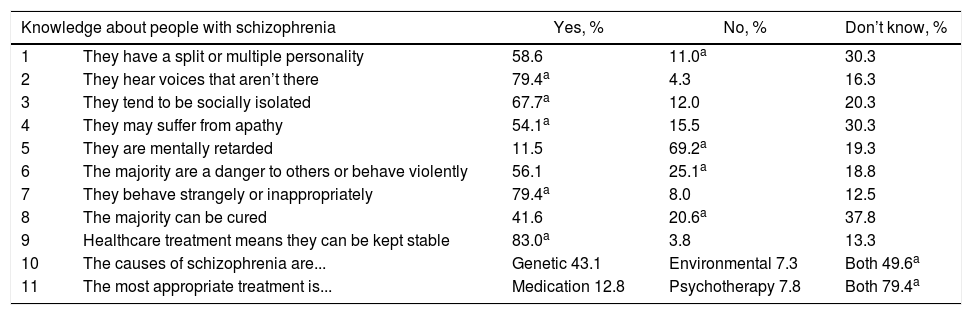
Item response rates.
| Knowledge about people with schizophrenia | Yes, % | No, % | Don’t know, % | |
|---|---|---|---|---|
| 1 | They have a split or multiple personality | 58.6 | 11.0a | 30.3 |
| 2 | They hear voices that aren’t there | 79.4a | 4.3 | 16.3 |
| 3 | They tend to be socially isolated | 67.7a | 12.0 | 20.3 |
| 4 | They may suffer from apathy | 54.1a | 15.5 | 30.3 |
| 5 | They are mentally retarded | 11.5 | 69.2a | 19.3 |
| 6 | The majority are a danger to others or behave violently | 56.1 | 25.1a | 18.8 |
| 7 | They behave strangely or inappropriately | 79.4a | 8.0 | 12.5 |
| 8 | The majority can be cured | 41.6 | 20.6a | 37.8 |
| 9 | Healthcare treatment means they can be kept stable | 83.0a | 3.8 | 13.3 |
| 10 | The causes of schizophrenia are... | Genetic 43.1 | Environmental 7.3 | Both 49.6a |
| 11 | The most appropriate treatment is... | Medication 12.8 | Psychotherapy 7.8 | Both 79.4a |
This included questions about age, gender, marital status, level of education, employment status and number of members in the participant's family. It also asked participants if they had ever been diagnosed with a mental illness. Lastly, they were asked about whether or not they had a relative or neighbour with a severe mental illness and whether or not they had contact with them.
ProcedureThe participants were recruited in places with large gatherings of people: bus terminals, town councils, health-centre waiting rooms, town squares, universities and supermarkets, and in different districts in the selected area.
The instruments were applied by specially trained psychology students. The people who agreed to participate signed an informed consent form which stated the nature of the study and the ethical safeguards in place. In the majority of cases, the questionnaires were self-applied. If a subject had difficulty answering the questions, an interviewer would help them. The data was collected from November to December 2011.
Data analysisThe first review of the database showed <5% missing data in each item, for which a multiple imputation method was applied. A descriptive analysis was then carried out on the socio-demographic variables and, based on the response distributions, an internal consistency analysis was performed. Since this was low, we proceeded to review the structure of the questionnaire using a multiple correspondence analysis, which yielded two dimensions in the instrument.
As the distribution of the data did not conform to a normal curve, non-parametric analyses were used. Bivariate analyses were performed between the dimensions and the socio-demographic variables using the Mann–Whitney U test for dichotomous variables, and the Kruskal–Wallis test for polytomous variables.
Lastly, we analysed hierarchical clusters using the scores for the dimensions in order to classify the participants. We used the Ward metric as distance index, which helped maximise the homogeneity within the groups. We used full grouping as the grouping method. The SPSS version 19.0 software program was used to analyse the results.
ResultsA higher score on the knowledge scale indicates more information about schizophrenia. The average score for correct answers was 6.19±1.898, which is equivalent to 56.2%; the median was 6, with an asymmetry of −0.441; 8.8% of the sample obtained scores from 0 to 3, 63.9% from 4 to 7, and 27.3% over 7. Detailed analysis of the answers showed that 58.6% think that people with schizophrenia have a split personality; 56.1% see them as dangerous and 43.1% believe that the causes are purely genetic (Table 2).
To analyse the structure of the scale, we performed a multiple correspondence analysis. A 2-dimensional model was adapted to the data. The first dimension was called “beliefs on the knowledge about schizophrenia” and considered two categories. The yes/no answers tended to be grouped as one category and the “don’t know” answers as another. These two categories were scored with values 1 and 0, respectively. Higher values in the dimension would indicate that the respondent had a stronger belief in their knowledge about schizophrenia, reflected in fewer “don’t know” answers.
The second dimension referred to peoples’ attitudes based on that knowledge. Negative attitudes were associated with high scores and positive attitudes with low scores. However, there was one group that obtained intermediate scores, so the answers were scored 0, 1 and 2, respectively. This dimension was called “attitudes towards schizophrenia” and was covered by items 1–9. Items 10 (“causes of schizophrenia”) and 11 (“the most appropriate treatment is...”), however, did not seem to be associated with any dimension, so they were excluded from the following analyses.
The analysis of internal consistency of dimension 1 (“beliefs on the knowledge about schizophrenia”) produced a Cronbach's alpha of 0.721; while dimension 2 (“attitudes towards schizophrenia”) produced α=0.523.
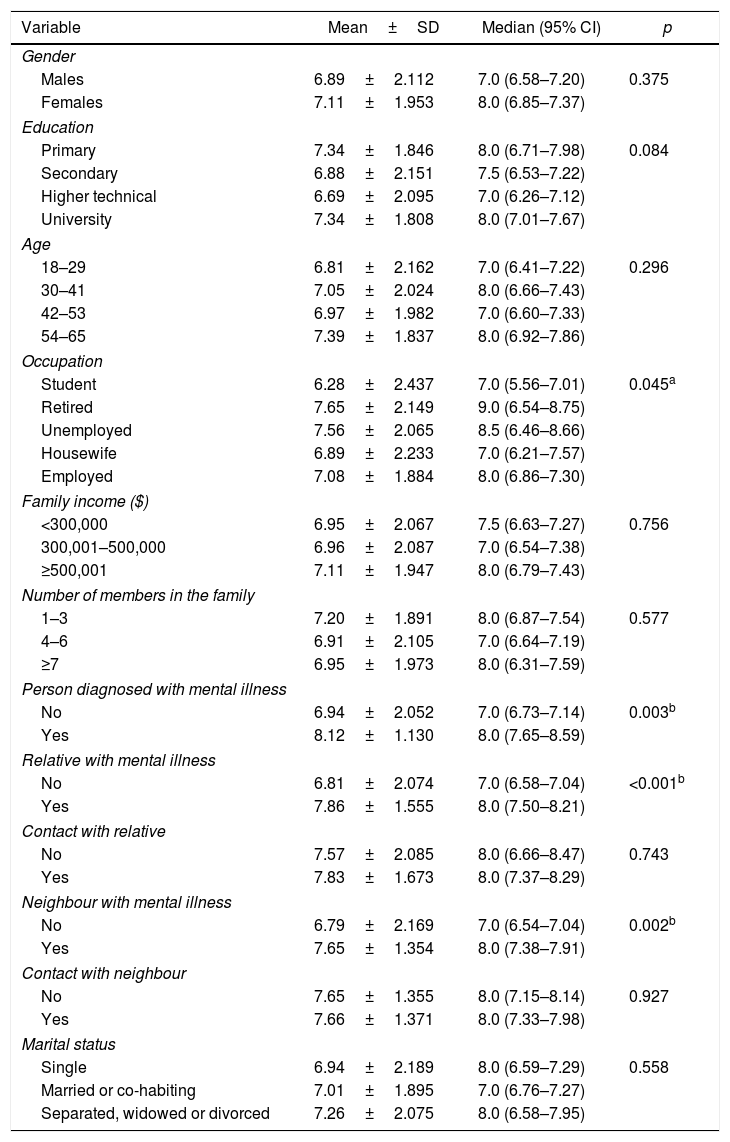
The bivariate analyses between the dimensions and the socio-demographic variables showed no significant differences in dimension 1 according to gender, level of education, age, family income, family size or marital status. Significant differences were found when the person interviewed stated that they had been diagnosed with a severe mental illness (SMI) (U=2.952, p=0.003), had a family member with SMI (U=4.352; p<0.001), or knew a neighbour with SMI (U=3.061, p=0.002). In these situations, there was a stronger belief in the level of knowledge about schizophrenia. In the case of occupation, although there was a significant difference between the different categories of the variable, it was not possible to determine between which it occurred (Table 3).
Results by dimensions. Dimension 1. Trend of knowledge about severe mental illnesses.
| Variable | Mean±SD | Median (95% CI) | p |
|---|---|---|---|
| Gender | |||
| Males | 6.89±2.112 | 7.0 (6.58–7.20) | 0.375 |
| Females | 7.11±1.953 | 8.0 (6.85–7.37) | |
| Education | |||
| Primary | 7.34±1.846 | 8.0 (6.71–7.98) | 0.084 |
| Secondary | 6.88±2.151 | 7.5 (6.53–7.22) | |
| Higher technical | 6.69±2.095 | 7.0 (6.26–7.12) | |
| University | 7.34±1.808 | 8.0 (7.01–7.67) | |
| Age | |||
| 18–29 | 6.81±2.162 | 7.0 (6.41–7.22) | 0.296 |
| 30–41 | 7.05±2.024 | 8.0 (6.66–7.43) | |
| 42–53 | 6.97±1.982 | 7.0 (6.60–7.33) | |
| 54–65 | 7.39±1.837 | 8.0 (6.92–7.86) | |
| Occupation | |||
| Student | 6.28±2.437 | 7.0 (5.56–7.01) | 0.045a |
| Retired | 7.65±2.149 | 9.0 (6.54–8.75) | |
| Unemployed | 7.56±2.065 | 8.5 (6.46–8.66) | |
| Housewife | 6.89±2.233 | 7.0 (6.21–7.57) | |
| Employed | 7.08±1.884 | 8.0 (6.86–7.30) | |
| Family income ($) | |||
| <300,000 | 6.95±2.067 | 7.5 (6.63–7.27) | 0.756 |
| 300,001–500,000 | 6.96±2.087 | 7.0 (6.54–7.38) | |
| ≥500,001 | 7.11±1.947 | 8.0 (6.79–7.43) | |
| Number of members in the family | |||
| 1–3 | 7.20±1.891 | 8.0 (6.87–7.54) | 0.577 |
| 4–6 | 6.91±2.105 | 7.0 (6.64–7.19) | |
| ≥7 | 6.95±1.973 | 8.0 (6.31–7.59) | |
| Person diagnosed with mental illness | |||
| No | 6.94±2.052 | 7.0 (6.73–7.14) | 0.003b |
| Yes | 8.12±1.130 | 8.0 (7.65–8.59) | |
| Relative with mental illness | |||
| No | 6.81±2.074 | 7.0 (6.58–7.04) | <0.001b |
| Yes | 7.86±1.555 | 8.0 (7.50–8.21) | |
| Contact with relative | |||
| No | 7.57±2.085 | 8.0 (6.66–8.47) | 0.743 |
| Yes | 7.83±1.673 | 8.0 (7.37–8.29) | |
| Neighbour with mental illness | |||
| No | 6.79±2.169 | 7.0 (6.54–7.04) | 0.002b |
| Yes | 7.65±1.354 | 8.0 (7.38–7.91) | |
| Contact with neighbour | |||
| No | 7.65±1.355 | 8.0 (7.15–8.14) | 0.927 |
| Yes | 7.66±1.371 | 8.0 (7.33–7.98) | |
| Marital status | |||
| Single | 6.94±2.189 | 8.0 (6.59–7.29) | 0.558 |
| Married or co-habiting | 7.01±1.895 | 7.0 (6.76–7.27) | |
| Separated, widowed or divorced | 7.26±2.075 | 8.0 (6.58–7.95) | |
SD: standard deviation; 95% CI: 95% confidence interval.
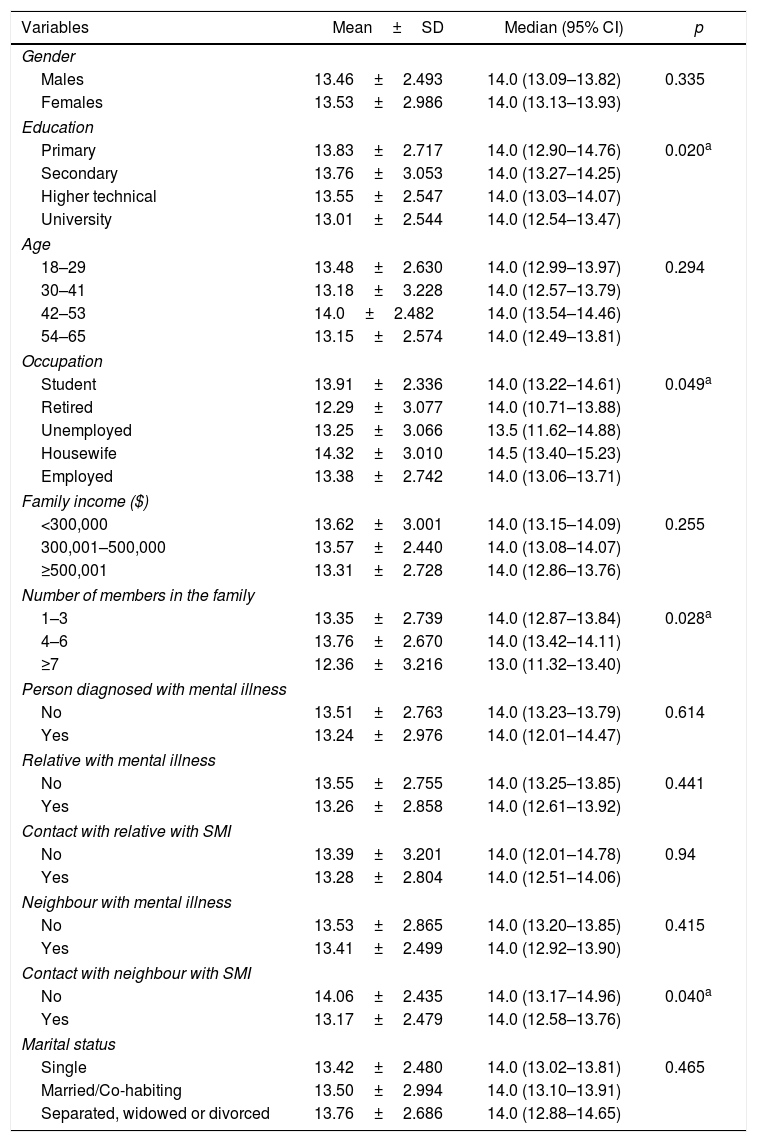
The analysis of dimension 2 (“attitudes towards schizophrenia”) did not show significant differences with gender, age, family income, having a relative with SMI, knowing a neighbour with SMI or the marital status of the respondents. There were significant differences with the size of the family group, education, having contact with a neighbour with SMI and occupation. Large families had a more favourable attitude than medium-sized families (H=7.260, p=0.028); and people with university education had a more favourable attitude than those with only secondary studies (H=9.788, p=0.016). A more positive attitude was also observed among people who had contact with a neighbour diagnosed with an SMI (U=2.056, p=0.040). Lastly, as in dimension 1, it was not possible to determine the trend of the significant difference in the occupation variable (Table 4). However, these results should be interpreted with caution, since the internal consistency of the dimension is poor (Table 4).
Results by dimensions. Dimension 2. Trend of attitude assessment on severe mental illnesses.
| Variables | Mean±SD | Median (95% CI) | p |
|---|---|---|---|
| Gender | |||
| Males | 13.46±2.493 | 14.0 (13.09–13.82) | 0.335 |
| Females | 13.53±2.986 | 14.0 (13.13–13.93) | |
| Education | |||
| Primary | 13.83±2.717 | 14.0 (12.90–14.76) | 0.020a |
| Secondary | 13.76±3.053 | 14.0 (13.27–14.25) | |
| Higher technical | 13.55±2.547 | 14.0 (13.03–14.07) | |
| University | 13.01±2.544 | 14.0 (12.54–13.47) | |
| Age | |||
| 18–29 | 13.48±2.630 | 14.0 (12.99–13.97) | 0.294 |
| 30–41 | 13.18±3.228 | 14.0 (12.57–13.79) | |
| 42–53 | 14.0±2.482 | 14.0 (13.54–14.46) | |
| 54–65 | 13.15±2.574 | 14.0 (12.49–13.81) | |
| Occupation | |||
| Student | 13.91±2.336 | 14.0 (13.22–14.61) | 0.049a |
| Retired | 12.29±3.077 | 14.0 (10.71–13.88) | |
| Unemployed | 13.25±3.066 | 13.5 (11.62–14.88) | |
| Housewife | 14.32±3.010 | 14.5 (13.40–15.23) | |
| Employed | 13.38±2.742 | 14.0 (13.06–13.71) | |
| Family income ($) | |||
| <300,000 | 13.62±3.001 | 14.0 (13.15–14.09) | 0.255 |
| 300,001–500,000 | 13.57±2.440 | 14.0 (13.08–14.07) | |
| ≥500,001 | 13.31±2.728 | 14.0 (12.86–13.76) | |
| Number of members in the family | |||
| 1–3 | 13.35±2.739 | 14.0 (12.87–13.84) | 0.028a |
| 4–6 | 13.76±2.670 | 14.0 (13.42–14.11) | |
| ≥7 | 12.36±3.216 | 13.0 (11.32–13.40) | |
| Person diagnosed with mental illness | |||
| No | 13.51±2.763 | 14.0 (13.23–13.79) | 0.614 |
| Yes | 13.24±2.976 | 14.0 (12.01–14.47) | |
| Relative with mental illness | |||
| No | 13.55±2.755 | 14.0 (13.25–13.85) | 0.441 |
| Yes | 13.26±2.858 | 14.0 (12.61–13.92) | |
| Contact with relative with SMI | |||
| No | 13.39±3.201 | 14.0 (12.01–14.78) | 0.94 |
| Yes | 13.28±2.804 | 14.0 (12.51–14.06) | |
| Neighbour with mental illness | |||
| No | 13.53±2.865 | 14.0 (13.20–13.85) | 0.415 |
| Yes | 13.41±2.499 | 14.0 (12.92–13.90) | |
| Contact with neighbour with SMI | |||
| No | 14.06±2.435 | 14.0 (13.17–14.96) | 0.040a |
| Yes | 13.17±2.479 | 14.0 (12.58–13.76) | |
| Marital status | |||
| Single | 13.42±2.480 | 14.0 (13.02–13.81) | 0.465 |
| Married/Co-habiting | 13.50±2.994 | 14.0 (13.10–13.91) | |
| Separated, widowed or divorced | 13.76±2.686 | 14.0 (12.88–14.65) | |
SD: standard deviation; 95% CI: 95% confidence interval; SMI: severe mental illness.
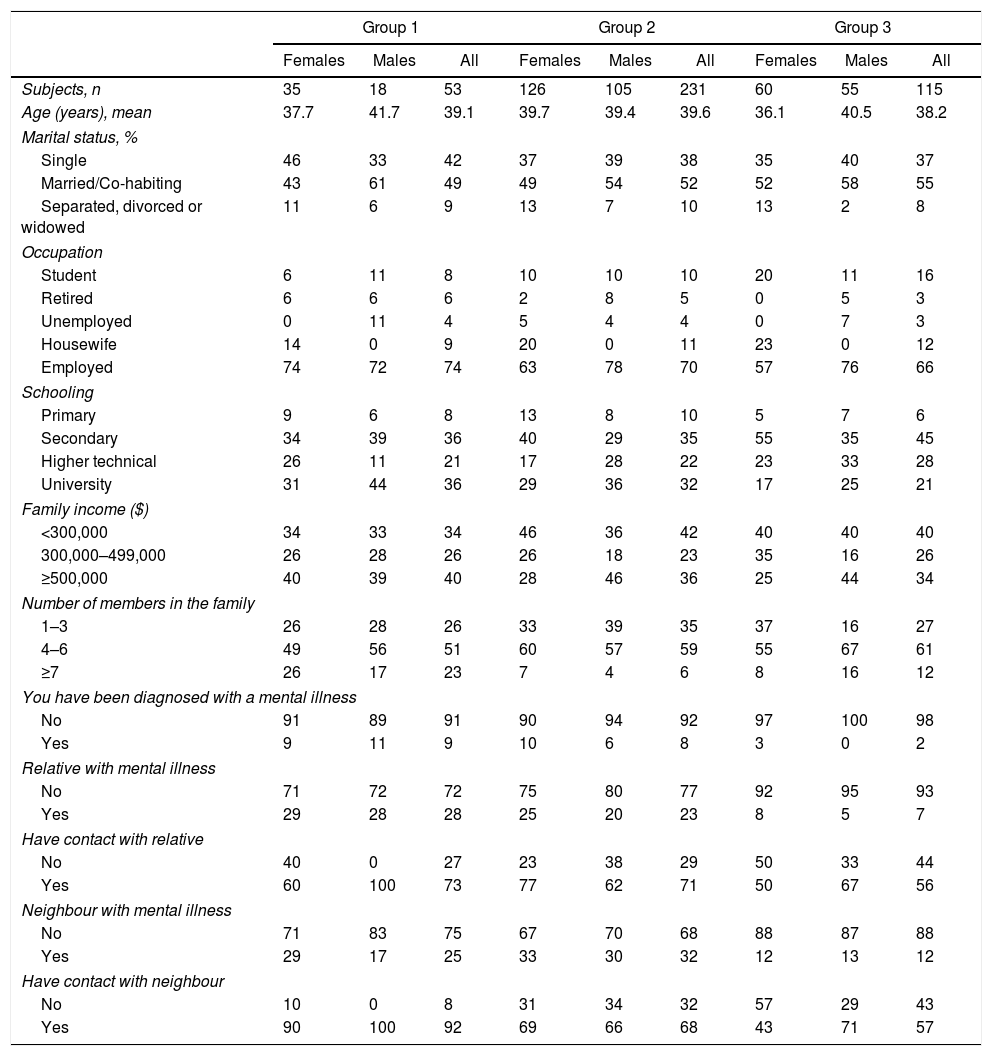
The hierarchical cluster analysis identified three groups (Fig. 1).

The first group (n=53) corresponded to those with a favourable attitude towards schizophrenia and a stronger belief in knowledge, and was composed mainly of women (66%) and people who were working (74%); 49% lived as a couple. Worth noting is that 36% had a university education and 40% were in the highest income bracket. This group had experience from close contact with mental illness, either because of their own diagnosis (9%) or that of relatives (28%) or neighbours (25%). Consistent with the above, this was the group that had the greatest amount of contact with neighbours who suffered from SMI (92%).
The second group had a negative attitude towards schizophrenia and little belief in knowledge (n=231). This group had a similar number of males to females, although the ratio was slightly biased towards females (54.5%). Like the first group, the majority lived as a couple (52%) and were working (70%); 32% had a university education and 42% came under the lowest income bracket. Lastly, they had less experience with people with SMI than the first group, with 8% reporting a personal diagnosis and 23% in family members. This group had the highest percentage of neighbours with SMI, but had the least amount of contact with them (68%).
The third group (n=115) had a negative attitude towards schizophrenia and a stronger belief in knowledge. In this group, there were similar numbers of males and females (52.2%) and the majority lived as a couple (55%) and were working (66%), although the percentage in employment was lower than in the other two groups. There was a high proportion of people with only secondary education (45%) and the lowest proportion of the three groups with university education (21%). They had less contact with people with SMI, either because few of them had been diagnosed with a psychiatric illness themselves (2%) or had family members (7%) or neighbours (12%) who had (Table 5).
Distribution of socio-demographic variables in the 3 groups, by gender.
| Group 1 | Group 2 | Group 3 | |||||||
|---|---|---|---|---|---|---|---|---|---|
| Females | Males | All | Females | Males | All | Females | Males | All | |
| Subjects, n | 35 | 18 | 53 | 126 | 105 | 231 | 60 | 55 | 115 |
| Age (years), mean | 37.7 | 41.7 | 39.1 | 39.7 | 39.4 | 39.6 | 36.1 | 40.5 | 38.2 |
| Marital status, % | |||||||||
| Single | 46 | 33 | 42 | 37 | 39 | 38 | 35 | 40 | 37 |
| Married/Co-habiting | 43 | 61 | 49 | 49 | 54 | 52 | 52 | 58 | 55 |
| Separated, divorced or widowed | 11 | 6 | 9 | 13 | 7 | 10 | 13 | 2 | 8 |
| Occupation | |||||||||
| Student | 6 | 11 | 8 | 10 | 10 | 10 | 20 | 11 | 16 |
| Retired | 6 | 6 | 6 | 2 | 8 | 5 | 0 | 5 | 3 |
| Unemployed | 0 | 11 | 4 | 5 | 4 | 4 | 0 | 7 | 3 |
| Housewife | 14 | 0 | 9 | 20 | 0 | 11 | 23 | 0 | 12 |
| Employed | 74 | 72 | 74 | 63 | 78 | 70 | 57 | 76 | 66 |
| Schooling | |||||||||
| Primary | 9 | 6 | 8 | 13 | 8 | 10 | 5 | 7 | 6 |
| Secondary | 34 | 39 | 36 | 40 | 29 | 35 | 55 | 35 | 45 |
| Higher technical | 26 | 11 | 21 | 17 | 28 | 22 | 23 | 33 | 28 |
| University | 31 | 44 | 36 | 29 | 36 | 32 | 17 | 25 | 21 |
| Family income ($) | |||||||||
| <300,000 | 34 | 33 | 34 | 46 | 36 | 42 | 40 | 40 | 40 |
| 300,000–499,000 | 26 | 28 | 26 | 26 | 18 | 23 | 35 | 16 | 26 |
| ≥500,000 | 40 | 39 | 40 | 28 | 46 | 36 | 25 | 44 | 34 |
| Number of members in the family | |||||||||
| 1–3 | 26 | 28 | 26 | 33 | 39 | 35 | 37 | 16 | 27 |
| 4–6 | 49 | 56 | 51 | 60 | 57 | 59 | 55 | 67 | 61 |
| ≥7 | 26 | 17 | 23 | 7 | 4 | 6 | 8 | 16 | 12 |
| You have been diagnosed with a mental illness | |||||||||
| No | 91 | 89 | 91 | 90 | 94 | 92 | 97 | 100 | 98 |
| Yes | 9 | 11 | 9 | 10 | 6 | 8 | 3 | 0 | 2 |
| Relative with mental illness | |||||||||
| No | 71 | 72 | 72 | 75 | 80 | 77 | 92 | 95 | 93 |
| Yes | 29 | 28 | 28 | 25 | 20 | 23 | 8 | 5 | 7 |
| Have contact with relative | |||||||||
| No | 40 | 0 | 27 | 23 | 38 | 29 | 50 | 33 | 44 |
| Yes | 60 | 100 | 73 | 77 | 62 | 71 | 50 | 67 | 56 |
| Neighbour with mental illness | |||||||||
| No | 71 | 83 | 75 | 67 | 70 | 68 | 88 | 87 | 88 |
| Yes | 29 | 17 | 25 | 33 | 30 | 32 | 12 | 13 | 12 |
| Have contact with neighbour | |||||||||
| No | 10 | 0 | 8 | 31 | 34 | 32 | 57 | 29 | 43 |
| Yes | 90 | 100 | 92 | 69 | 66 | 68 | 43 | 71 | 57 |
The values are expressed as percentages unless otherwise indicated.
The aim of this study was to assess public stigma by measuring knowledge and relating the level of information with variables which, in other cultural contexts, have been shown to influence the stigma the population attaches to people with schizophrenia.1,2,19
In terms of level of information, 56.2% of people had at least six correct answers out of a maximum of 11 questions. That percentage was lower than those obtained in studies conducted in North America and Europe,1,2,10,19,20 but similar to the aforementioned result in Argentina reported by Leiderman et al.,13 possibly because of the similarity between the two instruments, the method of application (self-applied), and the similar social contexts, as Chile and Argentina are neighbouring countries that share language and customs. The low level of information the population has about schizophrenia may also be associated with the fact that community-orientated intervention models are less well developed.21
Analysing the results by items, 58.6% of the interviewees still thought that people with schizophrenia have a split personality. This result is in line with previous studies in which it has been observed that this condition is associated with schizophrenia,1,2,13,19,22 which feeds myths and prejudices about this disorder.
The study also confirmed the association made by the general population between schizophrenia and danger. Although some studies report that there is no significant difference between people with and without schizophrenia in terms of being violent, and it has even been found that subjects with SMI are more likely to be victims of violence than the general population,23 the public still considers them to be a threat.20 Negative descriptions or generalisations made by the media about violent events contribute to the construction of beliefs, prejudices and, ultimately, public stigma.24–26
As found in other studies,1,2,19 a high percentage of people (43.1%) thought that genetics were the sole cause of schizophrenia, which shows that the psychosocial aspects associated with the onset of the disorder are still unknown to a significant part of the population. However, in contrast to the above, 79% of respondents believed the best treatment to be a combination of medication and psychotherapy and 41.6% stated that the majority of people with schizophrenia could be cured. Those findings show the contradictory nature of the information people have and reflect conflicting knowledge that can contribute to maintaining ambivalent attitudes towards people with schizophrenia. This more positive view could be related to the fact that for some decades now in Chile, a community mental health model has been used to address SMI.27,28
As far as the structure of the scale is concerned, it is interesting that an instrument that evaluates information has two dimensions, neither of which is based on its degree of veracity. The first dimension refers to the beliefs people have about their knowledge on the subject. These beliefs are related to direct contact with people suffering from an SMI, which could mean that direct experience influences people's ideas about their level of information. In the study conducted by Leiderman et al.13 in Argentina, contact was associated with the level of true information. Therefore, it is plausible to conclude that this variable is associated both with real knowledge and with the knowledge beliefs that people have about schizophrenia. This is an interesting idea, because it suggests that for some people, contact may affect the level of information, while in others, it only affects the belief at that level. That then leads to the question of whether actual experience with people with SMI can reinforce existing stereotypes, as people adapt new information to their beliefs through bias.29 However, we need to identify what factors contribute to this process.
Another unusual aspect is for a knowledge scale to have a dimension that reflects attitudes. As various authors have pointed out, assessing the level of information about SMI is an indirect way of measuring attitudes. This idea supports the use of information questionnaires as attitudinal measures, with the advantage of having less social desirability bias.18
Contact with neighbours with SMI is associated with a more positive attitude, which reaffirms the importance of contact, but shows that the type of relationship established is central. When the interaction is less intimate, the attitude is more favourable, probably because the contact is less charged with negative emotions. Studies have found that relatives of people with schizophrenia have a more negative attitude towards the disease than other social groups, a result that contrasts with the traditional contact hypothesis.30
Families with more members, however, have a more positive attitude towards schizophrenia. We were unable to find any studies that directly relate this variable to attitudes, but, in view of this finding, we need to establish more precisely how many people in the family group make the difference and what characteristics these family groups possess. Lastly, our study corroborates the fact that people with a higher level of education have a more favourable attitude towards SMI.31–33
In the cluster analysis, the group with the strongest belief in knowledge and a more positive attitude was composed mainly of women, had a higher level of education and income and had direct contact with people with SMI. This is in line with the findings of other studies, in which women had a more positive attitude towards SMI, and may be explained by the fact that women are more concerned with issues and aspects related to healthcare.1,19
The second group identified in the cluster analysis had little belief in knowledge about schizophrenia and a negative attitude. This group, like the first, had contact with people with SMI. However, when comparing them, we found that, while interaction with relatives was similar (73% versus 71%), the group with favourable attitudes had more contact with neighbours (92% versus 68%). This reaffirms what we stated earlier, that it is not the contact itself that makes the difference, it is the type of contact that could be affecting attitudes towards people with schizophrenia. Future research should investigate what the differences are between contact with relatives and contact with neighbours that facilitate the acquisition of positive attitudes towards people with SMI.
Last of all, the third group had a strong belief in knowledge and a negative attitude towards SMI. In this case, the ideas people have about the information they have lead them to justify or “rationalise” their position on the subject34; the belief in knowledge, even if wrong, gives basis to the negative attitude, to the extent that an explanation about SMI is given. People therefore reacted to the items according to their general attitude and selected the information consistent with that attitude.35 In social psychology, maintaining consistency and avoiding disparate information in such a way is termed congeniality bias.36,37 This group was the one that presented the biggest challenge in the intervention because, as they thought they knew about the subject, they were less willing to receive or seek alternative information that questioned their attitudes.
One of the limitations of the study was the non-probability sampling, which means we have to be careful about generalising the results. Furthermore, the scale used did not reflect the knowledge well, and further research therefore needs to be carried out on the structure of the scale. Lastly, further research is also necessary to take a closer and more in-depth look at how stigma develops towards people with schizophrenia among the population in Chile. In view of the relevance of psychosocial aspects in these people's recovery, that information is important for the future development of interventions and care. Moreover, there has been little research in this area in Chile. Therefore, this type of study will increase knowledge on the subject, not only in Chile but also in Latin America, and allow us to measure the true scope of the stigma towards SMI.
ConclusionsThe population has a poor level of information and stereotypical beliefs about schizophrenia. The questionnaire on knowledge about schizophrenia had two dimensions: “beliefs on the knowledge of schizophrenia” and “attitudes towards schizophrenia”. It is important, on the one hand, that neither dimension measured true knowledge and, on the other, that a knowledge scale can evaluate attitudes, supporting the use of information questionnaires as attitudinal measures. The results of this study reinforce the importance of contact, but raise questions about the traditional hypothesis as, more than contact itself, it is the type of contact that becomes a significant variable in the level of stigma. Further research is required on the characteristics of the tool and the aspects of the contact associated to a lower level of stigma in the population.
Ethical disclosuresProtection of human and animal subjectsThe authors declare that the procedures followed were in accordance with the regulations of the relevant clinical research ethics committee and with those of the Code of Ethics of the World Medical Association (Declaration of Helsinki).
Confidentiality of dataThe authors declare that no patient data appear in this article.
Right to privacy and informed consentThe authors declare that no patient data appear in this article.
Conflicts of interestThe authors have no conflicts of interest to declare.
Please cite this article as: Grandón P, Aguilera AV, Bustos C, Alzate EC, Saldivia S. Evaluación del estigma hacia personas con diagnóstico de esquizofrenia mediante una escala de conocimiento. Rev Colomb Psiquiat. 2018;47:72–81.
