


To design a diagnostic support system for sleep apnoea and hypopnoea syndrome (SAHS) using moving average based on knowledge, able to identify SAHS episodes from a respiratory polygraphy (RP) database.
MethodsAn analysis was made of data obtained from a public database, that included the RP signals, nasobucal airflow, thoracoabdominal movement, and pulse oximetry of 23 patients between 28 and 68 years with suspected SAHS, and with a body mass index (BMI) from 25.1 to 42.5.
ResultsThe identification and classification of episodes of apnoea and hypopnoea was obtained.
ConclusionsThe algorithm designed identified episodes of SAHS using polygraphy signals, which by implementating in a graphical interface allows visualisation of onset, duration, type, oxygen saturation, and pulse oximetry of each episode, and can be used as a support tool for the diagnosis of sleep disorders.
Diseñar un sistema de apoyo diagnóstico para el síndrome de apneas-hipopneas del sueño (SAHS) utilizando conocimientos basados en media móvil, capaz de identificar episodios de SAHS a partir de una base de datos de poligrafía respiratoria (PR).
MétodosSe analizaron las señales de poligrafía respiratoria (flujo aéreo nasobucal, movimiento toracoabdominal y pulsioximetría) de 23 pacientes con sospecha de SAHS (edad, 28-68 años; índice de masa corporal, 25,1-42,5), obtenidas de una base de datos pública.
ResultadosSe identificaron y se clasificaron episodios de apnea y hipopnea.
ConclusionesSe detectaron los episodios de SAHS utilizando señales de poligrafía respiratoria cuya implementación en una interfaz gráfica permite la visualización del inicio, la duración, el tipo, la saturación de oxígeno y la pulsioximetría de cada episodio, y se puede emplear como herramienta de apoyo al diagnóstico del trastorno del sueño.
Sleep is considered to be one of the necessary phases for the proper functioning of the body, which not only helps to repair the body at the end of the day, but is also associated with the regulation of neuronal processes and other systems, hence why sleep medicine is becoming increasingly important. Sleep disorders in a population are linked to decreased productivity, road traffic accidents,1 mental health problems and other types of illnesses, such as arterial hypertension, cerebrovascular disease, coronary disease and neurocognitive disease.2
Research studies carried out by the American Academy of Sleep Medicine (AASM) indicate that approximately 35% of the US population suffers or has suffered from some form of sleep disorder in their lifetime.3 The most common nocturnal disorder is sleep apnoea-hypopnoea syndrome (SAHS).4 Apnoea is the cessation of the oronasal airflow for more than 10 seconds and, in hypopnoea, airflow is reduced by more than 50% of the baseline value, leading to an oxyhaemoglobin desaturation of 2–4%. Each episode of apnoea lasts for 20–30s, although they can last for 2–3min.5,6
Some studies indicate that SAHS affects 2% of women and 4% of men7; however, on considering patients between the ages of 30–60 years at random, up to 9% of women and 24% of men have been found to be affected.8
At present, the most commonly used method for diagnosing SAHS is polysomnography (PSG),6,9 which includes an electroencephalogram, electrocardiogram and submental electromyogram and measures of respiratory changes such as position changes, snoring, thoracoabdominal movement, pulse oximetry, oxygen saturation, oronasal airflow and electrocardiogram. However, this method is costly and very time-consuming, and the detailed analysis that must be performed by the specialist is complex.10 Various studies have shown that equipment that exclusively records respiratory variables can be used,11–16 thus reducing costs and waiting times, and facilitating the diagnosis of SAHS at sleep centres.14
The objective of this study is to design a diagnostic support system for SAHS using a moving average-based approach that is able to identify episodes from a respiratory polygraphy (RP) database.
MethodsThe data were extracted from the Physionet database, which contains overnight polysomnograms (mean, 7h) of 25 patients with suspected breathing-related sleep disorders.
The subjects from whom the data were obtained were randomly selected over a period of six months from among the patients of the St Vincent's University Hospital Sleep Disorders Clinic, in Dublin, and were aged between 28 and 68 years, with a body mass index (BMI) of 25.1–42.5 and an apnoea–hypopnoea index (AHI) of 1.7–90.9.
Moreover, the patients were deemed not to suffer from heart disease or autonomic dysfunction, and were not on medication capable of interfering with their heart rate.17 According to the Epworth sleepiness scale,17 76% of the individuals presented mild to severe sleepiness.
RP recordings were obtained in the standard European data format (EDF) used for polysomnography (PSG) recordings, which identified each individual and specified the technical characteristics of the recording. The recordings were characterised, annotated by the specialist and in an open code – conditions that allowed them to be used for this project.
For the signal analysis, two recordings did not meet the inclusion criteria set for this study, and so the recordings of 23 subjects were used (19 men and 4 women). To analyse the signals, three main phases were proposed: signal preprocessing, processing and apnoea episode detection.
Fig. 1 shows a diagram of the general proposal for detecting episodes of SAHS, specifying the procedures considered for each stage.
Preprocessing
The American Academy of Sleep Medicine (AASM) classifies RP into four types. Type 1 is conventional PSG, monitored by a sleep laboratory technician (with at least 7 channels); type 2 is PSG performed with a portable device and is not monitored by a technician; type 3 corresponds to what we call RP, where breathing, thoracoabdominal effort and pulse oximetry are recorded (with a total of 4–7 channels); and type 4 corresponds to super-simplified studies with 1- or 2-channel devices (oximetry and/or breathing).18 For this study, airflow (oronasal airflow), respiratory effort (thoracoabdominal movement) and oxygen saturation (pulse oximetry) data were considered, which are recordings obtained by PSG that correspond to type 3 RP.
To view the RP recordings, non-commercial Polyman software was used, which is compatible with the EDF and facilitates PSG signal viewing.19 Segments were found that were eliminated based on the following conditions for each signal: Oronasal airflow, amplitude between –20 and 20l/min, with a dominant frequency of 0.2Hz, reported for the breathing of one relaxed (sleeping) subject20; thoracoabdominal movement, the values of these signals are between 5 and –5; pulse oximetry, normal values of this signal are between 40 and 80p/min; oxygen saturation, normal values are between 90% and 100%.
To eliminate high frequency noise and prevent information loss, a moving average filter was used, which is included in MATLAB® v. 7.1 2011 (MATrix LABoratory), an interactive system designed for matrix calculations that is primarily used in scientific and engineering analyses. The moving average filter is used to smooth the data for trend analysis, as described in Eq. (1):
where M is the number of windows to which the filter is applied, h(k) describes the filter applied and x[n−k] are the respiratory polygraphy signals.RP signal processing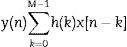
In order to process signals, the moving average was used by setting a 10s window (80 points) that represents the minimum duration of an SAHS episode.
The moving average is an average of the values in an irregular series that moves from one extreme to the other, replacing these values with the average result in order to detect its trend.21 This average was obtained from the root mean square value (RMS) in each segment, as this provides information on the amplitude of the signal and facilitates the determination of the frequency variables, distance between peaks and form of each signal, which are important for detecting episodes of SAHS.
The RMS or root mean square value for a set of N values {x1, x2,…, xN} of a discrete x variable is determined by Eq. (2):
where N is the number of window elements and each of the elements.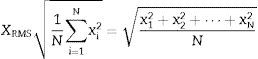
The RMS value is proportional to the signal energy and is defined by Eq. (3):
where T is the temporal integration period and a is the immediate signal amplitude.22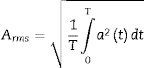
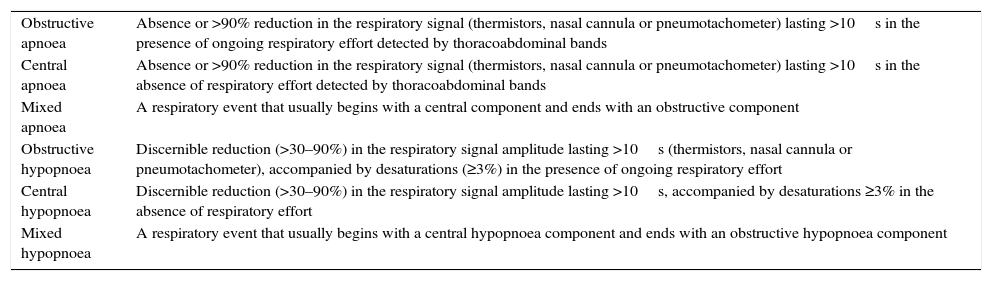
A threshold was subsequently set in accordance with the criteria established by the consensus on SAHS episodes (Table 1) and a binary vector was generated where zero corresponds to the threshold value and 1 to the SAHS episode.
Classification of sleep apnoea–hypopnoea syndrome episodes.
| Obstructive apnoea | Absence or >90% reduction in the respiratory signal (thermistors, nasal cannula or pneumotachometer) lasting >10s in the presence of ongoing respiratory effort detected by thoracoabdominal bands |
| Central apnoea | Absence or >90% reduction in the respiratory signal (thermistors, nasal cannula or pneumotachometer) lasting >10s in the absence of respiratory effort detected by thoracoabdominal bands |
| Mixed apnoea | A respiratory event that usually begins with a central component and ends with an obstructive component |
| Obstructive hypopnoea | Discernible reduction (>30–90%) in the respiratory signal amplitude lasting >10s (thermistors, nasal cannula or pneumotachometer), accompanied by desaturations (≥3%) in the presence of ongoing respiratory effort |
| Central hypopnoea | Discernible reduction (>30–90%) in the respiratory signal amplitude lasting >10s, accompanied by desaturations ≥3% in the absence of respiratory effort |
| Mixed hypopnoea | A respiratory event that usually begins with a central hypopnoea component and ends with an obstructive hypopnoea component |
Source: Pita and Pértegas.24
The start and end time was then determined, generating another vector with the start (1) and end (−1) times, taking into account the distance between peaks23 (Table 1).
SAHS detectionFor the classification of the SAHS episodes, a comparison of abdominal and thoracic movements was performed, and the points at which these abdominal and thoracic movements incurred the same reductions were considered.
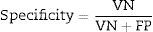
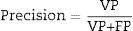
To assess the performance of the classification, sensitivity, specificity, precision (positive predictive values [PPV] and negative predictive values [NPV]24) were assessed with a view to checking the validity and safety of the algorithm. See Eqs. (4)–(7):
where VP is true positives; VN is true negatives; FP is false positives; and FN is false negatives.Graphical interface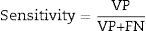
The graphical user interface was performed using the MATLAB® GUIDE programming environment (v. 7.1 2011). This environment facilitated the creation and implementation of simulation programmes with a user-friendly interface.
ResultsSignal preprocessingA polysomnographic study takes 8h and analyses 230,400 samples. Segments corresponding to artefacts at the start and end of the recording were deleted (as presented in Fig. 2). The signal is then filtered for the purpose of smoothing it and to eliminate noise without losing information.
SAHS episode detection.")
With the RMS value, determined after applying the moving average to oronasal airflow, thoracoabdominal movement and pulse oximetry signals, values proportional to the amplitude variation were detected. Fig. 3 shows a vector of RMS values.
 Visualisation of RMS values in the respiratory flow signal; RMS values in red. (B) Enlargement.")
The decrease in the RMS value of the oronasal airflow, thoracoabdominal movement and pulse oximetry signals facilitates the detection of SAHS episodes.
For the classification of apnoea, thoracoabdominal efforts <10% were considered, while hypopnoeas were defined as a vector of thoracoabdominal effort <70% and >10% (Fig. 4).
 (green), behaviour of flow signals and thoracoabdominal effort (red) and increase in cardiac pulse (yellow).")
Barreiro et al.25 detected episodes of SAHS and compared the manual and automatic analysis of neurological and respiratory signals. With the automatic analysis, they reported sensitivity of 55%, PPV of 100% and NPV of 47%. Karandikary et al. also studied SAHS, but they do not address the problem of classifying the type of episode.
In this study, the evaluation was performed using four recordings in training, with the remaining samples used for the validation (19 recordings). The oronasal airflow, thoracoabdominal movement and pulse oximetry data enabled each and every SAHS episode reported in the specialist's notes to be detected, including episodes that fit the medical criteria established in the Spanish national consensus on apnoea and hypopnoea26 and which were not noted. In the classification of these episodes, sensitivity values of 62.33–96.17% were obtained, along with specificity of 38.19–88.69%, precision of 7.06–68.27% and NPV of 49.71–97.47%.
The user-friendly graphical interface implemented in this study enabled the selection of an RP recording, as well as the detection, analysis and classification of SAHS episodes. It may also be employed to train students, viewing signals in order to better understand the behaviour of SAHS episodes, and the interface thus becomes a tool that may be used to teach specialists undergoing training to improve their skills in detecting such episodes.
As reported by Álvarez et al., PSG studies are valued at approximately 179 euros (645,000 Colombian pesos), while the respiratory polygraph costs just 65 euros (234,000 Colombian pesos)27; in some cases, these costs do not include the patient's hospital stay, the salary of the technicians working at the hospital's sleep disorders unit nor the proportionate expenses of the fixed costs, which include facility depreciation costs, general maintenance costs and the costs of other devices within the sleep disorders unit, video cameras, monitors, etc., which are born directly by the patients and/or relatives. As such, the respiratory polygraph used in this study may reduce the costs and resources required in cases where access to costly methods such as the PSG is not possible or when travelling to centres with this equipment is not an option. Moreover, processing the signals with the implemented strategy takes around 30s per patient, thereby reducing waiting times once the data have been acquired.
The strategy employed in this study would be more suitable for screening in the identification and classification of SAHS episodes in patients with suspicious symptoms, taking into account its low cost and the reduction in time for acquiring and assessing the data that may support the diagnosis; it also enables the duration of each episode and oxygen saturation to be established, which may provide the specialist with more information, and it can be performed in the patient's own home, generating a more comfortable environment with timely detection. In order to implement this strategy, an RP device, computer, software with the implemented algorithm and a trained general practitioner are required.
ConclusionsIn this study, episodes of apnoea/hypopnoea were detected and automatically classified as mixed, central or obstructive as diagnostic support, using the moving average with respect to the RMS value and identifying the onset and duration of SAHS. A graphical interface was also designed which may be used for training purposes and to view SAHS signals. Future studies investigating the learning strategies of the machine that could aid classification should be conducted.
Ethical disclosuresProtection of human and animal subjectsThe authors declare that no experiments were performed on humans or animals for this study.
Confidentiality of dataThe authors declare that no patient data appear in this article.
Right to privacy and informed consentThe authors declare that no patient data appear in this article.
Conflicts of interestThe authors declare that they have no conflicts of interest.
To Dr Diana María Tafur Guzmán, general practitioner at the Military University, for her contributions in assessing the software developed.
Please cite this article as: Guzmán Sierra DL, Carreño León M, Camargo Casallas LH. Identificación automática de episodios de SAHS utilizando señales de poligrafía respiratoria. Rev Colomb Psiquiat. 2017;46:88–94.
