


Psychosocial factors have been shown to be potentiators and triggers of cardiovascular diseases such as hypertension. The purpose of the study is to explore the relationship between psychosocial factors and the presence of hypertension in a random population sample in the city of Medellin.
MethodsObservational cross-sectional study with an analytical approach. The endpoint (hypertension) was contrasted with the psychosocial and sociodemographic endpoints by means of a bivariate analysis, and later a multivariate logistic regression analysis was carried out.
ResultsAfter adjusting for age, gender and stressful life events, depression (OR=1.65; 95% CI: 1.13–2.41) and sleep disorders (OR=1.41; 95% CI: 1.00–1.98) were found to be psychosocial factors associated with hypertension.
ConclusionsDepression and sleep disorders are related to hypertension. In Colombia there are studies that correlate psychosocial factors such as depression with hypertension; however, the impact of sleep disorders on the population is unknown.
Los factores psicosociales se han mostrado como potenciadores y desencadenantes de enfermedades cardiovasculares como la hipertensión arterial. El propósito del estudio es explorar la relación de los factores psicosociales con la presencia de hipertensión arterial en una muestra aleatoria poblacional en la ciudad de Medellín.
MétodosEstudio de tipo observacional de corte transversal con enfoque analítico. La variable respuesta (hipertensión arterial) se contrastó con las psicosociales y sociodemográficas mediante análisis bivariable, y posteriormente se realizó un análisis de regresión logística multivariable.
ResultadosTras ajustar por edad, sexo y eventos de vida estresantes, los factores psicosociales asociados con hipertensión arterial son la depresión (OR=1.65; IC 95%, 1.13-2.41) y los trastornos del sueño (OR=1.41; IC 95%, 1.00-1.98).
ConclusionesLa depresión y los trastornos del sueño se relacionan con la hipertensión arterial. En Colombia hay estudios que relacionan factores psicosociales como la depresión con la hipertensión, pero se desconoce el impacto de los trastornos de sueño en la población.
Hypertension is considered to be one of the risk factors with the greatest impact on cardiovascular disease.1 It affects 40% of the adult population aged 25 or over, translating into more than one thousand million people worldwide.2 One systematic analysis reports an increase in the number of people with uncontrolled hypertension.3 With 9.4 million deaths a year and 7% of life years lost due to disability, hypertension is the leading cause of death and disability,2,4 meaning that it has a huge impact on the worldwide burden of cardiovascular disease.2
In Colombia, the National Health Observatory reported a prevalence of hypertension of 7.29% in the general population (2011), with a predominance among women.5 Recent reports show that the behaviour of hypertension varies greatly in different parts of the country, since while a prevalence of 9% has been reported in cities such as Cartagena,6 in cities such as Cali, and in central regions, such as the coffee zone (Departments of Caldas, Risaralda and Quindío), the figures are higher, 16.1% and 26.2%, respectively.7,8
The studies performed conform the multi-causality of hypertension, and while clear associations have been found between some classic factors, such as obesity, dyslipidaemia, metabolic syndrome and diabetes, the incidence continues to rise.9 Genetic, environmental and psychosocial factors play a very important part in the development of hypertension; among the psychosocial factors, depression and stress have already been studied in other populations,10 and their association with hypertension has been clearly established.11,12 However, there are no conclusive data in Colombia.
One approach in Colombia in 2008 was the “Estudio del Corazón” [Heart Study],13 which investigated the behaviour of psychosocial factors and highlighted the high general impact of these and classic cardiovascular disease factors. Since then, other authors have drawn attention to the importance of psychosocial factors as triggers and enhancers14,15 of the development of hypertension.
The objective of this study is to identify a possible association between psychosocial factors and hypertension and its extent in the city of Medellín.
MethodsStudy designThis was a cross-sectional study with an analytical approach. The detailed description of the reference population is provided by the records taken between 2007 and 2008 in the “Estudio del Corazón” [Heart Study] as already published on adults residing in Medellín (Colombia).13 The final sample was comprised of residents aged 27 years or older from the city of Medellín and its surrounding towns and villages. The sample size for the descriptive population study was calculated with the Wayne W. Daniel formula for the estimation of population proportion, using a confidence interval of 95%, an accuracy of 5% and an estimated prevalence of the risk factors taking a hypertension proportion of 18.2%. The design effect correction factor of 3.5 was used to guarantee a sufficient sample size for the analysis. The sample size was 800 individuals, who were considered the unit of analysis for this study (606 from the main city and 194 from the small towns and villages).
Blood pressureThe participant population was informed through a letter to the community detailing the inclusion criteria to be met at their medical appointment; after the informed consent had been obtained, all the measurements were taken in the morning and on an empty stomach. Blood pressure was taken with the standard clinical procedure using an analogue blood pressure monitor and the subjects were questioned about their use of medication to control their blood pressure.
Psychosocial factorsThe psychosocial factors (depression according to the DSM-IV criteria, life events, work stress, home stress, and financial stress and locus of control) from the international INTERHEART study were described, information collected through a structured interview and instruments adapted and validated for Colombia. Rosengren et al.16 published the details of the structure and classification of these variables. Some other psychosocial factors, such as sleep disorders, waking up feeling rested, panic attacks, etc., were also investigated through a structured interview. Psychological stress was assessed with two single-item questions related to stress at work and at home. Stress was defined as feeling irritable, full of anxiety or having difficulty sleeping as a result of conditions at work or at home. For each question, the participants were asked to report how often they had felt stressed, using a Likert scale with the classification criteria: never; some periods; several periods, or permanent stress.
The instruments used for the evaluation of psychosocial factors such as depression, perception of stress and life events were applied independently, as detailed below: for perceived depression, the participants were asked if in the course of the previous year they had felt sad, down or depressed for two or more consecutive weeks; depression was only assessed when perceived depression was detected according to DSM-IV criteria (loss of interest in many things, such as hobbies or work activities that used to give them pleasure; feeling tired or low in energy; gaining or losing weight; having trouble getting to sleep; having more trouble than concentrating usual; thinking about death a lot, either their own, someone else's or death in general, and feeling bad about themselves, not feeling well or feeling really unwell). Having at least five positive responses was sufficient to determine depression.
The questionnaire asked about stressful life events, such as marital separation or divorce, job loss or retirement, significant financial loss, physical violence, psychological violence, major family conflict, major illness or personal injury, death or major illness of a close family member, spouse death or other major problem.
Each participant had a record of the stress experienced in the last year at home and at work, classified as some periods, several or permanent. There was also information related to financial stress perceived in the last year, classified as little/none, moderate or major/severe.
The locus of control module, with a six-item scale, was classified as follows: at work, they feel in control of what happens most of the time; they feel that what happens in their life is almost always determined by factors beyond their control; they hope to have more positive than negative experiences in the next 5–10 years; they have the constant feeling of being treated unfairly; in the last 10 years their life has been full of changes, without them knowing what was going to become of them; they gave up trying to make major improvements in their life a long time ago. For each of these items, the response options were: strongly disagree, disagree, neutral, agree, strongly agree. The records with “strongly disagree” or “disagree” responses were considered as a lack oflocus of control. Those with “neutral”, “agree” or “strongly agree” were classified as having locus of control.
The application of the instruments, as well as the standard determinations of physical status and the description of the population, such as age, gender, socioeconomic stratum and clinical variables, was carried out by a standard team with suitable training in the information gathering process backed up by the necessary medical support teams to guarantee the other activities related to the study.
Statistical analysisAll the records in the data bank were analysed; those with systolic blood pressure (SBP) >140mmHg and diastolic blood pressure (DBP) >90mmHg, taken supine and after standing for 1min, and participants with any SBP and DBP but with a previous diagnosis of hypertension and on antihypertensive treatment, were compared to the other existing records in the data bank. For this purpose, the baseline quantitative variables are described with mean±standard deviation and those identified as qualitative according to the frequency of appearance of each one. The bivariate analysis between hypertensive and non-hypertensive patients was carried out with the psychosocial factors independently using Pearson's χ2 tests and the odds ratio (OR) with their respective 95% confidence intervals (95% CI). The multivariate logistic regression models were adjusted, taking as independent variables those whose p value in the bivariate analysis was ≤0.25 and which showed some degree of association. Subsequently, the introduce algorithm was applied to estimate the final models. They were considered significant if p≤0.05. The SPSS software version 24.0 and R version 3.3.1 were used.
Ethical considerationsDue to the characteristics of the study, this research was considered to be free of any risk. The study was conducted in accordance with the criteria for research in humans provided for in Resolution 8430 of 1993 of the Ministry of Health. The Universidad CES Research Operations Committee evaluated and approved the conduct of the study.
ResultsDescription of the study populationTable 1 shows the distribution of sociodemographic characteristics by age, gender, education and socio-economic status. The average age of the study participants was 50.3±12.1 (range 27–87 years); 46–60 year-olds and under-45s were the most represented age groups amongst patients and healthy subjects, respectively (54.5% and 52.3%). Significant differences were found in age distribution.
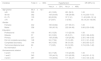
Distribution of sociodemographic characteristics. Medellín, 2007–2008.
| Variables | Total (n=800) | Hypertension | OR (95% CI) | |
|---|---|---|---|---|
| Yes (n=301) | No (n=499) | |||
| Age (years) | 50.3±12.1 | |||
| ≥45 | 303 | 42 (13.95) | 261 (52.3) | 1.00 |
| 46–60 | 362 | 164 (54.49) | 198 (39.68) | 5.14 (3.50–7.57) |
| 61–75 | 105 | 68 (22.59) | 37 (7.41) | 11.42 (6.82–19.14) |
| ≥76 | 30 | 27 (8.97) | 3 (0.60) | 55 (16.24–192.59) |
| Gender | ||||
| Females | 442 | 165 (54.82) | 277 (55.51) | 1.00 |
| Males | 358 | 136 (45.18) | 222 (44.49) | 0.66 (0.50–0.88) |
| Education | ||||
| Professional | 150 | 40 (13.29) | 110 (22.04) | 1.00 |
| Illiterate | 57 | 32 (10.63) | 25 (5.01) | 3.52 (1.86–6.65) |
| Primary | 237 | 108 (35.88) | 129 (25.85) | 2.30 (1.48–3.59) |
| Did not complete secondary | 128 | 54 (17.94) | 74 (14.83) | 2.01 (1.21–3.32) |
| Completed secondary | 144 | 48 (15.95) | 96 (19.24) | 1.38 (0.83–2.27) |
| Technician/diploma level | 80 | 17 (5.65) | 63 (12.63) | 0.74 (0.39–1.42) |
| No information | 1 | 1 (0.20) | ||
| Socioeconomic stratum | ||||
| 5 and 6 | 170 | 52 (17.28) | 118 (23.65) | 1.00 |
| 1 and 2 | 343 | 133 (44.19) | 210 (42.08) | 1.44 (0.91–2.13) |
| 3 and 4 | 287 | 116 (38.54) | 171 (34.27) | 1.54 (1.03–2.30) |
95% CI: 95% confidence interval; OR: crude odds ratio.
Unless otherwise indicated, the values express n (%) or mean±standard deviation.
In the hypertensive and non-hypertensive groups, the majority were female, accounting for 54.8% and 55.5% respectively, out of a total of 442 participants. With regard to education, according to the records, the level of education was mainly basic primary (29.6%), followed by professional (18.7%) and unfinished secondary (18.0%). Significant differences were found in the distribution by gender and education (p<0.01).
Of the participants with hypertension, 44.2% were categorised as socioeconomic strata 1 and 2, followed by 3 and 4 (38.5%); there were significant differences between subjects with and without hypertension for the socioeconomic strata 3 and 4 compared to 5 and 6 (OR=1.54; 95% CI 1.03–2.30).
Psychosocial factorsAs shown in Table 2, there were no statistically significant differences between people with hypertension (OR=1.01; 95% CI 0.83–1.22) and people without hypertension (OR=1.00; 95% CI 0.83–1.20) in family and general stress. However, the differences were significant when stressful life events in the last year were analysed (OR=1.24; 95% CI 1.03–1.50).
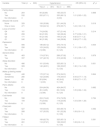
Distribution of the psychosocial factors. Medellín, 2007–2008.
| Variable | Total (n=800) | Hypertension | OR (95% CI) | χ2, p | |
|---|---|---|---|---|---|
| Yes (n=301) | No (n=499) | ||||
| Family stress | |||||
| No | 264 | 99 (32.89) | 165 (33.07) | 1 | 0.898 |
| Yes | 532 | 202 (67.11) | 330 (66.13) | 1.01 (0.83–1.22) | |
| No information | 4 | 4 (0.8) | |||
| Stressful life events | |||||
| None | 329 | 108 (35.88) | 221 (44.29) | 1 | 0.019 |
| One or more | 471 | 193 (64.12) | 278 (55.71) | 1.24 (1.03–1.5) | |
| Locus of control | |||||
| Q4 | 181 | 74 (24.58) | 107 (21.44) | 1 | 0.214 |
| Q3 | 208 | 66 (21.93) | 142 (28.46) | 0.77 (0.59–1.01) | |
| Q2 | 171 | 65 (21.59) | 106 (21.24) | 0.92 (0.71–1.2) | |
| Q1 | 240 | 96 (31.89) | 144 (28.86) | 0.98 (0.77–1.23) | |
| Depression | |||||
| No | 566 | 196 (65.12) | 370 (74.15) | 1 | 0.004 |
| Yes | 226 | 103 (34.22) | 123 (24.65) | 1.31 (1.09–1.57) | |
| No information | 8 | 2 (0.66) | 6 (1.20) | ||
| General stress | |||||
| No | 463 | 174 (57.81) | 289 (57.92) | 1 | 0.976 |
| Yes | 337 | 127 (42.19) | 210 (42.08) | 1.00 (0.83–1.2) | |
| Sleep disorders | |||||
| No | 486 | 161 (53.49) | 325 (65.13) | 1 | 0.001 |
| Yes | 309 | 140 (46.51) | 169 (33.87) | 1.36 (1.14–1.63) | |
| No information | 5 | 5 (1.00) | |||
| Wake up feeling rested | |||||
| Always | 446 | 172 (57.14) | 274 (54.91) | 1 | 0.844 |
| Sometimes | 280 | 102 (33.89) | 178 (35.67) | 0.94 (0.77–1.14) | |
| Never | 68 | 26 (8.64) | 42 (8.42) | 0.99 (0.71–1.37) | |
| No information | 6 | 1 (0.33) | 5 (1.00) | ||
| Panic attacks | |||||
| No | 678 | 254 (84.39) | 424 (84.97) | 1 | 0.682 |
| Yes | 114 | 45 (14.95) | 69 (13.83) | 1.05 (0.82–1.34) | |
| No information | 8 | 2 (0.66) | 6 (1.20) | ||
| Cold hands | |||||
| No | 598 | 224 (74.42) | 374 (74.95) | 1 | 0.764 |
| Yes | 194 | 75 (24.92) | 119 (23.85) | 1.03 (0.84–1.26) | |
| No information | 8 | 2 (0.66) | 6 (1.20) | ||
| Chest pain | |||||
| No | 527 | 194 (64.45) | 333 (66.73) | 1 | 0.392 |
| Yes | 268 | 107 (35.55) | 161 (32.26) | 1.08 (0.9–1.3) | |
| No information | 5 | 5 (1.00) | |||
| Fatigue | |||||
| No | 514 | 189 (62.79) | 325 (65.13) | 1 | 0.391 |
| Yes | 281 | 112 (37.21) | 169 (33.87) | 1.08 (0.9–1.3) | |
| No information | 5 | 5 (1.00) | |||
95% CI: 95% confidence interval; OR: crude odds ratio.
Unless otherwise indicated, the values express n (%) or mean±standard deviation.
No significant differences were found in the locus of control (p=0.214), waking up feeling rested (p=0.844), panic attacks (p=0.682), cold hands (p=0.764), chest pain (p=0.392) and fatigue (p=0.391) variables. However, differences were found in the depression (p=0.004) and sleep disorders (p=0.001) variables.
Association of psychosocial factorsThe logistic regression analyses performed confirmed a possible relationship between depression and sleep disorders and hypertension. These findings were confirmed by logistic regression analysis, adjusting the models for age, gender and stressful life events; depression swung from OR=1.31 (95% CI 1.09–1.57) to OR=1.65 (95% CI 1.13–2.41); and sleep disorders, which had initially presented OR=1.36 (95% CI 1.14–1.63), increased to OR=1.41 (95% CI 1.00–1.98) following the adjusted analyses.
A gender-stratified analysis was carried out with crude models adjusted for age, body mass index (BMI) and diabetes as confounding variables. Statistical significance of the hypertension and depression OR was observed when the adjusted model was analysed in females, but not in males. Sleep disorders presented statistical significance in males and females in the crude and adjusted models. However, when estimations are made about when depression and sleep disorders occur simultaneously, the significance in females is lost if the adjustment is not made (OR=1.5; 95% CI 0.94–2.35) (Fig. 1).
Discussion
The behaviour of the psychosocial variables assessed alongside the classic hypertension-related variables may herald a new way to approach this disease, providing models with a higher proportion of explained variance and a better statistical fit. This study confirms a positive association between depression, sleep disorders and hypertension in Medellín, Colombia.
These findings are similar to previously published data. In a multicentre study in the United States which assessed the risk of hypertension in adults with depressive symptoms, Davidson et al. found OR from 1.15 to 2.83 according to the score obtained on the depression scale17; this relationship had already been demonstrated as biologically plausible due to increased adrenergic activity in depression.18,19
Other authors, such as Hildrum et al. in Norway, and Wiehe et al. in Brazil, have reported findings to the contrary. The study by Hildrum et al. involved repeat measurements in adult participants 11 and 22 years after they entered the study in 198420; their main finding was that depressive symptoms were risk factors for hypotension, not for hypertension. Wiehe et al.21 addressed this relationship in a cross-sectional study which included 1174 adult participants in the city of Porto Alegre (Brazil); they did not find a relationship between depression and hypertension,21 but when the study design is analysed in detail, the results are evidently influenced by the cut-off points established to define hypertension (SBP ≥120mmHg and DBP ≥80mmHg); increasing the cut-off point to allow comparison with our own would reduce the number of patients in proportions that could provide a ratio that would yield significant results. Unlike our study, which used the criteria that define depression, Wiehe et al. also included perceived depression in the final sum for the exposure variable, which would signify an imbalance in the expected proportions of the disease.
Depression has been found more frequently in patients with uncontrolled high blood pressure, and it is suggested that this behaviour could interfere with blood pressure control; these variables were found to be significantly correlated.22 This pattern has a major impact when disease prevalence in the population is observed, indicating an increase in the cases reported as hypertensive. However, in this study, each participant was questioned about their blood pressure status on admission as a strategy for defining the comparison groups.
The findings reported in this study on sleep disorders are consistent with the biological explanation of their effect on hypertension.23–25 To assess the effect of some of these disorders (sleep duration and insomnia) on the development of hypertension, Fernández-Mendoza et al. conducted a study with approximately 17,000 participants in the United States and found a hazard ratio (HR)=2.66 (95% CI 1.45–4.88) and HR=1.29 (95% CI 0.91–1.81) in participants with problems of chronic insomnia and sleep <6h. However, this last finding was not significant.26
A significant increase in the likelihood of hypertension, associated with increased sleep fragmentation (OR=1.03; 95% CI, 1.00–1.05), was recently found in Chicago (United States).27 These data are not substantially different from our own study, in which sleep problems in men and women were associated with hypertension even after the respective adjustments for classic clinical variables related to cardiovascular disease had been made. Of particular interest is the upward and continuous pattern observed in both males and females when depression and sleep problems occurred simultaneously, with a higher OR in males (Fig. 1), which reflects the psychological alterations characteristic of weakened states of health.
The NHANES study, conducted in the United States between 2005 and 2008, evaluated the effect of sleep problems on 10,300 population-based blood pressure readings. In adults with sleep disorders, insufficient sleep and poor sleep, there was a significant association with hypertension (OR=1.84; 95% CI 1.13–2.98).28
These findings also indicate that the standardisation of a combined scale of several measurements in the study of sleep disorders in Medellín could yield a much more realistic idea of the behaviour of hypertension. It is necessary to clarify that the prevalence of hypertension, like the increase in the incidence of chronic diseases, stressful and emotional events and the use of medications, has a considerable impact on sleep quality among adults, particularly elderly adults.29
This study's scope in population terms is substantial, but as it is a secondary source analysis, exclusive analytical designs need to be made to study the psychosocial factors expounded herein and their effect on hypertension behaviour. Moreover, most of the information analysed comes from self-reported data, which generates great imprecision. It is important to bear in mind that certain other classic clinical variables may produce measures of association with a better goodness of fit; for example, cholesterol and/or triglyceride data. However, given the focus of this study, and once the models were checked to ensure they were parsimonious, only indirect predictive variables of these values were taken into account (BMI and diabetes).
This study is the first secondary analysis of the population-based study on cardiovascular risk performed to date in Medellín. It provides valuable information that may be used to develop intervention programmes for the prevention and control of hypertension in this population.
Due to the effect of the different known cardiovascular disease and hypertension risk factors, the prevention and control approach needs to be fully comprehensive and include the established psychosocial risk factors. The findings underscore not only the need to measure psychosocial factors in the assessment of hypertension risk, but also to identify other specific variables which, if controlled, may have a greater impact on the population.
Conflicts of interestThe authors have no conflicts of interest to declare.
The authors would like to thank Dr. Yolanda Torres de Galvis for her valuable help in conducting this research.
Please cite this article as: Flórez-García V, Rojas-Bernal LA, Bareño-Silva J. Depresión y trastornos del sueño relacionados con hipertensión arterial: un estudio transversal en Medellín, Colombia. Rev Colomb Psiquiatr. 2020;49:108–114.
