


Accurate aortic valve annulus sizing has critical importance for the planning of percutaneous transcatheter aortic valve implantation (TAVI) in patients with severe aortic valve stenosis. Although there is a recommendation to perform the measurement during systole, little is known about the importance of the differences between systolic and diastolic dimensions of the annulus.
MethodsConsecutive patients referred for TAVI were evaluated with computed tomography for valve annulus sizing during systole and diastole. Area, circumference, minimum and maximum diameters, and their mean derived diameters were obtained in both phases of the cardiac cycle. Bland-Altman plots were constructed to evaluate the differences between the measures.
ResultsThe analysis included 41 patients with severe aortic stenosis. Mean area, circumference, and diameters were slightly greater in systole. However, in 35% of patients, diastolic dimensions were greater. These differences, although statistically significant, were small (the greatest difference of 0.6mm in mean diameter). Bland-Altman plots showed good agreement between systolic and diastolic measurements on all parameters evaluated.
ConclusionsSmall differences were observed in the systolic and diastolic dimensions of the aortic valve annulus with computed tomography scan, which, although statistically significant, probably do not impact the selection of prosthesis or the procedure outcome.
A medida acurada do tamanho do anel valvar aórtico tem importância fundamental para o planejamento do implante percutâneo de prótese valvar aórtica transcateter (TAVI) em pacientes com estenose valvar aórtica grave. Embora haja recomendação de se realizar a medida na sístole, pouco se sabe sobre a importância das diferenças entre as dimensões sistólica e diastólica do anel.
MétodosPacientes consecutivos referidos para TAVI foram avaliados com tomografia computadorizada para medida do anel valvar na sístole e na diástole. Área, circunferência, diâmetros máximo e mínimo, e seus diâmetros médios derivados foram obtidos em ambas as fases do ciclo cardíaco. Gráficos de Bland-Altman foram construídos para se avaliarem as diferenças entre as medidas.
ResultadosForam incluídos na análise 41 pacientes com estenose aórtica grave. As médias da área, circunferência e diâmetros médios foram discretamente maiores na sístole. No entanto, em 35% dos pacientes, as dimensões diastólicas foram maiores. Essas diferenças, embora estatisticamente significantes, foram pequenas (a maior diferença de 0,6mm no diâmetro médio). Gráficos de Bland-Altman revelaram bons níveis de concordância entre as medidas sistólicas e diastólicas em todos os parâmetros avaliados.
ConclusõesObservamos pequenas diferenças nas dimensões sistólicas e diastólicas no anel valvar aórtico à tomografia computadorizada, as quais, embora estatisticamente significantes, provavelmente não impactam na seleção da prótese e nem no resultado do procedimento.
Computed tomography angiography (CTA) is an important tool for anatomical assessment of patients with aortic valve stenosis who are candidates for percutaneous transcatheter aortic valve implantation (TAVI).1 In many centers, CTA is considered the most important diagnostic method for planning intervention strategies for these patients. CTA has a particularly important role in valve annulus sizing, to guide the choice of the type and size of the prosthesis to be implanted.
Previous studies have demonstrated that aortic root dimensions may vary during the cardiac cycle.2,3 These dimensional differences in systole and diastole are seemingly unpredictable, with systolic dimensions tending to be greater. However, the opposite can also occur.2
In daily clinical practice, CTA images are commonly acquired in a single phase of the cardiac cycle, often at the end of diastole, although an international expert consensus recommends that measures should be performed during systole.1
Although some studies have shown significant differences in systolic and diastolic measures, other groups suggest that these differences are minor, with little chance to change the decision making process.2,4 However, there are few data in the literature to support recommendations with respect to the importance of these dynamic variations in the size of the aortic valve annulus to assess candidates for TAVI.
This study aimed to evaluate the differences in valve annulus size in systole and in diastole with CTA, and its potential effect on the planning of TAVI procedures.
MethodsConsecutive patients from two centers (Instituto do Coração, Hospital das Clínicas, University of São Paulo Medical School; and Hospital Sírio-Libanês) in the state of São Paulo (SP), with severe aortic valve stenosis (aortic valve area < 1cm2) considered inoperable or at high surgical risk, submitted to TAVI, and with CTA baseline images acquired both at the end of systole and of diastole were included in this analysis. All TAVI procedures were performed via transfemoral access with an Edwards Sapien XT balloon-expandable prosthesis (Edwards Lifesciences, Irvine, USA) or a Medtronic CoreValve auto-expandable prosthesis (Medtronic, Minneapolis, USA).
All scans were performed before (within 2 months) TAVI. Aquilion tomographs with 64- or 256-detector columns (Toshiba Medical Systems, Tokyo, Japan) were used, and the acquisition protocols were applied as previously described.1 CTA image analysis was performed with the use of a dedicated workstation, as previously described, and by a single experienced analyst.1 Briefly, the aortic valve plane was identified and the following valve annulus measurements were obtained in both systole and diastole: maximum (Dmax) and minimum (Dmin) diameter of the oval aortic valve annulus; mean diameter of the oval aortic valve annulus (MD=[(Dmax+Dmin)/2]); planimetered area of the valve annulus (A); area-derived mean diameter, under the assumption of full roundness (DA=2√A/π); perimeter or circumference of the annulus (C); circle-derived mean diameter, under the assumption of full roundness (DC=C/π).
Statistical analysisCategorical variables were presented as absolute numbers and proportions. Continuous variables were presented as mean±standard deviation and compared using the Student's paired t-test. Pearson correlation coefficients were used to correlate systolic and diastolic measures. The method proposed by Bland and Altman was used to assess differences in measurements of the aortic valve annulus in systole vs. diastole with CTA. In the Bland-Altman analysis, the difference between the two measures is plotted against their mean, with limits of 95% calculated to evaluate the correlation between these measures.5,6
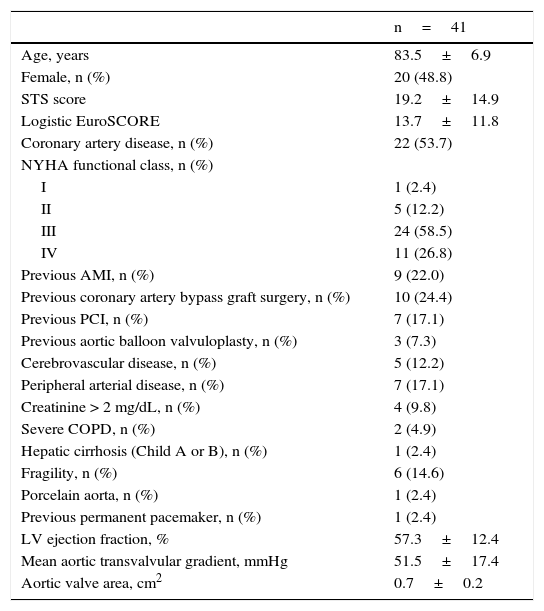
ResultsStudy populationBetween November 2012 and November 2014, 41 patients who underwent TAVI at 2 centers had a basal CTA with images at the end of systole and of diastole. The population characteristics are summarized in Table 1. In total, 48.8% of patients were female and were aged 83.5±6.9 years. The mean logistic EuroSCORE was 13.7±11.8%, and the mean Society of Thoracic Surgeons (STS) score was 19.2±14.9%, reflecting a population at high surgical risk. Most (85.3%) were in functional class III or IV of the New York Heart Association (NYHA). At the baseline echocardiogram, the mean transvalvular gradient was 51.5±17.4mmHg and the mean aortic valve area was 0.7±0.2cm2.
Baseline characteristics.
| n=41 | |
|---|---|
| Age, years | 83.5±6.9 |
| Female, n (%) | 20 (48.8) |
| STS score | 19.2±14.9 |
| Logistic EuroSCORE | 13.7±11.8 |
| Coronary artery disease, n (%) | 22 (53.7) |
| NYHA functional class, n (%) | |
| I | 1 (2.4) |
| II | 5 (12.2) |
| III | 24 (58.5) |
| IV | 11 (26.8) |
| Previous AMI, n (%) | 9 (22.0) |
| Previous coronary artery bypass graft surgery, n (%) | 10 (24.4) |
| Previous PCI, n (%) | 7 (17.1) |
| Previous aortic balloon valvuloplasty, n (%) | 3 (7.3) |
| Cerebrovascular disease, n (%) | 5 (12.2) |
| Peripheral arterial disease, n (%) | 7 (17.1) |
| Creatinine > 2 mg/dL, n (%) | 4 (9.8) |
| Severe COPD, n (%) | 2 (4.9) |
| Hepatic cirrhosis (Child A or B), n (%) | 1 (2.4) |
| Fragility, n (%) | 6 (14.6) |
| Porcelain aorta, n (%) | 1 (2.4) |
| Previous permanent pacemaker, n (%) | 1 (2.4) |
| LV ejection fraction, % | 57.3±12.4 |
| Mean aortic transvalvular gradient, mmHg | 51.5±17.4 |
| Aortic valve area, cm2 | 0.7±0.2 |
STS: Society of Thoracic Surgeons; NYHA: New York Heart Association; AMI: acute myocardial infarction; PCI: percutaneous coronary intervention; COPD: chronic obstructive pulmonary disease; LV: left ventricle.
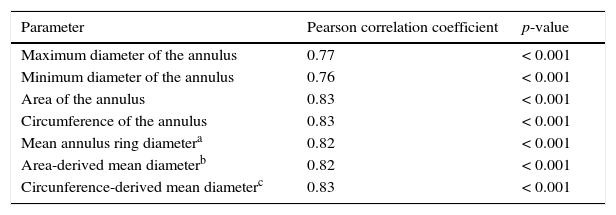
A good linear correlation was observed in systolic and diastolic measures of oval aortic valve annulus-derived maximum, minimum, and mean diameters; of the planimetered area of the valve annulus; of the mean diameter of the area, under the assumption of full roundness; of the circumference of the annulus and of the circumference-derived mean diameter, under the assumption of full roundness (Table 2, Figs. 1–3).
Correlation between systolic and diastolic dimensions of the aortic valve annulus in computed tomography angiography.
| Parameter | Pearson correlation coefficient | p-value |
|---|---|---|
| Maximum diameter of the annulus | 0.77 | < 0.001 |
| Minimum diameter of the annulus | 0.76 | < 0.001 |
| Area of the annulus | 0.83 | < 0.001 |
| Circumference of the annulus | 0.83 | < 0.001 |
| Mean annulus ring diametera | 0.82 | < 0.001 |
| Area-derived mean diameterb | 0.82 | < 0.001 |
| Circunference-derived mean diameterc | 0.83 | < 0.001 |


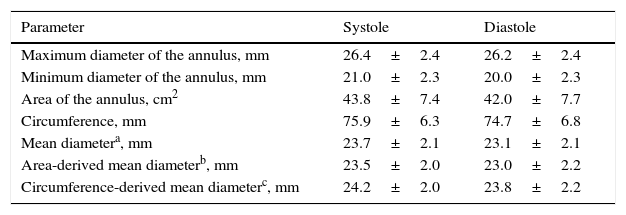
The circumference-derived mean diameters were greater, both in diastole and in systole, when compared to oval aortic valve annulus-derived mean diameters or to area-derived mean diameters, under the assumption of full roundness (Table 3).
Measurements of aortic valve annulus with computed tomography angiography.
| Parameter | Systole | Diastole |
|---|---|---|
| Maximum diameter of the annulus, mm | 26.4±2.4 | 26.2±2.4 |
| Minimum diameter of the annulus, mm | 21.0±2.3 | 20.0±2.3 |
| Area of the annulus, cm2 | 43.8±7.4 | 42.0±7.7 |
| Circumference, mm | 75.9±6.3 | 74.7±6.8 |
| Mean diametera, mm | 23.7±2.1 | 23.1±2.1 |
| Area-derived mean diameterb, mm | 23.5±2.0 | 23.0±2.2 |
| Circumference-derived mean diameterc, mm | 24.2±2.0 | 23.8±2.2 |
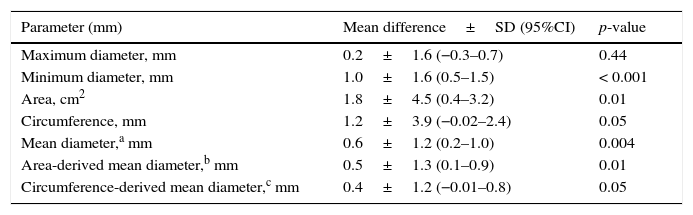
Except for maximum diameter, all measures of the aortic valve annulus were higher in systole, with statistical significance (Table 4). However, the differences between systolic and diastolic measures were small, with the largest difference found for the mean diameter of the annulus (0.6±1.2mm; 95% confidence interval - 95%CI=0.2–1.0; p=0.004). Furthermore, when considering the measurements of all 41 patients, 14 (35%) had at least one diastolic measurement greater than its corresponding systolic measurement. This finding contributes to small, although statistically significant, differences among mean measurements.
Differences in the dimensions of the aortic valve annulus between systole and diastole.
| Parameter (mm) | Mean difference±SD (95%CI) | p-value |
|---|---|---|
| Maximum diameter, mm | 0.2±1.6 (−0.3–0.7) | 0.44 |
| Minimum diameter, mm | 1.0±1.6 (0.5–1.5) | < 0.001 |
| Area, cm2 | 1.8±4.5 (0.4–3.2) | 0.01 |
| Circumference, mm | 1.2±3.9 (−0.02–2.4) | 0.05 |
| Mean diameter,a mm | 0.6±1.2 (0.2–1.0) | 0.004 |
| Area-derived mean diameter,b mm | 0.5±1.3 (0.1–0.9) | 0.01 |
| Circumference-derived mean diameter,c mm | 0.4±1.2 (−0.01–0.8) | 0.05 |
The Bland-Altman plots showed good agreement between systolic and diastolic measurements, with approximately±2mm difference between them (Figs. 4–6).


The main finding was that in patients with severe aortic stenosis undergoing TAVI, there are small differences, although statistically significant, in systolic and diastolic dimensions of the aortic valve annulus, when evaluated by CT angiography with the use of various measures, such as area, circumference, and diameters. The data showed that, despite these differences, there is good agreement between measurements in both phases of the cardiac cycle.
Strictly accurate measurement of the aortic valve annulus is of critical importance in planning TAVI, since oversizing can lead to an usually fatal aortic rupture, while undersizing can cause periprosthetic regurgitation, which is associated with a subsequent worse prognosis.7
CT angiography is currently considered the most accurate method for measuring the size of the aortic valve annulus. However, the literature is scarce with respect to the importance of variations in the dimensions of the aortic valve annulus during the cardiac cycle. While some experts recommend that measures are conducted in systole, many centers acquire single-phase images at the end of diastole, since coronary images are often jointly obtained.1 In this context, the real importance of choosing a specific phase of the cardiac cycle for the measurement of the aortic valve annulus is not yet known.
In patients without aortic root disease, there is significant individual dynamic variation in their dimensions (± 5mm). These variations are independent of clinical variables such as age, gender, height and weight, and are quite unpredictable.2 Although the presence of calcium does not appear to modify these dynamic changes, in patients with severe aortic valvular stenosis the variability appears to occur to a lesser extent.3,4
The present study also found variability in the cardiac cycle with respect to the dimensions of the aortic valve annulus, which occurred on a scale of approximately±2mm. This variability also appears to be very unpredictable, since in 35% of these patients, at least one parameter was higher in diastole than systole, although the mean systolic measures obtained were higher than the mean diastolic measures for all parameters studied. This may explain the small differences in mean measures, with negative differences canceling the positive ones. In fact, the highest mean difference observed was 0.6mm for the oval aortic valve annulus mean diameter, which is unlikely to have an impact on the prosthesis selection or on the procedure outcome.
Limits of agreement between two different measures are actually arbitrarily defined.5 It might be argued that a 2-mm difference between the measures of the aortic valve annulus constitutes an unacceptably high difference. There are cases in which an even greater difference was found. However, in the present data, as shown on Bland-Altman plots, approximately 95% of this population fall between these limits. It is possible that in some cases there will be a greater difference, which may influence the selection of the prosthesis and the outcome of the procedure. Unfortunately, no means to predict such cases could be determined.
Study limitationsThis was a small sample size study, involving only two centers. As there was only one image analyst, interobserver variability could not be assessed. Considering that several parameters (area, circumference, and diameters) have demonstrated different interobserver variability rates in the literature, this may have influenced the results.
ConclusionsAlthough there were statistically significant differences between systolic and diastolic measures of the aortic valve annulus, these were minor and with good agreement between measurements in the various parameters evaluated. Thus, it is unlikely that the choice of the measure for the aortic valve annulus dimension during systole and diastole has a significant impact on the selection of prosthesis, as well as on the outcome of the procedure.
Funding sourceNone.
Conflicts of interestThe authors declare no conflicts of interest.
Peer Review under the responsability of Sociedade Brasileira de Hemodinâmica e Cardiologia Intervencionista.