


Salmonella genus includes around 2600 serovars, causing important zoonotic diseases and enteric fever, with significant impact on public health worldwide. Serovar characterization is commonly achieved by phenotypic and genotypic tests, requiring several days to obtain a result. Mass spectrometry (MS) only allows identification of Salmonella isolates at the genus level. Our aim was to evaluate the performance of MS for Salmonella ser. Enteritidis (SE), Salmonella ser. Typhimurium (STM)/4,[5],12:i:- and Salmonella ser. Typhi (ST) specific-serovar biomarker detection. We included 257 isolates from 34 different serovars (62 SE, 69 STM/4,[5],12:i:-, 17 ST) for analysis of spectra obtained by the direct method, using CHCA as matrix. For acquisition, we used Biotyper MicroFlex LT (Bruker Daltonics) and VITEK MS PRIME (BioMérieux) platforms, and performed a manual search for previously described biomarkers. Using Biotyper MicroFlex LT, sensitivity (Se) for the 3016Da and 6036Da SE biomarkers was 85% and 95%, respectively (specificity (Sp)=100%). The Se for the STM/4,[5],12:i:- biomarker (7095Da) was 100% and the Sp=98%. For ST biomarker (5710Da), Se and Sp were 88% and 100%, respectively. For VITEK MS PRIME, Se for the 3018Da SE biomarker was 42% and for the 6036Da was 79% (Sp=100% for both); for the STM/4,[5],12:i:- biomarker (7096Da), Se was 83% and Sp=97%; and for the ST biomarker (5712Da), Se=94% and Sp=100%. The identification of these frequent serovars can be expedited using MALDI-TOF MS technology. The rapid and reliable diagnosis of salmonellosis can have a positive impact on patient outcomes and public health.
El género Salmonella incluye alrededor de 2.600 serovariedades causantes de enfermedades zoonóticas y fiebre entérica, con impacto en la salud pública. Su caracterización se logra mediante pruebas fenotípicas y genotípicas, y esto requiere varios días para obtener el resultado. La espectrometría de masas (EM) solo permite su identificación a nivel de género. Nuestro objetivo fue evaluar el desempeño de la EM para la detección de biomarcadores específicos de Salmonella ser. Enteritidis (SE), Salmonella ser. Typhimurium (STM)/4,[5],12:i:- y Salmonella ser. Typhi (ST). Incluimos 257 aislamientos de 34 serovariedades (62SE, 69STM/4,[5],12:i:, 17ST) para el análisis de espectros obtenidos con el método directo utilizando HCCA como matriz. Para la adquisición, utilizamos las plataformas Biotyper Microflex LT (Bruker Daltonics) y VITEK MS PRIME (BioMérieux), y realizamos la búsqueda manual de biomarcadores específicos. Utilizando Biotyper Microflex LT, la sensibilidad (S) para los biomarcadores de SE de 3.016Da y 6.036Da fue del 85% y del 95%, respectivamente (especificidad [E]=100%). La S para el biomarcador de STM/4,[5],12:i:- (7.095Da) fue del 100% y la E del 98%. Para el biomarcador de ST (5.710Da) se obtuvo una S=88% y una E=100%. Utilizando VITEK MS PRIME se obtuvo una S=42% para el biomarcador de SE de 3.018Da y una S=79% para el de 6.036Da (E=100% ambos). Para los biomarcadores de STM/4,[5],12:i:- (7.096Da) y de ST (5.712Da), los valores fueron S=83% y E=97%, y S=94% y E=100%, respectivamente. La identificación de serovariedades frecuentes puede agilizarse mediante esta tecnología. El diagnóstico rápido y confiable de salmonelosis puede tener un impacto positivo en la evolución del paciente y en la salud pública.
Salmonella is one of the most important zoonotic pathogens that causes foodborne diseases worldwide, with the exception of S. ser. Typhi, S. ser. Paratyphi A and S. ser. Paratyphi C that are exclusive of humans as no animal or environmental reservoirs have been identified. It includes around 2600 serovars and its characterization is commonly achieved by sera agglutination assays1,9, polymerase chain reaction (PCR)5,10,11 or whole genome sequencing (WGS)17. Sera agglutination and PCR assays involve somatic and flagellar antigen detection, and WGS provides the DNA sequence from which the serotype can be determined. On the other hand, mass spectrometry (MS) only allows identification (ID) of Salmonella isolates at the genus level (as Salmonella spp.)15. While many non-typhoidal serovars, such as S. ser. Enteritidis (SE) and S. ser. Typhimurium (STM), are generalist pathogens that commonly cause gastroenteritis, a few S. enterica serovars, including S. ser. Typhi (ST) and others, are the causative agents of enteric fever, an invasive, life-threatening systemic disease7. Some research groups have investigated MALDI-TOF MS technology for serovars specific biomarker detection, such as SE3,4,8,13,18, STM and its monophasic variant (4,[5],12:i:-)8,18, and ST6, among others. The aim of this study was to evaluate the performance of two different mass spectrometry platforms (Biotyper MicroFlex LT and VITEK MS PRIME) for SE, STM/4,[5],12:i:-, and ST biomarker detection in Argentina.
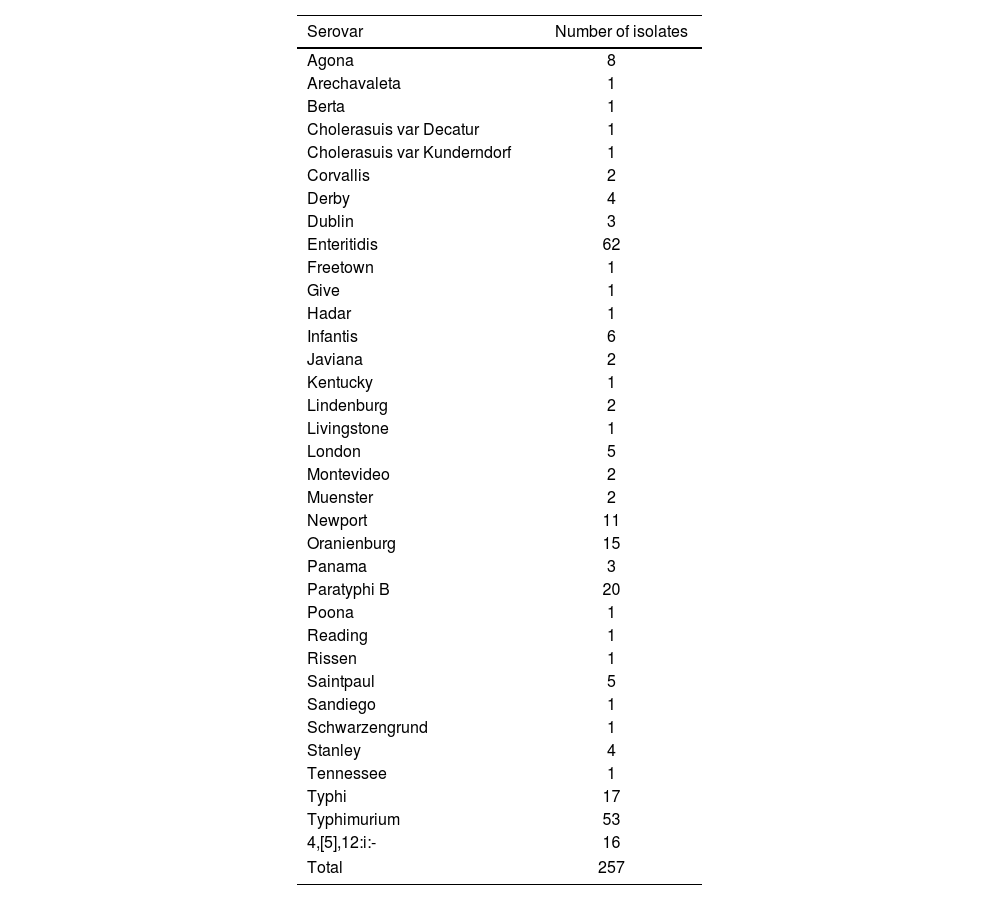
Materials and methodsBacterial isolatesWe evaluated a total of 257 Salmonella spp. isolates using the Bruker MicroFlex LT version 3.4 and VITEK MS PRIME platforms, including 34 different serovars analyzed in the national surveillance program (Table 1). All isolates belong to the National Diarrhea Network for the Surveillance of Enteropathogens (Red Nacional de Diarreas y Patógenos Bacterianos de Transmisión Alimentaria, Argentina) and were isolated on Salmonella–Shigella agar (SS) (Britania, Argentina). Isolates were received in 2024, except for 16 ST samples, recovered from 2004–2023.
Salmonella enterica subsp. enterica serovars included in this study.
| Serovar | Number of isolates |
|---|---|
| Agona | 8 |
| Arechavaleta | 1 |
| Berta | 1 |
| Cholerasuis var Decatur | 1 |
| Cholerasuis var Kunderndorf | 1 |
| Corvallis | 2 |
| Derby | 4 |
| Dublin | 3 |
| Enteritidis | 62 |
| Freetown | 1 |
| Give | 1 |
| Hadar | 1 |
| Infantis | 6 |
| Javiana | 2 |
| Kentucky | 1 |
| Lindenburg | 2 |
| Livingstone | 1 |
| London | 5 |
| Montevideo | 2 |
| Muenster | 2 |
| Newport | 11 |
| Oranienburg | 15 |
| Panama | 3 |
| Paratyphi B | 20 |
| Poona | 1 |
| Reading | 1 |
| Rissen | 1 |
| Saintpaul | 5 |
| Sandiego | 1 |
| Schwarzengrund | 1 |
| Stanley | 4 |
| Tennessee | 1 |
| Typhi | 17 |
| Typhimurium | 53 |
| 4,[5],12:i:- | 16 |
| Total | 257 |
After isolation on SS Agar, a single colony of each isolate was grown on Tryptic Soy Agar (TSA) (Britania, Argentina) after overnight incubation at 37°C, and tested by Triple Sugar Iron Agar (TSI) (Britania, Argentina) and Lysine Decarboxylase (Britania, Argentina) assays. From TSA, isolates underwent antisera agglutination according to the White–Kauffmann–LeMinor scheme, for serotyping14, and DNA extraction for PCR assays for somatic (O:8, O:4, O:9, O:3,10, O:7)11 and flagellar antigen (H:d, H:b, H:e,h, H:i, H:G, H:1,2 and SdfI region) detection10,11. Some isolates were also characterized by WGS at Unidad Operativa Centro Nacional de Genómica y Bioinformática.
MALDI-TOF MS biomarker detection protocol from coloniesFor the Biotyper MicroFlex LT platform (Bruker Daltonics, Germany), fresh colonies were transferred from TSA to the MALDI steel plate (MSP 96 target ground Steel; Bruker Daltonics, Germany) in duplicate using a wooden toothpick, and covered with 1μl of α-cyano-4-hidroxycinnamic acid (CHCA) matrix (Bruker Daltonics, Germany)2. Similarly, fresh colonies were transferred from TSA onto the VITEK MS PRIME slide (VITEK MS-DS SLIDE) (BioMérieux, France) in duplicate and covered with 1μl of CHCA matrix (BioMérieux, France)2. Additionally, we processed a subset of samples (15 SE, 17 STM/4,[5],12:i:- and 16 ST) from Sheep Blood Agar (SBA) and Mueller Hinton Agar (MHA) for biomarker search.
Calibration and spectra acquisitionBiotyper MicroFlex LT mass spectrometer was automatically calibrated with a Bacterial Test Standard solution (Bruker Daltonics, Germany) before each run. Spectra were acquired automatically using the FlexControl 3.4 software (Bruker Daltonics, Germany) and parameters were set as follows (default settings): mass range: 1960–20000Da, detection gain: 2702V, frequency: 60Hz, ion source 1: 19.97kV, ion source 2: 17.73kV.
VITEK MS PRIME was automatically calibrated with an E. coli ATCC 8739 isolate or VITEK MS SMARTCALIBRANT before each run. Spectra were acquired automatically using the VITEK MS IVD V3.2 software and default acquisition parameters. Subsequently, we used the SARAMIS Premium database (RUO) for diagram generation and manual and visual biomarker detection.
Detection of biomarkersFor biomarker detection, we included spectra of isolates that achieved an ID score ≥2 using Biotyper MicroFlex LT, and a 99.9% confidence value for VITEK MS PRIME. We searched for previously reported specific biomarkers for SE (∼3016Da and ∼6036Da)3,8,18, STM/4,[5],12:i:- (∼7093Da)8,12 and ST (5173Da)6.
For the Biotyper MicroFlex LT platform, we performed manual inspection of spectra using the FlexAnalysis software. Spectra obtained from each sample were imported into the software and, after baseline subtraction and smoothing, we searched the “Mass list” for each serovar biomarker. We recorded signal-to-noise ratio (S/N) and intensity values for each peak, and performed a visual confirmation on the spectra. For the VITEK MS PRIME platform, after importing spectra acquired for ID into the SARAMIS Premium software, we searched for the reported biomarkers in the mass list of each spectrum, and examined each diagram visually.
Data analysisWe recorded the presence or absence of the serovar biomarkers for each isolate in duplicate. Biomarkers were considered identified if they were present in one or both spectra of the sample. Finally, we calculated the sensitivity (Se) and specificity (Sp) for each biomarker and for each MS platform, in order to compare their performances.
ResultsPhenotypic and genotypic characterizationTSI and LIA results were concordant with Salmonella spp. for all samples. Sixteen isolates were characterized solely by antisera agglutination, 116 serovars were determined by PCR, and 80 isolates were analyzed by both methods. Additionally, we analyzed 45/257 isolates by WGS (Table S1).
Isolates belonged to the following serovars: 62 SE, 53 STM, 16 4,[5],12:i:-, 17 ST, and 109 of other less frequent serovars (Table S1).
S. ser. Enteritidis biomarker detectionBiotyper MicroFlex LT platformWe observed SE2-specific biomarkers at 3016Da (−6/+2Da) (Fig. 1a) and 6036Da (−4/+2Da) (Fig. 1b), showing a Se of 85% and 95%, respectively, and a Sp of 100% for both peaks (Table 2). We observed the 3016Da signal in 53/62 SE isolates spectra and the 6036Da in 59/62. S/N ranged from 3 to 42 for the 3016Da peak (signal intensities: 234 arbitrary units (a.u.) to 9309 a.u.), and from 4 to 106 for the 6036Da peak (signal intensities: 884 a.u. to 18549 a.u.). We observed no false positives for both SE biomarkers.
![Biotyper MicroFlex LT (Bruker Daltonics) spectra. Corresponding serovar spectra are shown in red and non-serovar spectra are shown in blue: (a) S. ser. Enteritidis 3016Da biomarker; (b) S. ser. Enteritidis 6036Da biomarker; (c) S. ser. Typhimurium/4,[5],12:i:- 7095Da biomarker; and (d) S. ser. Typhi 5710Da biomarker. The biomarker m/z value for one spectrum of each serovar is shown in numbers.](https://static.elsevier.es/multimedia/03257541/unassign/S0325754125001002/v1_202511260434/en/main.assets/gr1.jpeg?xkr=ue/ImdikoIMrsJoerZ+w997EogCnBdOOD93cPFbanNcPMvuszv5A9QdK+z3ojhHWST6JpRlkH6IyZMg0s/mCPS2ZNsbC5mgLPE7FsEFI/RDCH/+xZKwheCAaI8EL73IhEn2ksyAmsFJ/xMc0Ld9gad6pL78qixTryEZG1nDTdDoCtENbKmaxilgOlvLVvAFqOKb6qiwHhgXMdvM2msQKR+VjLfYtJE3bHtrVN8HealbRjqydds9fxlT4tsUH4vCKumesQs1A7m+OMGYD+BXceY3PIk2s7iU7QooDFIOM174= "Biotyper MicroFlex LT (Bruker Daltonics) spectra. Corresponding serovar spectra are shown in red and non-serovar spectra are shown in blue: (a) S. ser. Enteritidis 3016Da biomarker; (b) S. ser. Enteritidis 6036Da biomarker; (c) S. ser. Typhimurium/4,[5],12:i:- 7095Da biomarker; and (d) S. ser. Typhi 5710Da biomarker. The biomarker m/z value for one spectrum of each serovar is shown in numbers.")
Biotyper MicroFlex LT (Bruker Daltonics) spectra. Corresponding serovar spectra are shown in red and non-serovar spectra are shown in blue: (a) S. ser. Enteritidis 3016Da biomarker; (b) S. ser. Enteritidis 6036Da biomarker; (c) S. ser. Typhimurium/4,[5],12:i:- 7095Da biomarker; and (d) S. ser. Typhi 5710Da biomarker. The biomarker m/z value for one spectrum of each serovar is shown in numbers.
Biotyper MicroFlex LT (Bruker Daltonics) biomarker detection results.
| S. ser. Enteritidis | S. ser. Enteritidis | S. ser. Typhimurium/4,[5],12:i:- | S. ser. Typhi | |
|---|---|---|---|---|
| 3016 −6/+2Da | 6036 −4/+2Da | 7095 −4/+6Da | 5710 −2/+5Da | |
| True positives | 53 | 59 | 69 | 15 |
| True negatives | 195 | 195 | 185 | 240 |
| False positives | 0 | 0 | 3* | 0 |
| False negatives | 9 | 3 | 0 | 2 |
| Sensitivity | 85% | 95% | 100% | 88% |
| Specificity | 100% | 100% | 98% | 100% |
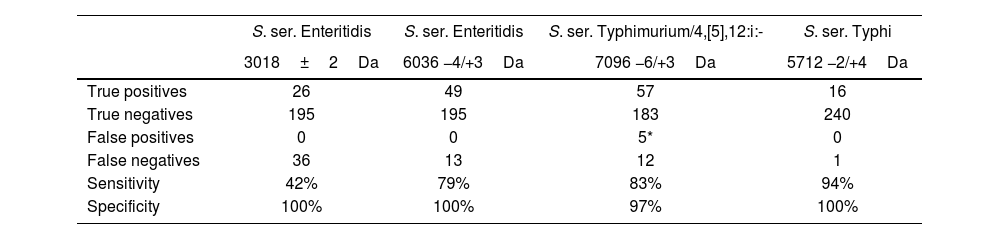
When using the VITEK platform, a 3018Da (±2Da) signal was observed in 26/62 SE isolates (Fig. 2a) (Se=42%, Sp=100%), and a 6036Da (−4/+3Da) peak was recorded for 49/62 SE isolates (Fig. 2b) (Se=79%, Sp=100%) (Table 3). We did not observe false positive spectra for SE biomarkers with this MS platform either.
![VITEK MS PRIME (BioMérieux) spectra. Serovars spectra visuallyzed with SARAMIS Premium software: (a) S. ser. Enteritidis 3018Da biomarker; (b) S. ser. Enteritidis 6036Da biomarker; (c) S. ser. Typhimurium/4,[5],12:i:- 7096Da biomarker; and (d) S. ser. Typhi 5712Da biomarker. Biomarkers are indicated with a blue arrow. Spectra of the corresponding serovars are shown in blue, and superspectra from the database are shown in red.](https://static.elsevier.es/multimedia/03257541/unassign/S0325754125001002/v1_202511260434/en/main.assets/gr2.jpeg?xkr=ue/ImdikoIMrsJoerZ+w997EogCnBdOOD93cPFbanNcPMvuszv5A9QdK+z3ojhHWST6JpRlkH6IyZMg0s/mCPS2ZNsbC5mgLPE7FsEFI/RDCH/+xZKwheCAaI8EL73IhEn2ksyAmsFJ/xMc0Ld9gad6pL78qixTryEZG1nDTdDoCtENbKmaxilgOlvLVvAFqOKb6qiwHhgXMdvM2msQKR+VjLfYtJE3bHtrVN8HealbRjqydds9fxlT4tsUH4vCKumesQs1A7m+OMGYD+BXceY3PIk2s7iU7QooDFIOM174= "VITEK MS PRIME (BioMérieux) spectra. Serovars spectra visuallyzed with SARAMIS Premium software: (a) S. ser. Enteritidis 3018Da biomarker; (b) S. ser. Enteritidis 6036Da biomarker; (c) S. ser. Typhimurium/4,[5],12:i:- 7096Da biomarker; and (d) S. ser. Typhi 5712Da biomarker. Biomarkers are indicated with a blue arrow. Spectra of the corresponding serovars are shown in blue, and superspectra from the database are shown in red.")
VITEK MS PRIME (BioMérieux) spectra. Serovars spectra visuallyzed with SARAMIS Premium software: (a) S. ser. Enteritidis 3018Da biomarker; (b) S. ser. Enteritidis 6036Da biomarker; (c) S. ser. Typhimurium/4,[5],12:i:- 7096Da biomarker; and (d) S. ser. Typhi 5712Da biomarker. Biomarkers are indicated with a blue arrow. Spectra of the corresponding serovars are shown in blue, and superspectra from the database are shown in red.
VITEK MS PRIME (BioMérieux) biomarker detection results.
| S. ser. Enteritidis | S. ser. Enteritidis | S. ser. Typhimurium/4,[5],12:i:- | S. ser. Typhi | |
|---|---|---|---|---|
| 3018±2Da | 6036 −4/+3Da | 7096 −6/+3Da | 5712 −2/+4Da | |
| True positives | 26 | 49 | 57 | 16 |
| True negatives | 195 | 195 | 183 | 240 |
| False positives | 0 | 0 | 5* | 0 |
| False negatives | 36 | 13 | 12 | 1 |
| Sensitivity | 42% | 79% | 83% | 94% |
| Specificity | 100% | 100% | 97% | 100% |
We observed one STM/4,[5],12:i:- specific biomarker at 7095Da (−4/+6Da) (Fig. 1c), showing a Se of 100% and Sp of 98% (Table 2). S/N ranged from 3 to 22 and signal intensities from 456 a.u. to 4614 a.u. for the selected peak. We observed three false positives for this biomarker, in spectra corresponding to S. ser. Newport isolates.
VITEK MS PRIME platformWe observed a specific biomarker at 7096Da (−6/+3Da) in 57/69 STM/4,[5],12:i:- isolates (Fig. 2c), absent in non-STM/4,[5],12:i:- spectra, showing Se of 83% and Sp of 97% (Table 3). Three Salmonella ser. Newport, 1 Salmonella ser. Cholerasuis var Kunderndorf and 1 Salmonella ser. Freetown isolates yielded a false positive result for this biomarker.
S. ser. Typhi biomarker detectionBiotyper MicroFlex LT platformWe observed 1 ST specific biomarker at 5710Da (−2/+5Da) (Fig. 1d), showing a Se of 88% and a Sp of 100% (Table 2), present in 15/17 ST spectra. S/N ranged from 4 to 63 and signal intensities from 939 a.u. to 13043 a.u. for the selected peak. We observed no false positives for this biomarker.
VITEK MS PRIME platformWe observed a specific biomarker at 5712Da (−2/+4Da) in 16/17 ST isolates (Fig. 2d), absent in non-ST spectra, showing Se of 94% and Sp of 100% (Table 3), with no false positive results.
Biomarker detection from SBA and MHABiotyper Microflex LTSE biomarker detection from SBA showed 2 concordances and 13 discordances for the 3016Da signal, and 7 concordances and 7 discordances for the 6036Da peak, compared to detection from TSA. Detection from MHA showed no concordances for the 3016Da peak, and 3 (3/15) concordances for the 6036Da biomarker. When analyzing STM/4,[5],12:i:- detection from SBA, we observed 11 concordances and 6 discordances, and from MHA, 13 concordances (13/17). Concordances for the ST biomarker were 13 (13/16) when using SBA, and 15 when using MHA.
VITEK MS PRIMESE biomarkers detection from SBA showed 5 concordances and 10 discordances for the 3018Da signal, and 12 concordances and 3 discordances for the 6036Da peak, compared to detection from TSA. Detection from MHA showed 3 concordances for the 3016Da peak, and 6 concordances for the 6036Da biomarker. We found 9 (9/17) concordances for STM/4,[5],12:i:- biomarker detection from SBA and 4 concordances from MHA. Concordances for ST biomarker were 16 when using SBA, and 14 when using MHA.
DiscussionPerformance for ST 5710Da (Biotyper MicroFlex LT)/5712Da (VITEK MS PRIME) biomarker was good for both MS platforms, although higher for VITEK MS PRIME. On the other hand, Se for SE 3016 (Biotyper MicroFlex LT)/3018Da (VITEK MS PRIME), SE 6036Da biomarker and STM/4,[5],12:i:- 7095Da biomarker was significantly higher for Biotyper MicroFlex LT than for the VITEK MS PRIME platform. Considering SE biomarkers, the 3016Da (Biotyper MicroFlex LT)/3018Da (VITEK MS PRIME) signal detection Se was not satisfactory for our sample set employing both MS platforms; therefore, we recommend detection of 6036Da signal for this particular serovar in our country.
In 2011, Dieckmann and Malorny4 described several Salmonella serovar-specific biomarkers using the whole-cell method, sinapinic acid as the matrix and a MALDI-TOF/TOF mass spectrometer, and reporting SE 6036Da and STM/4,[5],12:i:- 7097Da specific signal, among others. Even though they could assign specific biomarkers to relevant serovars or groups of serovars, the organic matrix and mass spectrometer used in this study are not among the most commonly used in current clinical settings. MS experimental differences can render different results; in fact, when we searched for the biomarkers described by Dieckmann and Malorny4 in our sample set, we only found the SE and STM/4,[5],12:i:- signals.
In the following years, many more researchers described one or two SE specific biomarkers. Novak et al.13, found a Se of 95% and Sp=100% for the m/z 6036 (+6Da/−8Da) biomarker when using the Microflex LT platform (Bruker) and a direct method (without protein extraction) in concordance with our results. In 2020, Mangmee et al.12, detected a 6037±1Da signal, specific for SE using machine learning analysis. Yang et al.18, evaluated the 3018±1Da and 6036±1Da SE biomarker detection, in reference, food and environmental strains, achieving excellent results. Gao et al.8, reported the presence of a 3018Da signal with a Se=82% for SE detection and a Se=95% for a combination of signals, including the mentioned mass peak. Our research group previously evaluated the presence of both SE biomarkers, analyzing 105 Salmonella isolates (including 50 SE) recovered in 2023, and found a Se of 54% for the 3016±3Da signal, and a Se of 98% for the 6034±3Da peak, in concordance with the results presented in the current study3.
Regarding STM and its monophasic variant (4,[5],12:i:-), Mangmee et al.12, found a 7098±1Da signal in 20 isolates belonging to this serovar when analyzing non-typhoidal Salmonella, in concordance with our study. On the other hand, Yang et al.18 reported a novel 7184±1Da specific biomarker found in STM reference, food and environmental isolates. This specific signal was not observed in Mangmee et al., nor in our set of samples. Gao et al.8, described the detection of the 7100Da biomarker in STM with a Se=82%, and did not detect the signal previously observed by Yang et al. When using the Microflex LT MS platform, we found three false positive results for the STM/4,[5],12:i:- biomarker, which were phenotypically and genotypically characterized as S. ser. Newport, recovered from human stool samples. These results are in concordance with Dieckmann and Malorny's research4 that found this biomarker in a set of S. ser. Newport isolates (mainly avian strains). VITEK MS PRIME rendered five false positive results for this biomarker, including the serovars S. ser. Newport (3), S. ser. Cholerasuis var Kunderndorf (1) and S. ser. Freetown (1).
The ST specific biomarker reported in our research was previously described by Kuhns et al.6 as a major ST peak biomarker of 5713.9Da in a study performed with isolates recovered from blood samples. Our results regarding this biomarker are in concordance with their results.
This MS protocol allows the differentiation of the most common typhoid Salmonella serovar in our country from non-typhoidal serovars, which directly impacts medical decisions regarding patient treatment. For example, while enteric fever is immediately treated with antibiotics, they are not recommended when the infection is caused by non-typhoidal strains, as they are self-limiting, although there are exceptions depending on the host7.
This is the first study in which the detection of Salmonella serovar biomarkers is evaluated in parallel on the two most commonly used MS platforms worldwide16. In fact, as far as we know, VITEK MS PRIME platform has not been evaluated for Salmonella serovar biomarkers detection before.
The methodology proposed here (direct MS analysis from TSA medium culture, and biomarker manual detection) is quite simple, requiring minimal steps and reagents, and fast, decreasing the time to result from approximately 10 days to 48h once the sample is analyzed for the selected serovars. We previously reported a low performance for SE biomarker detection from SS Agar3. In the current study, we obtained better results when growing bacteria on TSA, rather than SBA or MHA.
ConclusionMost clinically relevant Salmonella serovars in Argentina can be easily identified by MALDI-TOF MS following this simple and fast protocol. S. ser. Enteritidis, STM/4,[5],12:i:- and ST biomarkers were successfully detected in our sample set, using two different MS platforms. The determination of these frequent serovars is significantly accelerated by MALDI-TOF MS technology. After detecting these biomarkers at the hospital or local laboratory, final serovar identification and confirmation should be conducted by serology or PCR by a reference laboratory. The rapid and reliable diagnosis of salmonellosis can have a positive impact on patient outcomes and public health, as this methodology is transferable to laboratories that belong to the National Diarrhea Network.
This method could be a valuable tool if integrated into clinical microbiology laboratories, given that frequent and relevant Salmonella serovars could be easily identified, achieving a preliminary result. In addition, the number of isolates requiring subsequent identification by serology or PCR protocols in routine daily work would be reduced. Finally, fast serovar detection could contribute to diagnostic guidance and medical treatment based on the differentiation of the most common typhoid and non-typhoid salmonella in our country.
FundingThis study was supported by Instituto Nacional de Enfermedades Infecciosas – ANLIS – “Carlos G. Malbrán”, Buenos Aires, Argentina.
Conflict of interestThe authors declare no commercial or financial conflict of interest.
We deeply thank Mónica Prieto and Paula Etcheverry from Bacteriología Especial Service, for their help and scientific guidance. We would also like to thank Julián Defazio from bioMérieux, for supplying reagents and materials.
The following are the supplementary data to this article:
