

Changes in pacing rhythm are translated into functional and metabolic changes that can be significantly reflected in the final results of an athlete.
MethodTen male subjects, with moderate performance level (age: 25.2±2.2 years; VO2max: 56.9±5.7mlkg−1min−1), performed four 5-min races with different pacing strategies: constant-pace (CP), record-pace (RP), kicker-pace (KP), incremental-pace (IP).
ResultsThe cardio-respiratory response did not show statistically significant. There were statistically significant differences (p≤0.05) in the energetic efficiency among the protocols CP vs. RP, CP vs. KP and RP vs. IP. When results were analyzed by partials (1-min duration phases), significant differences were observed in the energetic efficiency during the 3rd-min among CP vs. KP, RP vs. KP and KP vs. IP. These significant differences were extended to the 4th-min when comparing CP vs. IP, CP vs. KP, KP vs. RP and KP vs. IP. In the last minute of the test, there were significant differences among CP vs. KP. No significant differences were found in any of the variables assessing anaerobic metabolism (accumulated oxygen deficit, oxygen debt, oxygen uptake kinetics and blood lactate) between both protocols.
ConclusionsResults suggest that the main functional systems response are significantly affected by the pacing strategy used by middle-level subjects during middle-distance running.
Los cambios en el ritmo de carrera se traducen en cambios funcionales y metabólicos que pueden reflejarse significativamente en los resultados finales de un atleta.
MétodoDiez sujetos varones, con un nivel medio (edad: 25.2±2.2 años; VO2max: 56.9±5.7mlkg−1min−1), llevaron a cabo carreras de 5 minutos con diferentes estrategias: ritmo constante (RC), ritmo récord (RR), ritmo kicker (RK) y ritmo incremental (RI).
ResultadosLa respuesta cardiorespiratoria no mostró diferencia estadísticamente significativa. Hubo diferencias estadísticamente significativas (p≤0.05) en la eficiencia energética entre los protocolos CP vs. RP, CP vs. KP and RP vs. IP. Cuando los resultados se analizaron por parciales (fases de un minuto de duración), se observaron diferencias significativas en le eficiencia energética durante el tercer minuto entre RC vs. RK, RR vs. RK y RK vs. RI. Estas diferencias significativas se extendieron al cuarto minuto cuando se compararon RC vs. RI, RC vs. RK, RK vs. RR y RK vs. RI. En el último minuto del test, hubo diferencias significativas entre RC vs. RK.
No se encontraron diferencias significativas en ninguna de las variables que valoran el metabolismo anaeróbico (déficit de oxígeno, deuda de oxígeno, cinética del consumo de oxígeno y lactato en sangre) entre ambos protocolos.
ConclusionesLos resultados sugieren que la respuesta de los principales sistemas funcionales se ve afectada significativamente por la estrategia de carrera empleada por un grupo de sujetos de nivel intermedio durante una carrera de media distancia.
Alterações no ritmo de corrida se traduzem em mudanças funcionais e metabólicas que podem ser refletidas de forma significativa nos resultados finais de um atleta.
MétodoDez indivíduos do sexo masculino, com nível de desempenho moderado (idade: 25.2±2.2 anos; VO2máx: 56.92±5.7ml · kg-1 · min-1), realizaram quatro corridas de 5 minutos com diferentes estratégias de corrida: velocidade constante, velocidade recorde, velocidade kicher e velocidade incrementada.
ResultadosA resposta cardiorrespiratória não demostrou estatisticamente significativa. Houve diferenças estatisticamente significativas (p≤0.05) na eficiência energética entre os protocolos CP vs. RP, CP vs. KP and RP vs. IP, quando os resultados foram analisados por parciais (1min de duração). Foram observadas diferenças significativas na eficiência energética durante o 3°-min entre CP vs. KP, RP vs. KP e KP vs. IP. Estas diferenças significativas foram estendidas para o 4°-min na comparação CP vs. IP, CP vs. KP, CP vs. KP, KP vs. RP e KP vs. IP. No último minuto do teste, houve diferenças significativas entre CP vs. KP. Não foram encontradas diferenças significativas em nenhuma das variáveis que avaliam o metabolismo anaeróbico (déficit de oxigênio acumulado, débito de oxigênio, cinética do consumo de oxigênio e lactato no sangue) entre ambos os protocolos.
ConclusõesOs resultados sugerem que as principais respostas dos sistemas funcionais são afetadas significativamente pela estratégia de corrida usado por indivíduos de nível médio durante a meia-corrida de longa distância.
The effort distribution and the energetic requirements during a cyclic modality are called pacing or pacing strategy,1,2 thus being considered as a determinant factor in the final test result.1,3,4 The pacing strategy is defined as the velocity variation during a pace by regulating the ratio of energy expenditure4 and is proposed to be a marker of underlying physiological regulation.5 The way of distributing the effort depends on the type of event or objective record, the performance duration,2 the runners’ characteristics resistant and the environment conditions.
There is no consensus about classifying the tactical variants that can be observed in the middle-distance and long-distance races,6,7 although the most efficient pacing strategy in a middle distance running appears to be the Parabolic-Shaped Pacing (U-Shaped, Reserve J-Shaped and J-Shaped).8 That is to say, a faster exit, followed by gradual decrease in the mean distance of the event and final acceleration.
In this type of tests, the velocity variations range between 5 and 10%.9–11 Sometimes, the U-shaped strategy shows very low decreases in the race rhythm at half of the race, showing a tendency to a stable rhythm (even pacing). These race rhythm behaviors can be checked up on when analyzing the main international athletic competitions (Olympic Games, World Championships, European Championships or World Records).
Thus, voluntary or involuntary changes during the test rhythm are translated into functional and metabolic changes2,12 that can even be significantly reflected in the final result as well as in the athlete's capacity.13 However, there is no concrete knowledge about how does the organism respond to changes in the race strategy.10 There is also no accurate idea of the objective causes that underlie the reasons why athletes are inclined to the use of either race strategy during competition. Neither is still not completely understood how athletes regulate their speed to optimize performance in supramaximal races such as middle-distance events.10
The aim of the present study was to detect, in intermediate level subjects, if changes in the race strategy (5-min treadmill running) cause changes in the mechanical of the race, energetic consumption, metabolic response and cardio-respiratory response during a middle-distance race performed at high (not maximal) intensity.
MethodSubjectsWe evaluated 10 subjects, male physical education students (age: 25.2±2.2 years; body weight: 69.8±5.5kg; height: 175.7±3.2cm; fat percentage: 8.2±1.3%; VO2max: 56.9±5.7mlkg−1min−1) with moderate performance level.
The study was approved by the Research Ethics ommitee of ULPGC (Spain), in accordance with the regulations of resolution of National Council on Ethics in Human Research and in accordance with the Declaration of Helsinki.
During the sample recruitment, the subjects were concretely informed about the investigation nature to which they were going to be submitted, as well as the possible risks of being experimental subjects. Once they accepted to be part of the study, they signed their agreement in a consent document. In this document, they expressed their accordance with what mentioned above, specifying the following aspects: (a) ethic criteria, in which the investigation team assumed the established guidelines, for humans investigation, in the 18th World Medical Assembly with subsequent amendments; (b) detailed and concise information about the different test characteristics, as being part of the experimental study; (c) consent for the data recording and processing, obtained by researchers from the Laboratory of Analysis and Planning of Sports Training, as well as the use of these data in studies and scientific publications; and (d) clarification of the opportunity to refuse, when considering, to perform any of the tests.
Experimental designThe runners were required to visit the laboratory on seven separate occasions. On their first visit to the laboratory, the subjects were detailed informed about the investigation aspects to, later, perform the anthropometric assessment. Also, were asked to maintain their regular activity pattern for the duration of the study. On the second visit the subjects were given the opportunity to become familiar with the equipment and testing protocols that would be used during the trial. Before performing the tests (different pacing strategy) each subject performed an incremental exhaustive treadmill test (Ergopower®) to evaluate each individual's oxygen delivery system. The continue test was unable to maintain the treadmill pace. VO2max was defined as the highest oxygen consumption during incremental test over 15s period. Gas analyzer was calibrated before each test.
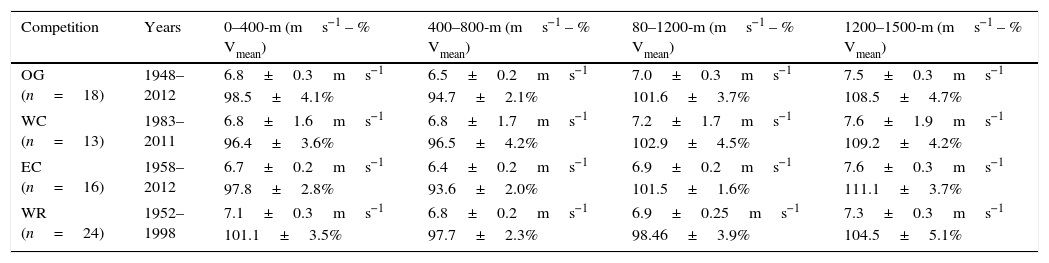
The four following days after the visit to the laboratory, the subjects performed the different 5-min races with intensities, previously established, which changed or not every 20-s depending on the characteristics of the assessing protocol. The race rhythms, in each case, were established from the behaviors observed in high performance athletes of 71 official male competitions (Olympic Games; World Championships; European Championships and World Records; European Championships; Outdoor World Record) (Table 1).
Laps (velocity and percentage respect to the mean velocity) corresponding to the four race sections in which the 1500-m test (male) was divided in the Olympic Games (OG: 1948–2012); World Championships (WC: 1983–2011); European Championships (EC: 1958–2012) and World Records (WR: 1952–1998).
| Competition | Years | 0–400-m (ms−1 – % Vmean) | 400–800-m (ms−1 – % Vmean) | 80–1200-m (ms−1 – % Vmean) | 1200–1500-m (ms−1 – % Vmean) |
|---|---|---|---|---|---|
| OG (n=18) | 1948–2012 | 6.8±0.3ms−1 | 6.5±0.2ms−1 | 7.0±0.3ms−1 | 7.5±0.3ms−1 |
| 98.5±4.1% | 94.7±2.1% | 101.6±3.7% | 108.5±4.7% | ||
| WC (n=13) | 1983–2011 | 6.8±1.6ms−1 | 6.8±1.7ms−1 | 7.2±1.7ms−1 | 7.6±1.9ms−1 |
| 96.4±3.6% | 96.5±4.2% | 102.9±4.5% | 109.2±4.2% | ||
| EC (n=16) | 1958–2012 | 6.7±0.2ms−1 | 6.4±0.2ms−1 | 6.9±0.2ms−1 | 7.6±0.3ms−1 |
| 97.8±2.8% | 93.6±2.0% | 101.5±1.6% | 111.1±3.7% | ||
| WR (n=24) | 1952–1998 | 7.1±0.3ms−1 | 6.8±0.2ms−1 | 6.9±0.25ms−1 | 7.3±0.3ms−1 |
| 101.1±3.5% | 97.7±2.3% | 98.46±3.9% | 104.5±5.1% | ||
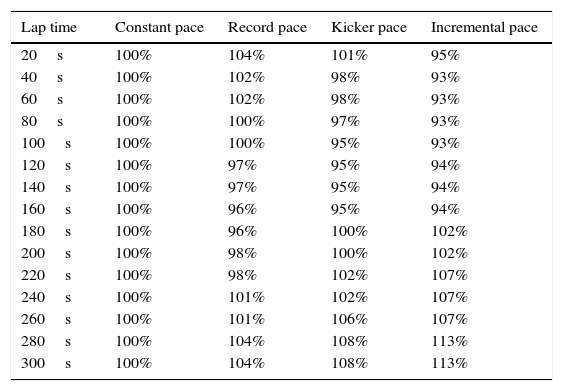
The rhythm changes observed in these official competitions, in each phase of the test (beginning, middle and end of the test), are similar to the maximal levels proposed by other authors for this duration tests.14,15 These references were criteria used to select the rhythms of the four protocols used in our study (constant-pace, CP; record-pace, RP; kicker-pace, KP; incremental-pace, IP) (Table 2).
Race intensities (percentage respect to the mean velocity) used, in each protocol, in the different 20s sections in which the treadmill race was divided.
| Lap time | Constant pace | Record pace | Kicker pace | Incremental pace |
|---|---|---|---|---|
| 20s | 100% | 104% | 101% | 95% |
| 40s | 100% | 102% | 98% | 93% |
| 60s | 100% | 102% | 98% | 93% |
| 80s | 100% | 100% | 97% | 93% |
| 100s | 100% | 100% | 95% | 93% |
| 120s | 100% | 97% | 95% | 94% |
| 140s | 100% | 97% | 95% | 94% |
| 160s | 100% | 96% | 95% | 94% |
| 180s | 100% | 96% | 100% | 102% |
| 200s | 100% | 98% | 100% | 102% |
| 220s | 100% | 98% | 102% | 107% |
| 240s | 100% | 101% | 102% | 107% |
| 260s | 100% | 101% | 106% | 107% |
| 280s | 100% | 104% | 108% | 113% |
| 300s | 100% | 104% | 108% | 113% |
To determine the mean velocity at which each subject was going to be evaluated, we used the following protocol: after the familiarization phase (3 sets of 6min at 12-minkm−1 and 2 sets of 4min at 15-minkm−1) performed the second day, the subjects performed 3 sets of 6–8min of duration in treadmill with an inclination of 1.0. After a 12-min warm up at an intensity of 12kmh−1, 3 sets were performed until fatigue was reached (recovery: 8min and 12min) with increasing intensities trying to reach exhaustion at a time of between 6 and 8min (example: 10-min at 12kmh−1 recovery 10min+6-min at 16kmh−1 recovery 12min+8-min at 18kmh−1 recovery 10min+all-out at 20kmh−1). From the distance performed during the last set, we determined the individuals’ performance level (NR), applying the following equation: NR=V/D−α; where V is the velocity in ms−1; D is the distance in meters; α is the exponent with a value of −0.0712. Once known the NR value, we estimated the theoretical value in a race of 1500m and determined the mean velocity expressed in kmh−1. Once known this value, we deducted a 5% to set the mean intensity of the four used protocols.
Evaluated variablesDuring the imposed strategy trials, the respiratory gas exchange was measured using an analyzer Ganshorn Medicine Electronic GmbH to monitor the ventilation values (VE), oxygen consumption (VO2), CO2 production (VCO2) and respiratory coefficient (RER). We determined the energetic cost (EC), Oxygen pulse (PO2), accumulated oxygen deficit, oxygen debt and oxygen uptake kinetics (VO2−τ).
Using this procedure, PO2 represents the amount of O2 that can be consumed during the race and during the time of the complete cardiac cycle. EC was defined as the ratio between the oxygen consumption (mlkg−1min−1) and the running speed (mmin−1). The oxygen accumulated deficit was only measured during the first minute of every race and the oxygen debt in the three minutes after exertion. Oxygen uptake kinetics (τ) was determined by a specific elaborated program (Matlab 7.12.0.635) to determine the VO2 kinetics and calculate the values of τ (s) and VO2 in that point following the methodological criteria proposed by Joones and Poole (2005). In every protocol, we also recorded the heart rate (HR) every 5s (Polar Polar RS 800), blood lactate was measured pre and post exercise (1 and 3min) using a miniphotometer (LP-20 Bruno Lange Gmbh, Berlin, Germany) and pass frequency (video recording).
AnthropometryHeight and weight were measured. We assessed six skin-fold (triceps, subscapular, suprailiac, abdominal, midthig and calf) and percent of body fat calculates by using the formula of Yuhasz modified by Carter16: % body fat=(0.1051×sum of six skinfold)+2.585. These data were obtained by a Holtain skinfold caliper (constant pressure: 10gsq−1mm).
StatisticsThe statistics shown in this paper were calculated using the Statistical Package for Social Sciences (SPSS, v. 17.0 for WINDOWS; SPSS Inc., Chicago, IL, USA). The descriptive statistics used were the mean, standard deviation and mean error for comparing the four protocols. The groups were assessed using ANOVA for repeated measures with Bonferroni contrast test (p≤0.05). Prior to the comparisons, normality tests (Shapiro–Wilks) and homogeneity tests (Levene test) were performed. The values are reported as the mean ±SD and values p≤0.05 were considered significant.
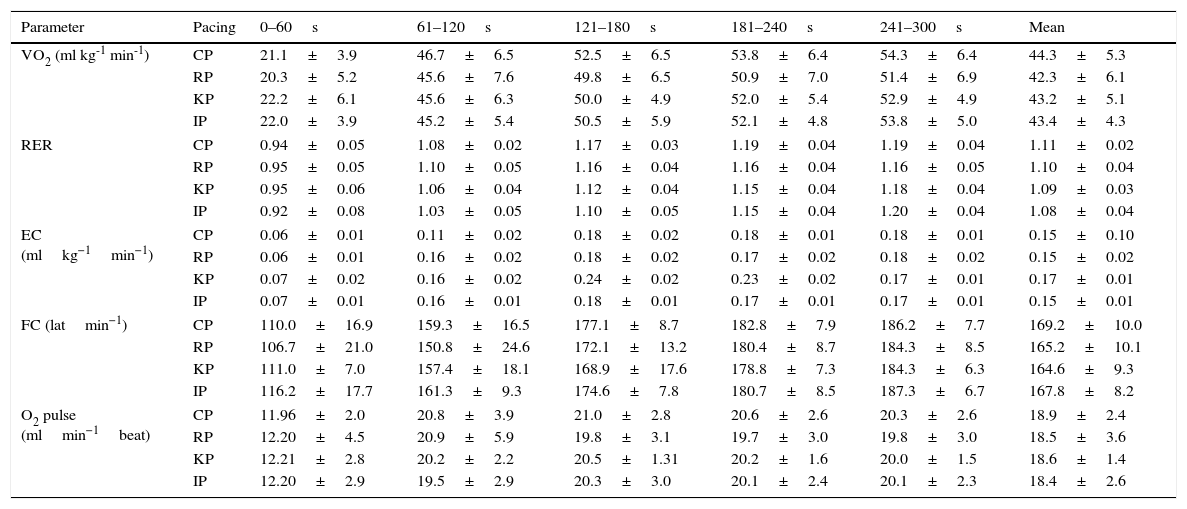
ResultsThe physiological variables (cardio-respiratory parameters) measured during the tour treadmill test are listed in Table 3. It is highlighted that not all of our subjects reached their maximal VO2 values and they did not show statistically significant differences in any of the race phase or in the different evaluated protocols. The biggest differences found in this parameter were observed in the intermediate race phase (2°–4°min) when comparing CP with RP (2.4%–5.4%–5.4%–5.3%), KP (2.4%–5.1%–3.3%–2.6%) and IP (3.2%–3.8%–3.2%–0.9%. There were no significant differences found in the PO2 and FC values.
Evolution, minute by minute, of the physiological parameters (VO2, RER, EE, FC and PO2) during a 5-min duration treadmill race using the different pacing strategies at a high intensity not maximal.
| Parameter | Pacing | 0–60s | 61–120s | 121–180s | 181–240s | 241–300s | Mean |
|---|---|---|---|---|---|---|---|
| VO2 (ml kg-1 min-1) | CP | 21.1±3.9 | 46.7±6.5 | 52.5±6.5 | 53.8±6.4 | 54.3±6.4 | 44.3±5.3 |
| RP | 20.3±5.2 | 45.6±7.6 | 49.8±6.5 | 50.9±7.0 | 51.4±6.9 | 42.3±6.1 | |
| KP | 22.2±6.1 | 45.6±6.3 | 50.0±4.9 | 52.0±5.4 | 52.9±4.9 | 43.2±5.1 | |
| IP | 22.0±3.9 | 45.2±5.4 | 50.5±5.9 | 52.1±4.8 | 53.8±5.0 | 43.4±4.3 | |
| RER | CP | 0.94±0.05 | 1.08±0.02 | 1.17±0.03 | 1.19±0.04 | 1.19±0.04 | 1.11±0.02 |
| RP | 0.95±0.05 | 1.10±0.05 | 1.16±0.04 | 1.16±0.04 | 1.16±0.05 | 1.10±0.04 | |
| KP | 0.95±0.06 | 1.06±0.04 | 1.12±0.04 | 1.15±0.04 | 1.18±0.04 | 1.09±0.03 | |
| IP | 0.92±0.08 | 1.03±0.05 | 1.10±0.05 | 1.15±0.04 | 1.20±0.04 | 1.08±0.04 | |
| EC (mlkg−1min−1) | CP | 0.06±0.01 | 0.11±0.02 | 0.18±0.02 | 0.18±0.01 | 0.18±0.01 | 0.15±0.10 |
| RP | 0.06±0.01 | 0.16±0.02 | 0.18±0.02 | 0.17±0.02 | 0.18±0.02 | 0.15±0.02 | |
| KP | 0.07±0.02 | 0.16±0.02 | 0.24±0.02 | 0.23±0.02 | 0.17±0.01 | 0.17±0.01 | |
| IP | 0.07±0.01 | 0.16±0.01 | 0.18±0.01 | 0.17±0.01 | 0.17±0.01 | 0.15±0.01 | |
| FC (latmin−1) | CP | 110.0±16.9 | 159.3±16.5 | 177.1±8.7 | 182.8±7.9 | 186.2±7.7 | 169.2±10.0 |
| RP | 106.7±21.0 | 150.8±24.6 | 172.1±13.2 | 180.4±8.7 | 184.3±8.5 | 165.2±10.1 | |
| KP | 111.0±7.0 | 157.4±18.1 | 168.9±17.6 | 178.8±7.3 | 184.3±6.3 | 164.6±9.3 | |
| IP | 116.2±17.7 | 161.3±9.3 | 174.6±7.8 | 180.7±8.5 | 187.3±6.7 | 167.8±8.2 | |
| O2 pulse (mlmin−1beat) | CP | 11.96±2.0 | 20.8±3.9 | 21.0±2.8 | 20.6±2.6 | 20.3±2.6 | 18.9±2.4 |
| RP | 12.20±4.5 | 20.9±5.9 | 19.8±3.1 | 19.7±3.0 | 19.8±3.0 | 18.5±3.6 | |
| KP | 12.21±2.8 | 20.2±2.2 | 20.5±1.31 | 20.2±1.6 | 20.0±1.5 | 18.6±1.4 | |
| IP | 12.20±2.9 | 19.5±2.9 | 20.3±3.0 | 20.1±2.4 | 20.1±2.3 | 18.4±2.6 | |
We found statistically significant differences in the energetic efficiency among the following protocols: CP vs. KP (p=0.012; IC95: 0.034–0.004; ES: 1.45), RP vs. KP (p=0.040; IC95: 0.040–0.008; ES: 1.65) and TP vs. IP (p=0.003; IC95: 0.009–0.004; ES: 2.04) (Table 3). When performing the analysis by partials (1-min duration phases), significant differences were observed in the energetic efficiency during the 3rd-min among CP vs. KP (p=0.000; IC95: 0.75–0.42; ES: 4.15), RP vs. KP (p=0.000; IC95: 0.77–0.42; ES: 3.55) and KP vs. IP (p=0.006; IC95: 0.80–0.38; ES: 3.95).
These differences were expanded to the 4th-min when comparing CP vs. IP (p=0.005; IC95: 0.005–0.024; ES: 1.12), CP vs. KP (p=0.000; IC95: 0.067–0.028; ES: 2.89) and CP vs. KP (p=0.000; IC95: 0.067–0.028; ES: 2.89), KP vs. RP (p=0.005; IC95: 0.074–0.040; ES: 3.24) KP vs. IP (p=0.000; IC95: 0.045–0.078; ES: 4.41). In the last minute of the test, there were significant differences found among CP vs. KP (p=0.037; IC95: 0.001–0.031; ES: 1.26) and CP vs. IP (p=0.000; IC95: 0.010–0.028; ES: 1.95).
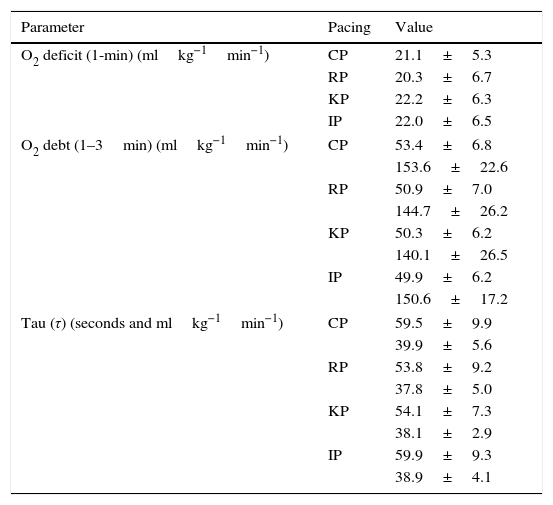
The anaerobic metabolism behavior was assessed from the ventilator parameters (accumulated oxygen deficit, oxygen debt and oxygen uptake kinetics) (Table 3) and the blood lactate concentrations in the first minutes after the exercise (Table 4). There were no significant differences found in any of the used procedures to assess the anaerobic metabolism among the protocols (Table 5).
Oxygen deficit values, during a 5-min duration treadmill using different pacing strategies at a high intensity not maximal.
| Parameter | Pacing | Value |
|---|---|---|
| O2 deficit (1-min) (mlkg−1min−1) | CP | 21.1±5.3 |
| RP | 20.3±6.7 | |
| KP | 22.2±6.3 | |
| IP | 22.0±6.5 | |
| O2 debt (1–3min) (mlkg−1min−1) | CP | 53.4±6.8 |
| 153.6±22.6 | ||
| RP | 50.9±7.0 | |
| 144.7±26.2 | ||
| KP | 50.3±6.2 | |
| 140.1±26.5 | ||
| IP | 49.9±6.2 | |
| 150.6±17.2 | ||
| Tau (τ) (seconds and mlkg−1min−1) | CP | 59.5±9.9 |
| 39.9±5.6 | ||
| RP | 53.8±9.2 | |
| 37.8±5.0 | ||
| KP | 54.1±7.3 | |
| 38.1±2.9 | ||
| IP | 59.9±9.3 | |
| 38.9±4.1 | ||
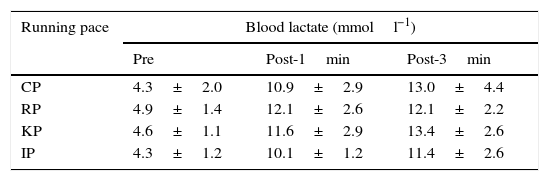
Lactic acid blood values at the end (1-min and 3-min) of a race in a 5-min duration treadmill using different pacing strategies at a high intensity not maximal.
| Running pace | Blood lactate (mmoll−1) | ||
|---|---|---|---|
| Pre | Post-1min | Post-3min | |
| CP | 4.3±2.0 | 10.9±2.9 | 13.0±4.4 |
| RP | 4.9±1.4 | 12.1±2.6 | 12.1±2.2 |
| KP | 4.6±1.1 | 11.6±2.9 | 13.4±2.6 |
| IP | 4.3±1.2 | 10.1±1.2 | 11.4±2.6 |
At the end of each race, there were blood lactate significant increases (CP: 66.9%; RP: 56.9%; KP: 65.7%; IP: 62.1%; p≤0.000). The highest lactate values were obtained three minutes after finishing the KP and CP (13.4±2.6 and 13.0±4.4mmoll−1, respectively).
Although there were apparently some high differences observed after each protocol (example: CP3′ vs. IP3′), in any case these differences were significantly different.
The race mechanics were not excessively affected by the rhythm changes of each race strategy, except for those parts of the race in which the intensity was especially high (≈110% of race intensity). The subjects showed a significant increase in the stride frequency in the last minute of the incremental protocol (IP) in comparison to the rest of the test (1-min: 2.95±0.10 p/s; 2-min: 2.96±0.11 p/s; 3-min: 2.98±0.13 p/s; 4-min: 3.05±0.12 p/s; 5-min: 3.13±0.11 p/s) and the different race protocols (CP: 3.01±0.11 p/s; RP: 3.05±0.09 p/s; TP: 3.07±0.12 p/s; IP: 3.13±0.11 p/s).
DiscussionThe main finding of the present study suggests that the main functional system answers are not significantly affected by the pacing strategy used by middle level subjects during a middle-distance running. This behavior affects the total race, as well as the five phases in which it is divided (5 phases of 1-min duration). These results findings were consistent with data provided by other similar studies.17,18
Performance in middle distance races depend on several physiological parameters19,20 and mainly of the aerobic and anaerobic energetic metabolism.17 Middle distance running elicits aerobic metabolism to its maximum power and anaerobic metabolism to its maximum capacity.21,22
An all-out 1500-m race assumes an effort at higher intensities to 1–10% than the maximal aerobic velocity (vVO2max).14,17 Consequently, to be efficient in this type of tests, the athlete needs to have a high VO2max and a low energy running cost.19 Our subjects did not always reach their maximal VO2 values during the race nor showed statistically significant differences in any phase in the different assessed protocols. The highest differences were observed in the intermediate phase of the race (2nd–4thmin) when comparing CP to RP (2.4%–5.4%–5.4%–5.3%), KP (2.4%–5.1%–3.3%–2.6%) and IP (3.2%–3.8%–3.2%–0.9%) although these differences do not assume statistically significant changes in the oxygen input system. The O2 input changes are consequence of the velocity decrease during the different race phases.
Also, there were no significant differences observed in the PO2 and HR values among the five sections of the four assessed protocols. An efficient cardio-respiratory system and aerobic metabolism implies a good lung fusion, a great ability of the heart to generate a high cardiac output, have a high blood hemoglobin rate, high muscle blow flow and muscle oxygen extraction.23
In our study, there were some differences found in the energetic efficiency along the different pacing strategies. These differences were statistically significant among the protocols CP vs. KP, RP vs. KP and TP vs. IP (Table 3). When the analysis is performed by partials (1-min duration phases) significant differences were detected in the energetic efficiency during the 3rd-min among CP vs. KP, RP vs. KP. These significant differences were expanded to the 4th-min when comparing CP vs. IP, CP vs. KP and CP vs. KP, KP vs. RP, KP vs. IP. In the last minute of the test, there were significant differences found among CP vs. KP and CP vs. IP. In human locomotion, the work intensity mainly depends on the product of the energy cost (energy needed to overcome the external resistance and the energy used in the production of external energy) and the maximal metabolic power.24
Nowadays, the importance of the anaerobic metabolism in the different strategies used during the half duration resistance tests is more controversial. There were no changes observed in the anaerobic metabolism during our study's race strategies. Also, other studies3,25 did not find that changes in the pacing strategy could intensively affect the different metabolic via participation (anaerobic and aerobic). Foster et al.3 only detected moderate changes that could have its origin in the study's methodological problems, as changes in the velocity were very low and could prevent from detecting differences in the anaerobic work.
Oxygen deficit,26 post exercise oxygen debt27 and blood lactate accumulation28 are considered as valid indicators of anaerobic energy production and did not show important differences among any of the strategies. It is well known that the higher the blood lactic acid at the end of work, the greater the oxygen debt. This response is similar to what found in other similar works when comparing blood lactate concentrations between free-pace and constant-pace runs.11,29 Although the anaerobic metabolism is determinant in these races, most of this energy is obtained via aerobic metabolism.17,30 A low aerobic metabolism efficiency accelerates the anaerobic pathway and the increase of the lactic acid rate. In our study, this could explain the significant increase of blood lactate concentration at the end of each protocol.
From a biomechanical point of view, it is important to notate that our subjects showed a significant increase in the stride length during the last minute of the incremental protocol (IP) in comparison to the rest of the test (1-min: 2.95±0.1 p/s; 2-min: 2.96±0.1 p/s; 3-min: 2.98±0.1 p/s; 4-min: 3.05±0.1 p/s; 5-min: 3.13±0.1 p/s) and the different race protocols (CP: 3.01±0.1 p/s; RP: 3.05±0.1 p/s; TP: 3.07±0.1 p/s; IP: 3.13±0.1 p/s).
The Start. In the middle-distance races, the experience shows how there is always a first part of quick departure during the first 100m of the race and a transition to even-pacing strategy. This action is necessary to reach a good record and an appropriate placement for the rest of the remainder of the race.31 In this line, Billat et al.32 found that 1500-m runners who had the longest limits at their anaerobic power in the first part of the race were those who achieved the best final performance.
However, this tactical behavior assumes important functional and metabolic responses, as shown in this study results. So, fast-starting pacing strategies imply a velocity slowing down12 and a decrease in VO2.32,33
For half a century, it has been well known that the VO2 kinetics shows a faster adaptation when the exercise initial intensity is very high.14,18 This response of the oxygen delivery system is accompanied by a rapid fall in the adenine nucleotide pool34 and an increase of the anaerobic lactic pathway.35 It also stimulates the system of resynthesis of the ATP by the oxidative process. The initial acceleration improves the mean power output and VO2 during the first 45s and generates a greater breakdown of the athletes’ creatine phosphate supplies respect to a paced strategy.36
However, from a metabolic point of view, an excessive fast start can be counterproductive. In fact, too high intensity anaerobic pathway activation from the beginning of the test can condition the race velocity37 and, as shown by some authors, it can be a factor that drives the athlete to regulate and adjust inappropriately the race rhythm.4
Mid race. Once the athlete finds the appropriate position during the race, usually tries to stabilize the rhythm to the test interests. Except for special race circumstances (e.g. hare atypical strategies), what is common is that the athletes perform mid race at a lower intensity to the mean race velocity. This velocity fall will change its magnitude depending on the race characteristics or objective classification. A decrease around the 3rd-min could prevent the development of the VO2 slow component. In this sense, Cottin et al.11 found that, in male long-distance runners, velocity does not alter in an important way the slow component of the VO2 kinetic. Also, the blood lactate concentrations did not change in comparison with a race performed at a constant rhythm. On the opposite side, maintaining a very high intensity in this test phase assumes a maximal O2 input activation and a premature fatigue onset.38
So, maintaining a reduced race rhythm mostly always means to enable the athlete to save energy for the last phase of the race, but in middle distance running the speed must be as high as possible above the maximal aerobic power to achieve a good final performance but without depleting anaerobic stores too early and without decreasing VO2 below VO2max by an inhibition of oxidative phosphorylation with early acidosis.32 In such circumstances, the organism requires the anaerobic lactic pathway (anaerobic capacity), and increases the blood lactate concentrations progressively. This forces the anaerobic work capacity to be a determinant factor in the final test result and the early fatigue onset.32,37
The velocity reduction, in this part of the race, added to the strategy of running behind other runners are a habitual strategy to increase the race economy. Morgan et al.39 suggested that running while following 1–2m behind another runner can save up to 6% or 3% of energy, respectively.
Finishing kick. Robinson et al.40 reported that when athletes ran the first 800-m of a 1200-m treadmill test slower than even-pace followed by a near maximal final 400-m, they showed lower blood lactate and oxygen debt rates in comparison to those when using a fast-start and even pacing strategy.
When the final race section is analyzed under high level fatigue situations, the O2 input system can be negatively affected. Hanon et al.14 observed a significant VO2 decrease at the end of the 1500-m race without affecting the race velocity. The authors explain these VO2 decreases by referring to mechanisms assessed in other studies: respiratory fatigue, changes in cardiac output and oxygen arterial-venous difference and decrease in arterial hemoglobin saturation. A positive correlation between the VO2 decrease magnitude and blood lactate concentration, suggesting that this phenomenon is due to the high glycolytic contribution and therefore to a high level of fatigue, that can be demonstrated in a stride amplitude decrease and an increase in frequency, trying to maintain the velocity.
In our case, the subjects showed an increase in the VO2 values at the end of the test in the RP and KP protocols, but they showed a decrease in CP and IP. We must take into consideration that the race intensity was not 100% intensity, as it was slightly lower. At the 90% of de velocity associated to VO2max the oxygen consumption continues to increase with the time, as a consequence of a VO2 slow component.
The accumulated fatigue at the end of the test can also affect the race mechanics and the finishing pick. In this sense, Hanon et al.41 detected, during treadmill running tests to exhaustion, a decrease in stride length. This alteration in the race mechanics can be due to a force decrease.
In conclusion, the present study suggests that the main functional systems responses (cardio-respiratory system, energetic-system and race mechanics) are significantly affected by the pacing strategy used by middle level subjects during a middle-distance running. This behavior affects the total test and the five phases in which it is divided (5 phases of 1-min duration). The highest differences were observed in the intermediate phase of the race (2nd–4thmin), although these differences do not assume statistically significant changes in the oxygen uptake system. Also, there were no important significant differences in the PO2 and HR values among the five sections of the four assessed protocols. There were significant differences found in the energetic efficiency of the different pacing strategies. These differences were statistically significant among the protocols CP vs. KP, RP vs. KP and TP vs. IP
Conflicts of interestThe authors have no conflicts of interest to declare.
