


To analyze the initial findings in chest X-rays of patients with RT-PCR positive for SARS-CoV-2, and to determine whether there is a relationship between the severity of these findings and the clinical and laboratory findings.
Materials and methodsThis retrospective study analyzed the relationship between initial chest X-rays and initial laboratory tests in symptomatic adults with nasopharyngeal RT-PCR results positive for SARS-CoV-2 seen at our center between February 29 and March 23, 2020. Among other radiologic findings, we analyzed ground-glass opacities, consolidations, linear opacities, and pleural effusion. We also used a scale of radiologic severity to assess the distribution and extent of these findings. Among initial laboratory findings, we analyzed leukocytes, lymphocytes, platelets, neutrophil-to-lymphocyte ratio, and C-reactive protein.
ResultsOf 761 symptomatic patients, 639 (84%) required hospitalization and 122 were discharged to their homes. The need for admission increased with increasing scores on the scale of radiologic severity. The extent of initial lung involvement was significantly associated with the laboratory parameters analyzed (P<.05 for platelets, P<.01 for lymphocytes, and P<.001 for the remaining parameters), as well as with the time from the onset of symptoms (P<.001).
ConclusionIt can be useful to use a scale of radiologic severity to classify chest X-ray findings in diagnosing patients with COVID-19, because the greater the radiologic severity, the greater the need for hospitalization and the greater the alteration in laboratory parameters.
Analizar los hallazgos radiológicos iniciales en las radiografías de tórax de pacientes con RT-PCR positiva para SARS-CoV-2 y valorar si existe una relación entre la graduación de los mismos y los datos clínicos y analíticos.
Materiales y métodosEstudio retrospectivo donde se analizaron las radiografías de tórax iniciales de pacientes adultos sintomáticos entre el 29 de febrero y el 23 de marzo de 2020 con una prueba RT-PCR nasofaríngea positiva para SARS-CoV-2 y una analítica inicial que incluía: leucocitos, linfocitos, plaquetas, cociente linfocitos/leucocitos y PCR. Entre otros hallazgos radiológicos se valoraron: opacidades en vidrio deslustrado, consolidaciones, opacidades lineales y derrame pleural. También la distribución y la extensión de estos hallazgos mediante un índice de gravedad radiográfico.
ResultadosDe 761 pacientes sintomáticos, 639 precisaron ingreso hospitalario (84%) y 122 fueron dados de alta con aislamiento domiciliario. La necesidad de ingreso fue mayor cuanto más alto el índice de gravedad radiográfico. Existió una relación estadísticamente significativa entre la extensión de la afectación pulmonar inicial y los parámetros analíticos estudiados (P<,05 para plaquetas, P<,01 para linfocitos y P<,001 para el resto), así como con los días de evolución desde el inicio de los síntomas (P<,001).
ConclusiónLa graduación de los hallazgos radiológicos al diagnóstico y su relación con los datos analíticos podría ser útil a la hora de valorar la evolución de pacientes con COVID-19, pues a mayor índice de gravedad radiográfico, mayor incidencia de ingreso hospitalario y parámetros analíticos más alterados.
On 31 December 2019, a number of cases of a form of pneumonia of unknown aetiology detected in Wuhan, China, were reported to the World Health Organization (WHO). The causative agent of this pneumonia was identified as a novel virus belonging to the family Coronaviridae; it was subsequently named SARS-CoV-2 (severe acute respiratory syndrome coronavirus 2). The disease associated with this virus was has been termed COVID-19 (COrona VIrus Disease-2019). The WHO declared COVID-19 a public health emergency of international concern on 30 January 2020 and a pandemic on 12 March 2020.1,2 To date (18 December 2020), 1,797,236 confirmed cases and 48,926 deaths have been reported in Spain.3
The clinical spectrum of COVID-19 ranges from asymptomatic forms to severe forms with adult respiratory distress syndrome and death. The most commonly reported clinical signs are fever, cough, muscle pain, headache and shortness of breath.4 Severe or fatal disease is more common in admitted patients.5
Most initial radiology publications on COVID-19 focused on findings in computed tomography (CT) of the chest, since China started using this technique as a first-line option given its high sensitivity.6 The American College of Radiology (ACR), the Society of Thoracic Radiology (STR) and American Society of Emergency Radiology (ASER) subsequently discouraged systematic use of CT of the chest as a screening technique or as a first-line option in the diagnosis of patients with suspected COVID-19.7 A meta-analysis by Kim et al. confirmed that, outside of China, where there is a low prevalence of COVID-19 (1%–22.9%), CT of the chest in patients with clinically suspected COVID-19 had a low positive predictive value (1.5%–30.7%).8 In another more recent meta-analysis, Xu et al. concluded that, in general, CT of the chest had good sensitivity for detecting COVID-19 pneumonia, especially in regions with severe outbreaks, and it was useful for detecting suspicious cases in early stages. Its sensitivity, on the other hand, was relatively low (25%–33%).9
Chest X-ray is less sensitive than CT and therefore may be normal in early stages of COVID-19, but it is a useful, fast, widely available and easy-to-perform technique. In most cases, it has been the only diagnostic imaging technique performed in these patients.7 However, chest X-ray has wide interobserver variability. To attempt to mitigate this variability, different objective methods of assessing the extent and severity of lung involvement have been used. For example, the Radiographic Assessment of Lung Edema (RALE) score was useful for measuring the extent of adult respiratory distress syndrome.10 More recently, different scoring systems, both for CT and for chest X-ray, that measure lung involvement in patients with COVID-19 have also been used.11–16
To date, very few studies linking measurements of severity of chest X-ray findings to laboratory findings have been published.12,17 The main laboratory findings that have linked the severity of COVID-19 pneumonia and the clinical course of patients have been increased C-reactive protein (CRP), increased D-dimer, increased lactate dehydrogenase (LDH) and lymphopenia.18
The objective of this study was to determine whether there is a relationship between, on the one hand, findings on chest X-ray and measurement of their severity and, on the other hand, laboratory findings at the time of diagnosis and time elapsed since the onset of symptoms.
Material and methodsA descriptive, cross-sectional, retrospective, single-centre study was conducted. This study was approved by the Independent Ethics Committee at our hospital.
Study populationSymptomatic adult patients seen at our hospital between 29 February and 23 March 2020, with a positive nasopharyngeal reverse transcription-polymerase chain reaction (RT-PCR) test for SARS-CoV-2, a chest X-ray and blood testing at diagnosis were consecutively included.
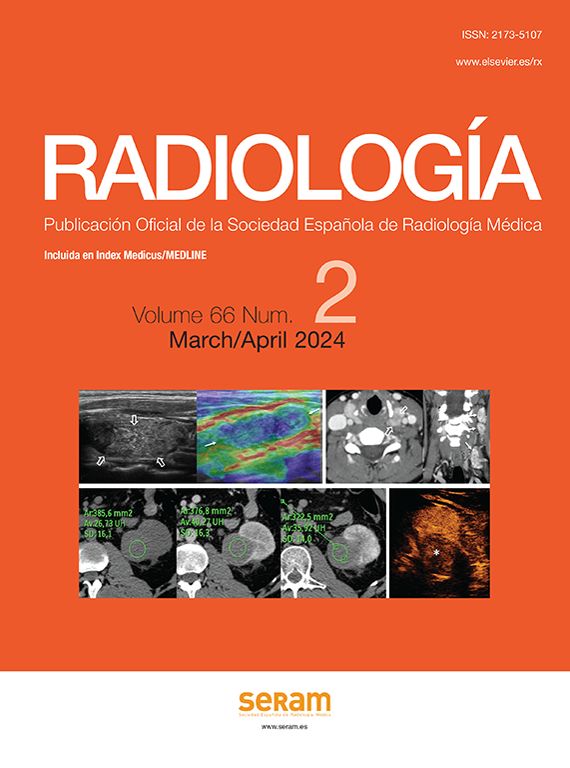
Patients were excluded if they had a positive RT-PCR test but no chest X-ray at diagnosis, no initial laboratory testing and/or initial laboratory testing that did not include any of the five following values: leukocyte count, lymphocyte count, platelet count, lymphocyte-to-leukocyte ratio or CRP (Fig. 1).

Of the 1165 initial patients, four patients under 18 years of age were excluded. Another 165 patients were excluded because they did not have a chest X-ray taken at the onset of their disease, and 116 more patients were excluded as they did not have initial blood testing done. Finally, of the 880 remaining patients, 119 lacked laboratory testing corresponding to all five values required for inclusion in this study: leukocyte count, lymphocyte count, platelet count, lymphocyte-to-leukocyte ratio and CRP.
All data were collected from the patients' medical records.
Primary endpointsThe primary endpoints were radiological findings on the initial chest X-ray, measurement of their extent (X-ray severity score) and correlation thereof with initial laboratory findings.
The following findings on the chest X-rays were assessed: ground-glass opacities, consolidations, linear opacities, pleural effusion, lymphadenopathy, pulmonary fibrosis due to prior lung disease, emphysema and nodules/masses. The Fleischner Society criteria for defining radiological findings were followed.19 In cases in which ground-glass opacities or lung consolidations were present, data on their distribution — central (in the inner two thirds of the lung), peripheral (in the outer third) or diffuse (with involvement of both) — was collected. In addition, those lung fields that were affected (upper, middle or lower in each lung) and whether lesions were unilateral or bilateral were determined.
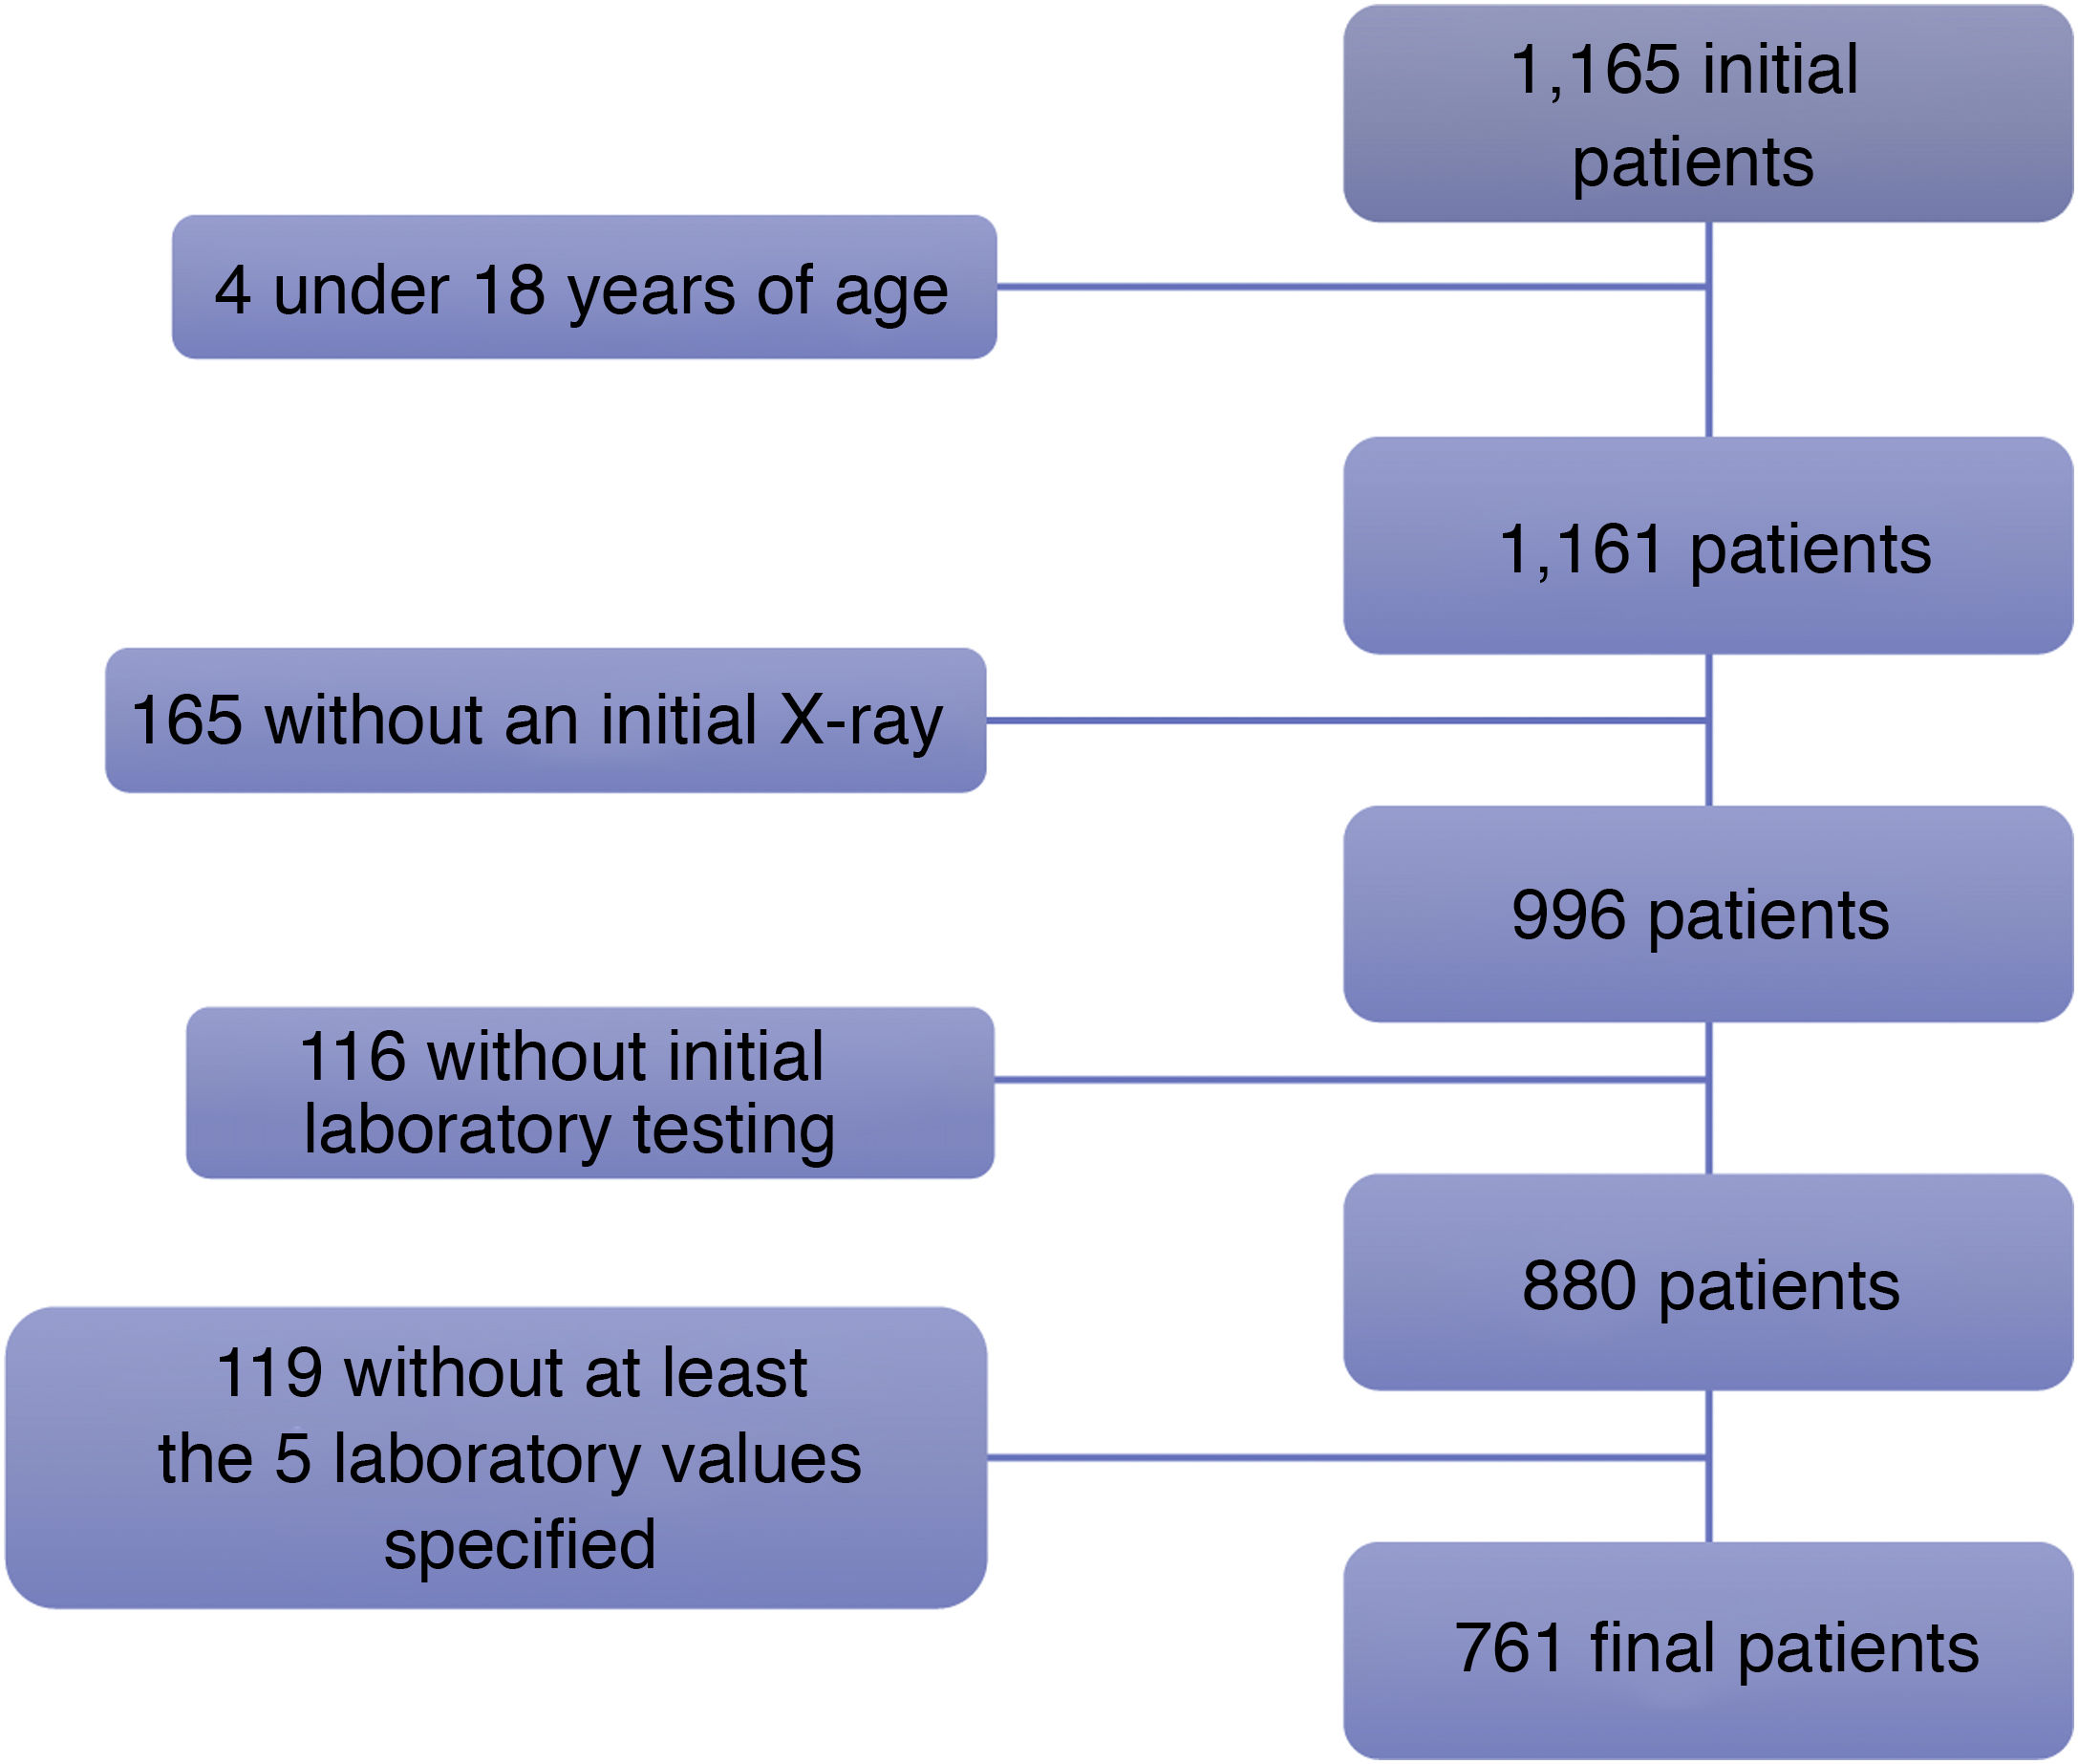
In order to grade the extent of lung involvement (X-ray severity score), each lung was divided into three fields separated by two horizontal lines: an upper line at the lower edge of the aortic arch and a lower line at the height of the pulmonary veins13,15 (Fig. 2). Extent of lung involvement was measured by adding up the score in each lung field (0=normal and 1=featuring involvement), yielding an overall score for both lungs of 0–6.
 Upper fields. C and D) Middle fields. E and F) Lower fields.")
Chest X-ray with lung division into six fields used in our study to assess distribution of X-ray findings. The upper horizontal line is at the lower edge of the aortic arch and the lower horizontal line is at the height of the inferior pulmonary veins. A and B) Upper fields. C and D) Middle fields. E and F) Lower fields.
Regarding the initial laboratory data corresponding to the first chest X-ray, the following were collected: leukocyte count, lymphocyte count and percentage, platelet count, CRP, D-dimer, lactate dehydrogenase (LDH), ferritin and creatine kinase (CK). The time elapsed between blood testing and chest X-ray never exceeded 24h.
Independent variablesThe anthropometric and demographic data that were collected were sex, age, weight and body mass index (BMI). BMI was divided into six categories: underweight (<18.5), normal weight (18.5–24.9), overweight (25–29.9), class 1 obesity (30–34.9), class 2 obesity (35–39.9) and morbid obesity (40–49.9).
The clinical data that were included were: patient origin (accident and emergency department or elsewhere), symptoms presented (fever, cough, shortness of breath, chest pain, gastrointestinal symptoms, syncope and other) and date of onset, need for admission in the first 30 days (yes or no), number of days of admission, prolonged admission (more than 30 days) and date of entering and exiting the hospital.
The dates of all the RT-PCR tests performed and the time elapsed from a positive RT-PCR test to a chest X-ray were collected.
Analysis of imaging and acquisition of informationTwo second- and third-year diagnostic imaging residents (SGP and ANM, respectively) reviewed all reports corresponding to chest X-rays in systems with IMPAX 6.5.33 (Agfa-Gevaert N.V.). In cases in which no radiology report was available and uncertain cases, the residents consulted with two expert thoracic radiologists with 16 and 26 years of experience (BCM and ABGC, respectively); uncertainties were resolved by consensus.
Statistical analysisQualitative variables are presented with their frequency distribution. Quantitative variables are summarised with their mean and standard deviation (SD). Quantitative variables showing an asymmetrical distribution are summarised with their median and interquartile range (IQR). The distribution of continuous variables was evaluated by means of graphical inspection of histograms, box plots and Q–Q plots.
X-ray severity score was analysed as a categorical variable. For quantitative variables, means were compared using analysis of variance (ANOVA) or the Kruskall–Wallis test where quantitative variables did not have a normal distribution. The ordinal relationship between laboratory values and X-ray severity scores was evaluated using the Jonckheere–Terpstra non-parametric test. Qualitative variables were compared using the χ2 test or Fisher's exact test where required. A level of significance of 5% was accepted for all tests. Data processing and analysis were performed using the SPSS Statistics V21.0 software package.
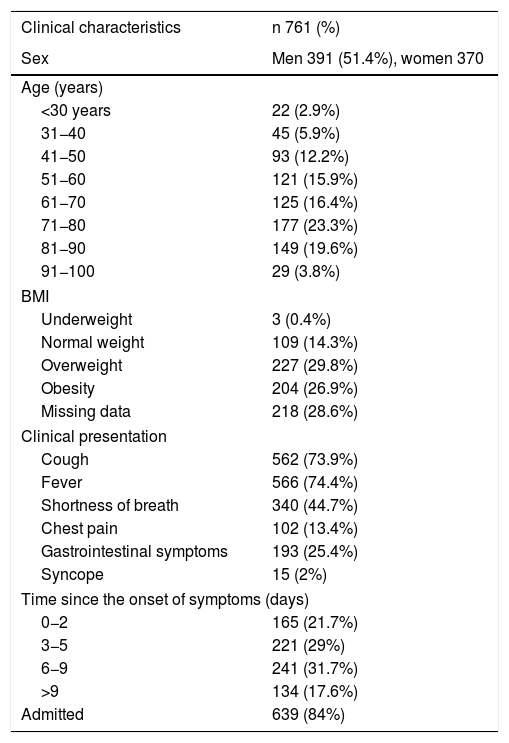
ResultsDescriptive analysisOf the total of 1165 consecutive patients with a positive RT-PCR test for SARS-CoV-2 seen at our hospital between 29 February and 23 March 2020, 761 symptomatic adult patients comprised our study population (Fig. 1): 370 women and 391 men with a mean age of 65.8±17.1 years. Regarding BMI, 0.4% of patients were underweight, 14.3% were normal weight, 29.8% were overweight and 26.9% were obese. Some data required to calculate BMI were not available for 218 (28.6%) patients (Table 1).
Epidemiological and clinical characteristics of the patients.
| Clinical characteristics | n 761 (%) |
|---|---|
| Sex | Men 391 (51.4%), women 370 |
| Age (years) | |
| <30 years | 22 (2.9%) |
| 31−40 | 45 (5.9%) |
| 41−50 | 93 (12.2%) |
| 51−60 | 121 (15.9%) |
| 61−70 | 125 (16.4%) |
| 71−80 | 177 (23.3%) |
| 81−90 | 149 (19.6%) |
| 91−100 | 29 (3.8%) |
| BMI | |
| Underweight | 3 (0.4%) |
| Normal weight | 109 (14.3%) |
| Overweight | 227 (29.8%) |
| Obesity | 204 (26.9%) |
| Missing data | 218 (28.6%) |
| Clinical presentation | |
| Cough | 562 (73.9%) |
| Fever | 566 (74.4%) |
| Shortness of breath | 340 (44.7%) |
| Chest pain | 102 (13.4%) |
| Gastrointestinal symptoms | 193 (25.4%) |
| Syncope | 15 (2%) |
| Time since the onset of symptoms (days) | |
| 0−2 | 165 (21.7%) |
| 3−5 | 221 (29%) |
| 6−9 | 241 (31.7%) |
| >9 | 134 (17.6%) |
| Admitted | 639 (84%) |
In total, 97.2% of the patients went to the accident and emergency department with symptoms, 14 patients contracted COVID-19 during ward admission and seven contracted the disease during intensive care unit admission.
Fever was seen in 74.4% of the 761 patients, cough in 73.9%, shortness of breath in 44.7%, gastrointestinal symptoms in 25.4%, chest pain in 13.4% and syncope in 2%. The time elapsed between onset of symptoms and medical consultation was 0−2 days in 165 patients (21.7%), 3−5 days in 221 (29%), 6−9 days in 241 patients (31.7%) and more than 9 days in 134 (17.6%) (Table 1).
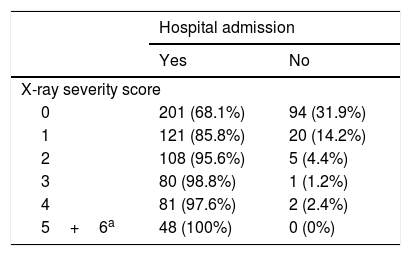
Of the 761 patients, 639 required hospital admission (84%) whereas 122 were discharged to isolate at home. The higher the X-ray severity score, the greater the need for admission (Table 2).
Frequency of hospital admission by X-ray severity score.
| Hospital admission | ||
|---|---|---|
| Yes | No | |
| X-ray severity score | ||
| 0 | 201 (68.1%) | 94 (31.9%) |
| 1 | 121 (85.8%) | 20 (14.2%) |
| 2 | 108 (95.6%) | 5 (4.4%) |
| 3 | 80 (98.8%) | 1 (1.2%) |
| 4 | 81 (97.6%) | 2 (2.4%) |
| 5+6a | 48 (100%) | 0 (0%) |
A total of 368 chest X-rays (48.4%) were taken with the patient standing (posteroanterior and lateral views) and 393 chest X-rays (51.6%) were taken in an anteroposterior view, of which 361 (91.8%) were portable X-rays.
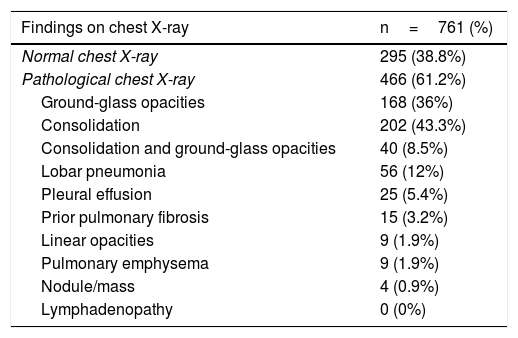
Of the 761 patients studied, 295 (38.8%) had a normal chest X-ray at diagnosis and 466 (61.2%) had pathological findings. Among the pathological X-rays, 168 (36%) showed increased density in the form of ground-glass opacities, while 202 showed lung consolidation (43.3%). Ground-glass opacities and lung consolidation were seen in 40 patients (8.5%), and lobar pneumonia was seen in 56 (12%) patients. Other less common findings were pleural effusion in 25 cases (5.4%), pulmonary fibrosis due to prior disease in 15 patients (3.2%), linear opacities in nine patients (1.9%), pulmonary emphysema in another nine cases (1.9%) and pulmonary nodules or masses in four cases (0.9%). Lymphadenopathy was not identified in any patient (Table 3).
Findings on chest X-ray and X-ray severity score.
| Findings on chest X-ray | n=761 (%) |
|---|---|
| Normal chest X-ray | 295 (38.8%) |
| Pathological chest X-ray | 466 (61.2%) |
| Ground-glass opacities | 168 (36%) |
| Consolidation | 202 (43.3%) |
| Consolidation and ground-glass opacities | 40 (8.5%) |
| Lobar pneumonia | 56 (12%) |
| Pleural effusion | 25 (5.4%) |
| Prior pulmonary fibrosis | 15 (3.2%) |
| Linear opacities | 9 (1.9%) |
| Pulmonary emphysema | 9 (1.9%) |
| Nodule/mass | 4 (0.9%) |
| Lymphadenopathy | 0 (0%) |
| Distribution by fields | n=466 (%) | |
|---|---|---|
| Left | Right | |
| Upper | 57 (12.2%) | 95 (20.4%) |
| Middle | 259 (57.5%) | 263 (56.4%) |
| Lower | 259 (55.6%) | 260 (55.8%) |
| Involvement | n=466 (%) | |
| Unilateral involvement | 175 (37.6%) | |
| Bilateral involvement | 291 (62.4%) | |
| Distribution | n=466 (%) | |
| Peripheral distribution | 417 (89.5%) | |
| Central distribution | 4 (0.9%) | |
| Diffuse distribution | 45 (9.7%) | |
| X-ray severity score | n=466 (%) | |
| 1 | 141 (30.3%) | |
| 2 | 113 (24.2%) | |
| 3 | 81 (17.4%) | |
| 4 | 83 (17.8%) | |
| 5 | 28 (6%) | |
| 6 | 20 (4.3%) |
Regarding the distribution of the chest X-ray findings, a peripheral distribution and bilateral involvement predominated: 417 cases (89.5%) showed a peripheral location; 45 cases (9.7%) showed a diffuse location, both central and peripheral; and four of 466 cases showed a central distribution (0.9%). Unilateral involvement was seen in 175 (37.6%) patients, whereas 291 had involvement in both lungs (62.4%) (Table 3).
The most commonly involved lung fields were the middle and lower fields: the right middle lung field in 56.4%, the right lower lung field in 55.8%; the left middle lung field in 57.5% and the left lower lung field in 55.6%. Involvement of the right upper lung field was found in 20.4% of cases, while involvement of the left upper lung field was found in 12.2% (Table 3).
Measurement of severity of lung involvementOf the 761 patients, 295 (38.8%) patients showed no initial involvement on X-ray (X-ray severity score 0); 141 (18.5%) patients had a score of 1; 113 (14.8%) patients had a score of 2; and 81 (10.6%) patients had a score of 3. Among the 131 remaining patients, the score was 4 for 83 (10.9%) patients, 5 for 28 patients (3.7%) and 6 for 20 patients (2.6%) (Table 3).
There were no statistically significant differences in X-ray severity score either by sex or by age group; however, there were such differences by BMI (P<.001), as BMI was higher in patients with a high X-ray severity score than in patients with a low X-ray severity score.
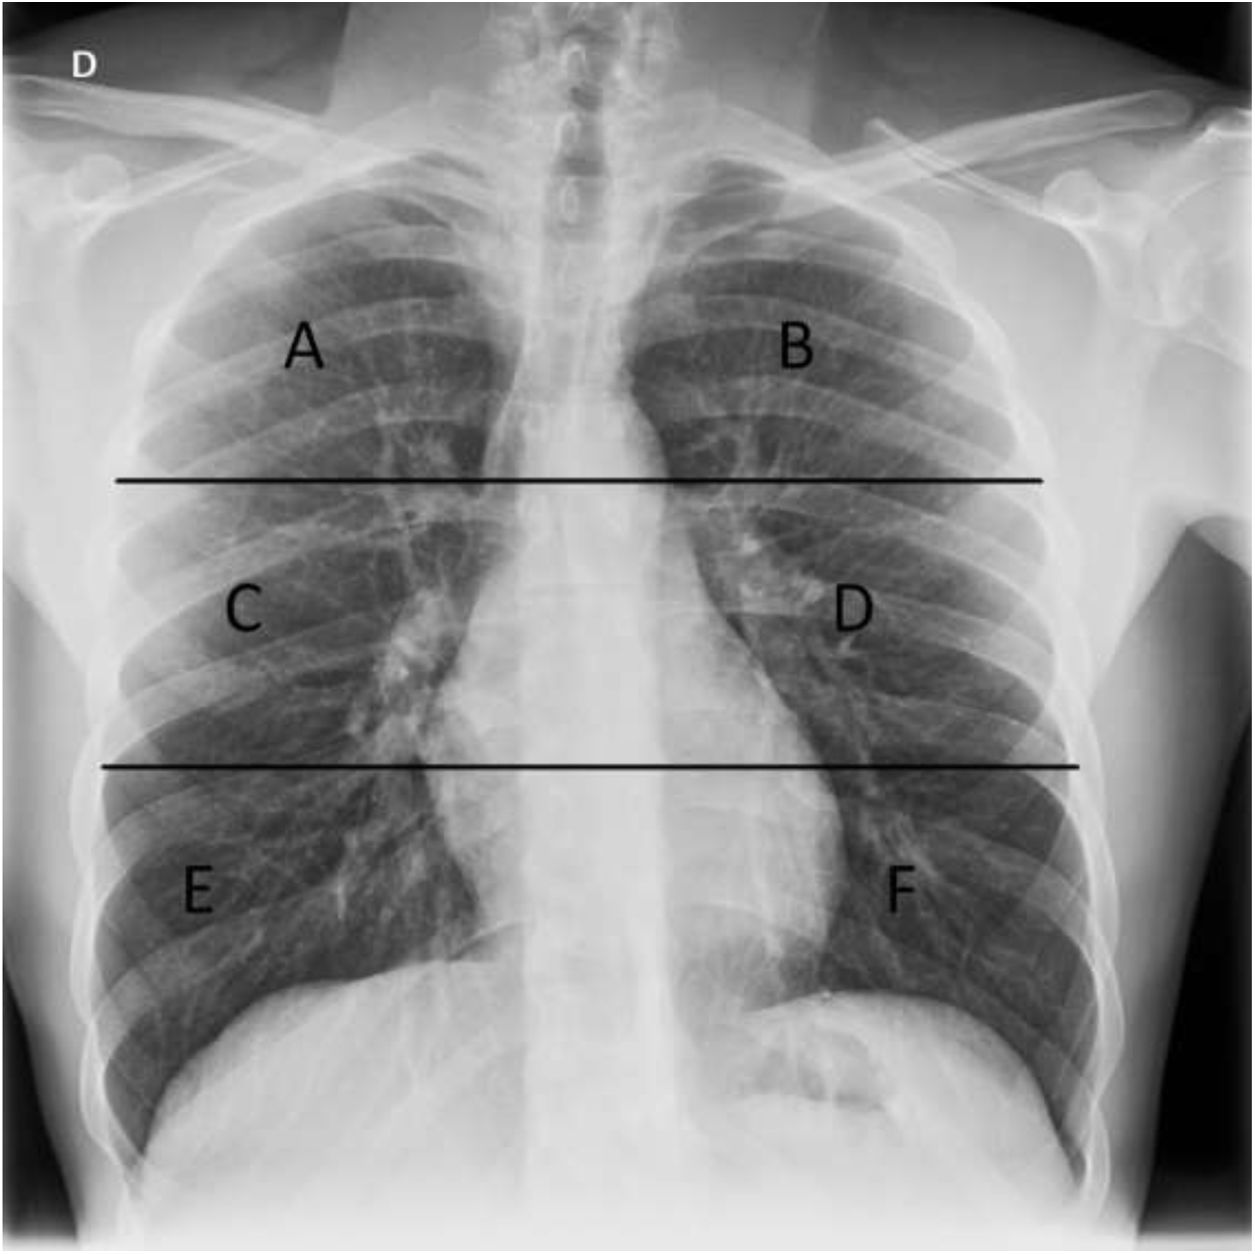
A statistically significant direct relationship was found between days elapsed since the onset of symptoms and X-ray severity score (P<.001). In patients with symptoms with an onset 0−2 days earlier, no findings were encountered in 59.4% of cases; this percentage progressively decreased to 24.6% in patients with symptoms with an onset 9 or more days earlier (Fig. 3).
. The y-axis represents the percentage of patients with a particular time since the onset of symptoms within each severity score.")
Percentage relationship between days elapsed since the onset of symptoms and X-ray severity score. The x-axis represents each X-ray severity score (scores 5 and 6 were combined due to limited numbers of patients). The y-axis represents the percentage of patients with a particular time since the onset of symptoms within each severity score.
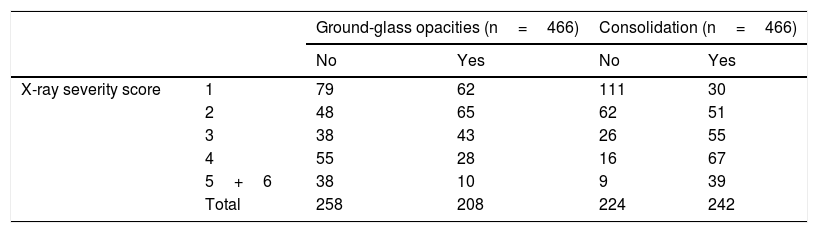
Of the total of 466 X-rays with findings (61.2%), the frequency of ground-glass opacities was higher in low X-ray severity scores and decreased as those scores increased (P<.001), whereas the opposite happened with lung consolidation, which became more common as severity scores increased (P<.001) (Fig. 4 and Table 4).
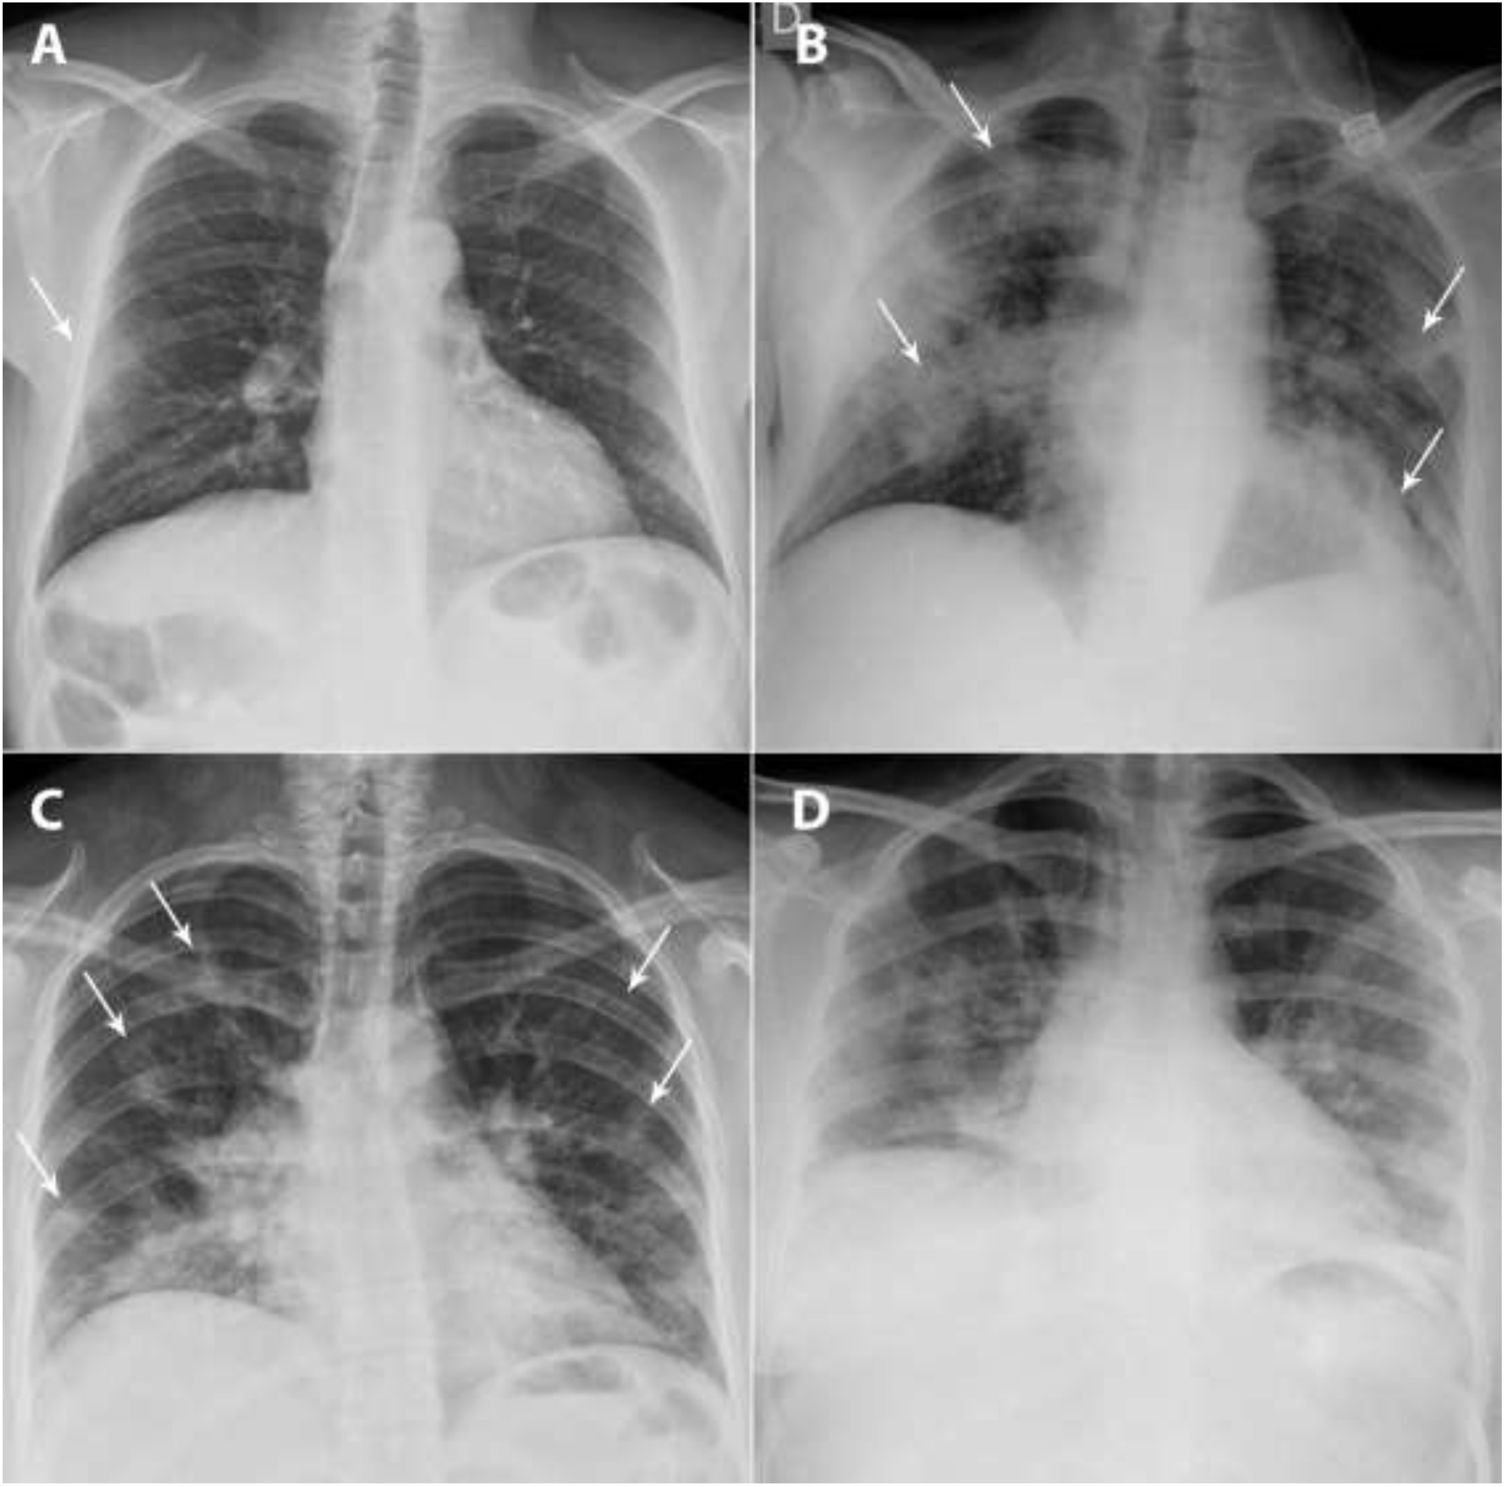
 A 49-year-old man, a former smoker who quit smoking five years earlier, had a history of hypertension, dyslipidaemia, hypertensive cardiomyopathy, hyperuricaemia, kidney transplantation and total thyroidectomy due to papillary thyroid carcinoma. He came in with fever, dry cough and muscle pain for the past four days. Laboratory data: leukocytes 7100/μl, lymphocytes 600/μl (lymphocyte-to-leukocyte ratio 7.7%), platelets 140,000/μl, CRP 1.63mg/dl, D-dimer 754ng/mL and LDH 471 U/l. A posteroanterior chest X-ray taken on 16 March 2020 showed a peripheral ground-glass opacity in the right middle field (X-ray severity score=1) (arrow). The patient was admitted, and a chest X-ray taken on 24 March 2020 showed clear radiological worsening with more extensive bilateral lung consolidations (arrows) associated with an increased need for oxygen therapy. C and D) A 33-year-old woman from Guatemala with no personal history of note visited the accident and emergency department with a referral from her primary care doctor due to cough and fever for the past nine days. Blood testing: leukocytes 5100/μl, lymphocytes 1400/μl (lymphocyte-to-leukocyte ratio 27.9%), platelets 224,000/μl, CRP 8.44mg/dl, D-dimer 500ng/mL and LDH 666 U/l. A posteroanterior chest X-ray taken on 17 March 2020 identified patchy bilateral lung consolidations predominantly in the lower lobes (score=5) (arrows). The patient was admitted, and two days later, she showed worsening of signs and symptoms as well as laboratory values; a chest X-ray taken on 23 March showed radiological worsening, with confluence of her prior consolidations.")
A and B) A 49-year-old man, a former smoker who quit smoking five years earlier, had a history of hypertension, dyslipidaemia, hypertensive cardiomyopathy, hyperuricaemia, kidney transplantation and total thyroidectomy due to papillary thyroid carcinoma. He came in with fever, dry cough and muscle pain for the past four days. Laboratory data: leukocytes 7100/μl, lymphocytes 600/μl (lymphocyte-to-leukocyte ratio 7.7%), platelets 140,000/μl, CRP 1.63mg/dl, D-dimer 754ng/mL and LDH 471 U/l. A posteroanterior chest X-ray taken on 16 March 2020 showed a peripheral ground-glass opacity in the right middle field (X-ray severity score=1) (arrow). The patient was admitted, and a chest X-ray taken on 24 March 2020 showed clear radiological worsening with more extensive bilateral lung consolidations (arrows) associated with an increased need for oxygen therapy. C and D) A 33-year-old woman from Guatemala with no personal history of note visited the accident and emergency department with a referral from her primary care doctor due to cough and fever for the past nine days. Blood testing: leukocytes 5100/μl, lymphocytes 1400/μl (lymphocyte-to-leukocyte ratio 27.9%), platelets 224,000/μl, CRP 8.44mg/dl, D-dimer 500ng/mL and LDH 666 U/l. A posteroanterior chest X-ray taken on 17 March 2020 identified patchy bilateral lung consolidations predominantly in the lower lobes (score=5) (arrows). The patient was admitted, and two days later, she showed worsening of signs and symptoms as well as laboratory values; a chest X-ray taken on 23 March showed radiological worsening, with confluence of her prior consolidations.
Incidence of ground-glass opacities and lung consolidation by X-ray severity score.
| Ground-glass opacities (n=466) | Consolidation (n=466) | ||||
|---|---|---|---|---|---|
| No | Yes | No | Yes | ||
| X-ray severity score | 1 | 79 | 62 | 111 | 30 |
| 2 | 48 | 65 | 62 | 51 | |
| 3 | 38 | 43 | 26 | 55 | |
| 4 | 55 | 28 | 16 | 67 | |
| 5+6 | 38 | 10 | 9 | 39 | |
| Total | 258 | 208 | 224 | 242 | |
Due to the limited number of patients with a high severity score, a decision was made to combine severity scores of 5 and 6 into a single category.
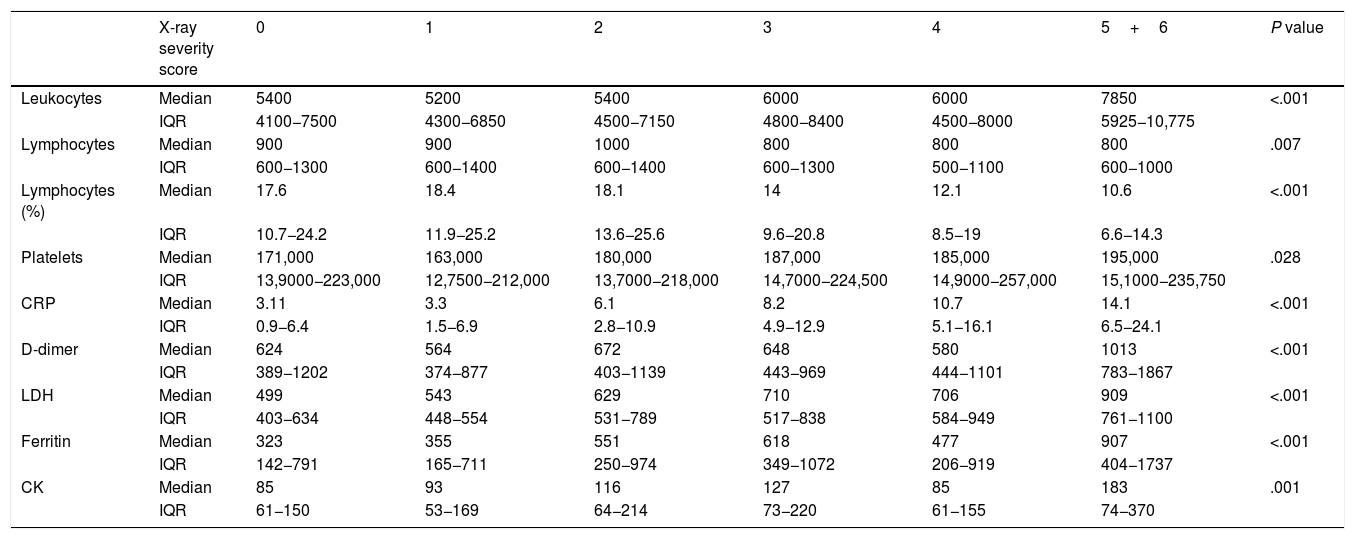
The association between the laboratory values obtained (leukocytes, lymphocytes –absolute and relative values–, platelets, CRP, D-dimer, LDH, ferritin and CK) and the X-ray severity score for lung involvement on the initial chest X-ray was statistically significant in all cases. All laboratory values increased as the X-ray severity score increased, except for two, lymphocyte count and lymphocyte-to-leukocyte ratio, which decreased as involvement on X-ray increased. Statistical significance corresponded to P<.05 for platelets, P<.01 for lymphocytes and P<.001 for all other values (Table 5).
Mean laboratory values by X-ray severity score.
| X-ray severity score | 0 | 1 | 2 | 3 | 4 | 5+6 | P value | |
|---|---|---|---|---|---|---|---|---|
| Leukocytes | Median | 5400 | 5200 | 5400 | 6000 | 6000 | 7850 | <.001 |
| IQR | 4100−7500 | 4300−6850 | 4500−7150 | 4800−8400 | 4500−8000 | 5925−10,775 | ||
| Lymphocytes | Median | 900 | 900 | 1000 | 800 | 800 | 800 | .007 |
| IQR | 600−1300 | 600−1400 | 600−1400 | 600−1300 | 500−1100 | 600−1000 | ||
| Lymphocytes (%) | Median | 17.6 | 18.4 | 18.1 | 14 | 12.1 | 10.6 | <.001 |
| IQR | 10.7−24.2 | 11.9−25.2 | 13.6−25.6 | 9.6−20.8 | 8.5−19 | 6.6−14.3 | ||
| Platelets | Median | 171,000 | 163,000 | 180,000 | 187,000 | 185,000 | 195,000 | .028 |
| IQR | 13,9000−223,000 | 12,7500−212,000 | 13,7000−218,000 | 14,7000−224,500 | 14,9000−257,000 | 15,1000−235,750 | ||
| CRP | Median | 3.11 | 3.3 | 6.1 | 8.2 | 10.7 | 14.1 | <.001 |
| IQR | 0.9−6.4 | 1.5−6.9 | 2.8−10.9 | 4.9−12.9 | 5.1−16.1 | 6.5−24.1 | ||
| D-dimer | Median | 624 | 564 | 672 | 648 | 580 | 1013 | <.001 |
| IQR | 389−1202 | 374−877 | 403−1139 | 443−969 | 444−1101 | 783−1867 | ||
| LDH | Median | 499 | 543 | 629 | 710 | 706 | 909 | <.001 |
| IQR | 403−634 | 448−554 | 531−789 | 517−838 | 584−949 | 761−1100 | ||
| Ferritin | Median | 323 | 355 | 551 | 618 | 477 | 907 | <.001 |
| IQR | 142−791 | 165−711 | 250−974 | 349−1072 | 206−919 | 404−1737 | ||
| CK | Median | 85 | 93 | 116 | 127 | 85 | 183 | .001 |
| IQR | 61−150 | 53−169 | 64−214 | 73−220 | 61−155 | 74−370 |
Due to the limited number of patients with a high severity score, a decision was made to combine severity scores of 5 and 6 into a single category.
Our study found a statistically significant relationship between the extent of involvement on the initial chest X-ray and the laboratory values studied, as well as the number of days since the onset of symptoms. The higher the X-ray severity score, the greater the need for hospital admission.
Fever and cough were the most commonly found clinical signs, followed by shortness of breath, gastrointestinal symptoms and chest pain.
In our study, 38.8% of symptomatic patients with COVID-19 had a normal chest X-ray at diagnosis and 61.2% had pathological findings; these rates were similar to those in other series, 60%–91%.15,20,21 Lung involvement was predominantly bilateral, in the lower lung fields and on the lung periphery, as reported in the medical literature.15,18,22 Consolidation was the most common finding, followed by ground-glass opacities, consistent with findings published in other series.15 Lobar pneumonia was seen in 12% of our patients. This finding usually suggests a bacterial aetiology; however, these patients had a positive PCR test and were not initially diagnosed with a bacterial infection. Pleural effusion was an uncommon finding and, in nearly all cases, secondary to another disease (history of heart failure or pre-existing chronic pleural effusion on prior chest X-rays).
Various authors have proposed scoring systems for radiological findings for both CT and chest X-ray in attempts to grade or measure the extent of lung involvement in patients with COVID-19 and link it to the clinical course of these patients. Warren et al. used the RALE score, which was useful for measuring the severity of adult respiratory distress syndrome.10 Other authors have subsequently used a modified version of this scoring system to estimate the severity of lung involvement in patients with COVID-1914–16,23,24 or have created their own measurement systems, such as that of Borghesi et al.,13 who found significantly higher X-ray severity scores (P≤.002) in patients who died. Moreover, Xiao et al. identified a statistically significant association between X-ray severity score and need for intubation.25
Older patients and patients with larger numbers of comorbidities have been reported to have more severe cases of SARS-CoV-2 pneumonia.26 Toussie et al. found that male patients, older patients and patients with higher BMIs had a higher X-ray severity scores, while Borghesi et al. observed that X-ray severity scores were significantly higher in men and patients 50–80 years of age.11,27 However, our study did not find any statistically significant differences between the X-ray severity score and the age or sex of our patients, but did find such differences with BMI (P<.001).
Our study found a significant direct linear relationship between the presence of lung consolidations on chest X-ray and a higher X-ray severity score, as well as a significant inverse linear relationship between the frequency of ground-glass opacities and lower X-ray severity scores. As in the study by Toussie et al., a significant direct relationship was also seen between days elapsed since the onset of symptoms and X-ray severity score: as the number of days increased, the score worsened.11 This was consistent with studies that have reported changes over time in pulmonary findings: ground-glass opacities are the predominant pattern at the onset of symptoms, then there is progression towards a mixed pattern of ground-glass opacification and lung consolidation with peak expression from days six to 13. Finally, ground-glass opacities become predominant once again up to resolution. A percentage of patients do not follow a favourable course and show signs of pulmonary fibrosis of variable extent.23,28,29
The main laboratory findings that have been linked to the severity of COVID-19 pneumonia and the clinical course of these patients are increased CRP (58.3%–60.7%), increased D-dimer (46.6%), increased LDH (41%–57%) and lymphopenia (43%–83.2%). Increased leukocytes, platelets and CK have also been reported.12,18,24 In fact, Gatti et al. affirmed that LDH and CRP are the main predictors of findings on chest X-ray, with a sensitivity of 90% if both are high.17 In our study, patients with more severe disease had more pronounced abnormalities than those with less severe disease, with a significant association seen between laboratory values obtained and X-ray severity score. All laboratory values increased as the X-ray severity score increased, except for two, lymphocyte count and lymphocyte-to-leukocyte ratio, which decreased as involvement on X-ray increased.
Our study had some limitations. First, as it was a retrospective study focused on the first part of the pandemic, we lacked both established protocols for radiology reports in patients with COVID-19 and definitive knowledge of which values were most useful in blood testing; consequently, there were substantial amounts of missing data, ultimately limiting the final sample size. However, the time elapsed between the chest X-ray and the blood testing at diagnosis was always less than 24h. Second, our study had the limitations inherent to the radiology technique used in execution and interpretation, in many cases magnified by the clinical condition of these patients.
In conclusion, chest X-ray is a valid technique in the initial assessment of patients with COVID-19, and its findings should be taken into account along with laboratory and clinical data when evaluating the clinical course of these patients, as a higher X-ray severity score is associated with a higher incidence of hospital admission and more abnormal laboratory values.
Authorship- 1
Responsible for study integrity: AB, BC.
- 2
Study concept: AB, BC.
- 3
Study design: AB, ÁNM, SGP.
- 4
Data collection: ÁNM, SGP, AV.
- 5
Data analysis and interpretation: MEFF.
- 6
Statistical processing: MEFF.
- 7
Literature search: AB.
- 8
Drafting of the article: ÁNM, SGP.
- 9
Critical review of the manuscript with intellectually significant contributions: AB, BC.
- 10
Approval of the final version: AB, BC.
The authors declare that they have no conflicts of interest.
Please cite this article as: Nava-Muñoz Á, Gómez-Peña S, Fuentes-Ferrer ME, Cabeza B, Victoria A, Bustos A. Neumonía COVID-19: relación entre la radiografía de tórax inicial y los datos analíticos. Radiología. 2021;63:484–494.

