


The pivotal role of chest computed tomographic (CT) to diagnosis and prognosis coronavirus disease-2019 (COVID-19) is still an open field to be explored. This study was conducted to assess the CT features in confirmed cases with COVID-19.
Materials and methodsRetrospectively, initial chest CT data of 363 confirmed cases with COVID-19 were reviewed. All subjects were stratified into three groups based on patients’ clinical outcomes; non-critical group (n=194), critical group (n=65), and death group (n=104). The detailed of CT findings were collected from patients’ medical records and then evaluated for each group. In addition, multinomial logistic regression was used to analyze risk factors according to CT findings in three groups of patients with COVID-19.
ResultsCompared with the non-critical group, mixed ground-glass opacities (GGO) and consolidation lesion, pleural effusion lesion, presence of diffuse opacity in cases, more than 2 lobes involved and opacity scores were significantly higher in the critical and death groups (P<0.05). Having more mixed GGO with consolidation, pleural effusion, lack of pure GGO, more diffuse opacity, involvement of more than 2 lobes and high opacity score identified as independent risk factors of critical and death groups.
ConclusionCT images of non-critical, critical and death groups with COVID-19 had definite characteristics. CT examination plays a vital role in managing the current COVID-19 outbreak, for early detection of COVID-19 pneumonia. In addition, initial CT findings may be useful to stratify patients, which have a potentially important utility in the current global medical situation.
El papel fundamental de la tomografía computarizada (TC) de tórax para el diagnóstico y el pronóstico de la enfermedad por coronavirus-2019 (COVID-19) sigue siendo un campo abierto por explorar. Este estudio se realizó para evaluar las características de la TC en los casos confirmados con COVID-19.
Materiales y métodosDe forma retrospectiva, se revisaron los datos de la TC torácica inicial de 363 casos confirmados con COVID-19. Todos los sujetos se estratificaron en tres grupos en función de los resultados clínicos de los pacientes; grupo no crítico (n=194), grupo crítico (n=65), y grupo de muerte (n=104). Los detalles de los hallazgos de la TC se obtuvieron de las historias clínicas de los pacientes y posteriormente se evaluaron para cada grupo. Además, se utilizó la regresión logística multinomial para analizar los factores de riesgo según los hallazgos de la TC en tres grupos de pacientes con COVID-19.
ResultadosEn comparación con el grupo no crítico, las opacidades mixtas en vidrio esmerilado (GGO, por sus siglas en inglés) y la lesión de consolidación, la lesión de derrame pleural, la presencia de opacidad difusa en los casos, más de 2 lóbulos afectados y las puntuaciones de opacidad fueron significativamente mayores en los grupos crítico y de muerte (P<0,05). Tener más GGO mixta con consolidación, derrame pleural, falta de GGO pura, opacidad más difusa, afectación de más de 2 lóbulos y alta puntuación de opacidad se identificaron como factores de riesgo independientes de grupos críticos y de muerte.
ConclusiónLas imágenes de TC de los grupos no crítico, crítico y de muerte con COVID-19 tenían características definidas. La exploración por TC desempeña un papel fundamental en la gestión del actual brote de COVID-19 para la detección temprana de la neumonía por COVID-19. Además, los hallazgos iniciales de la TC pueden ser útiles para estratificar a los pacientes, lo que tiene una utilidad potencialmente importante en la situación médica global actual.
Coronavirus disease 2019 (COVID-19), a highly infectious disease caused by severe acute respiratory syndrome coronavirus 2 (SARS-CoV-2), was firstly reported in Wuhan, Hubei Province, China, and rapidly spreads to other countries in the world as well as in Iran.1,2 On March 11, 2020, the World Health Organization (WHO) declared the COVID-19 as a global pandemic.3 Now, more than two million people have died a year after the emergence and spread of the virus around the world.4 Iran confirmed two cases of death due to SARS-CoV-2 infections on 19 February 2020 in the city of Qom, 150km south of the capital city of Tehran.5 This was the first report of death officially diagnosed as COVID-19 in Middle-East countries.6 The total number of confirmed cases in Iran to date (25 January 2021) is 1.37 million, including 57,383 deaths and 1.16 million patients successfully recovered from the virus.4
The clinical spectrum of COVID-19 infection is very wide which includes; asymptomatic infection, mild upper respiratory tract disease, and severe viral pneumonia with respiratory failure and even death.7,8 Early detection of COVID-19 is critical to isolating patients from the healthy population for treatment and controlling the epidemic. Real-time reverse transcription polymerase chain reaction (RT-PCR) of viral nucleic acid is regarded as the reference standard for COVID-19 diagnosis.9 However, due to the false negative RT-PCR results, the limited access to the diagnostic kit in the early stage of pandemic among countries and molecular microbiology techniques were not well developed. Furthermore, the duration of the tests was long and the capacity to carry out many at the same time was limited. Hence, the chest computed tomography (CT) examination in COVID-19 patients became very important in the management of the disease.10–13 It is noteworthy that that the definitive diagnosis of COVID-19 infection can only be made through microbiological studies and CT findings are the only complementary tool for the management of COVID-19. This method is very useful for symptomatic patients and radiological findings are very helpful for physician in diagnosis and treatment.
Bilateral distribution of ground glass opacities (GGO) with or without consolidation in posterior and peripheral lungs was the cardinal hallmark of COVID-19.14,15 However, with further analysis of increasing cases, a diversity of interesting CT imaging features were found, including crazy paving pattern, liner opacity, pleural effusion, lymphadenopathy and reversed halo sign, etc.,16,17 which may shed light on the possible mechanism of lung injury in COVID-19. In addition, at the peak of COVID-19 outbreak, Iranian health authorities broadened the official definition of infection to include patients with typical findings at CT even with initial negative PCR results.18,19 Therefore, we conduct this retrospective study to assess the CT features in confirmed Iranian cases with COVID-19.
Materials and methodsStudy design and participantsIn this observational study, the initial chest CT data of 363 COVID-19 confirmed cases in Baqiyatallah Hospital, Tehran, Iran from March to April 2020 were retrospectively reviewed. Patients who were referred to the Baqiyatallah Hospital with symptoms related to SARS-CoV-2 including fever, dry cough, fatigue, pain, sore throat, diarrhea, conjunctivitis, headache, loss of taste or smell, difficulty breathing or shortness of breath, and chest pain or pressure. To diagnose COVID-19 infection according to WHO guidelines, samples were collected from their throat and nose and if the RT-PCR test was positive, they were confirmed as COVID-19 cases.20 Patients who did not need to be hospitalized were excluded from the study and patients whose medical records were complete during hospitalization and had lung CT were eligible to include in this study. All eligible participants were stratified into three groups based on patients’ clinical outcomes, patients who have recovered from COVID-19 and have been discharged from the hospital as non-critical group (n=194), patients admitted to the intensive care unit (ICU) as critical group (n=65), and those who have died as death group (n=104). In addition, all groups were matched for sex and age. The detailed of CT findings were collected from patients’ medical records and evaluated for each group and compared between the groups. This retrospective observational study was approved by the Ethics Committee of Shahid Beheshti University of Medical Sciences, Tehran, Iran, with code: IR.SBMU.RIGLD.REC.1399.005.
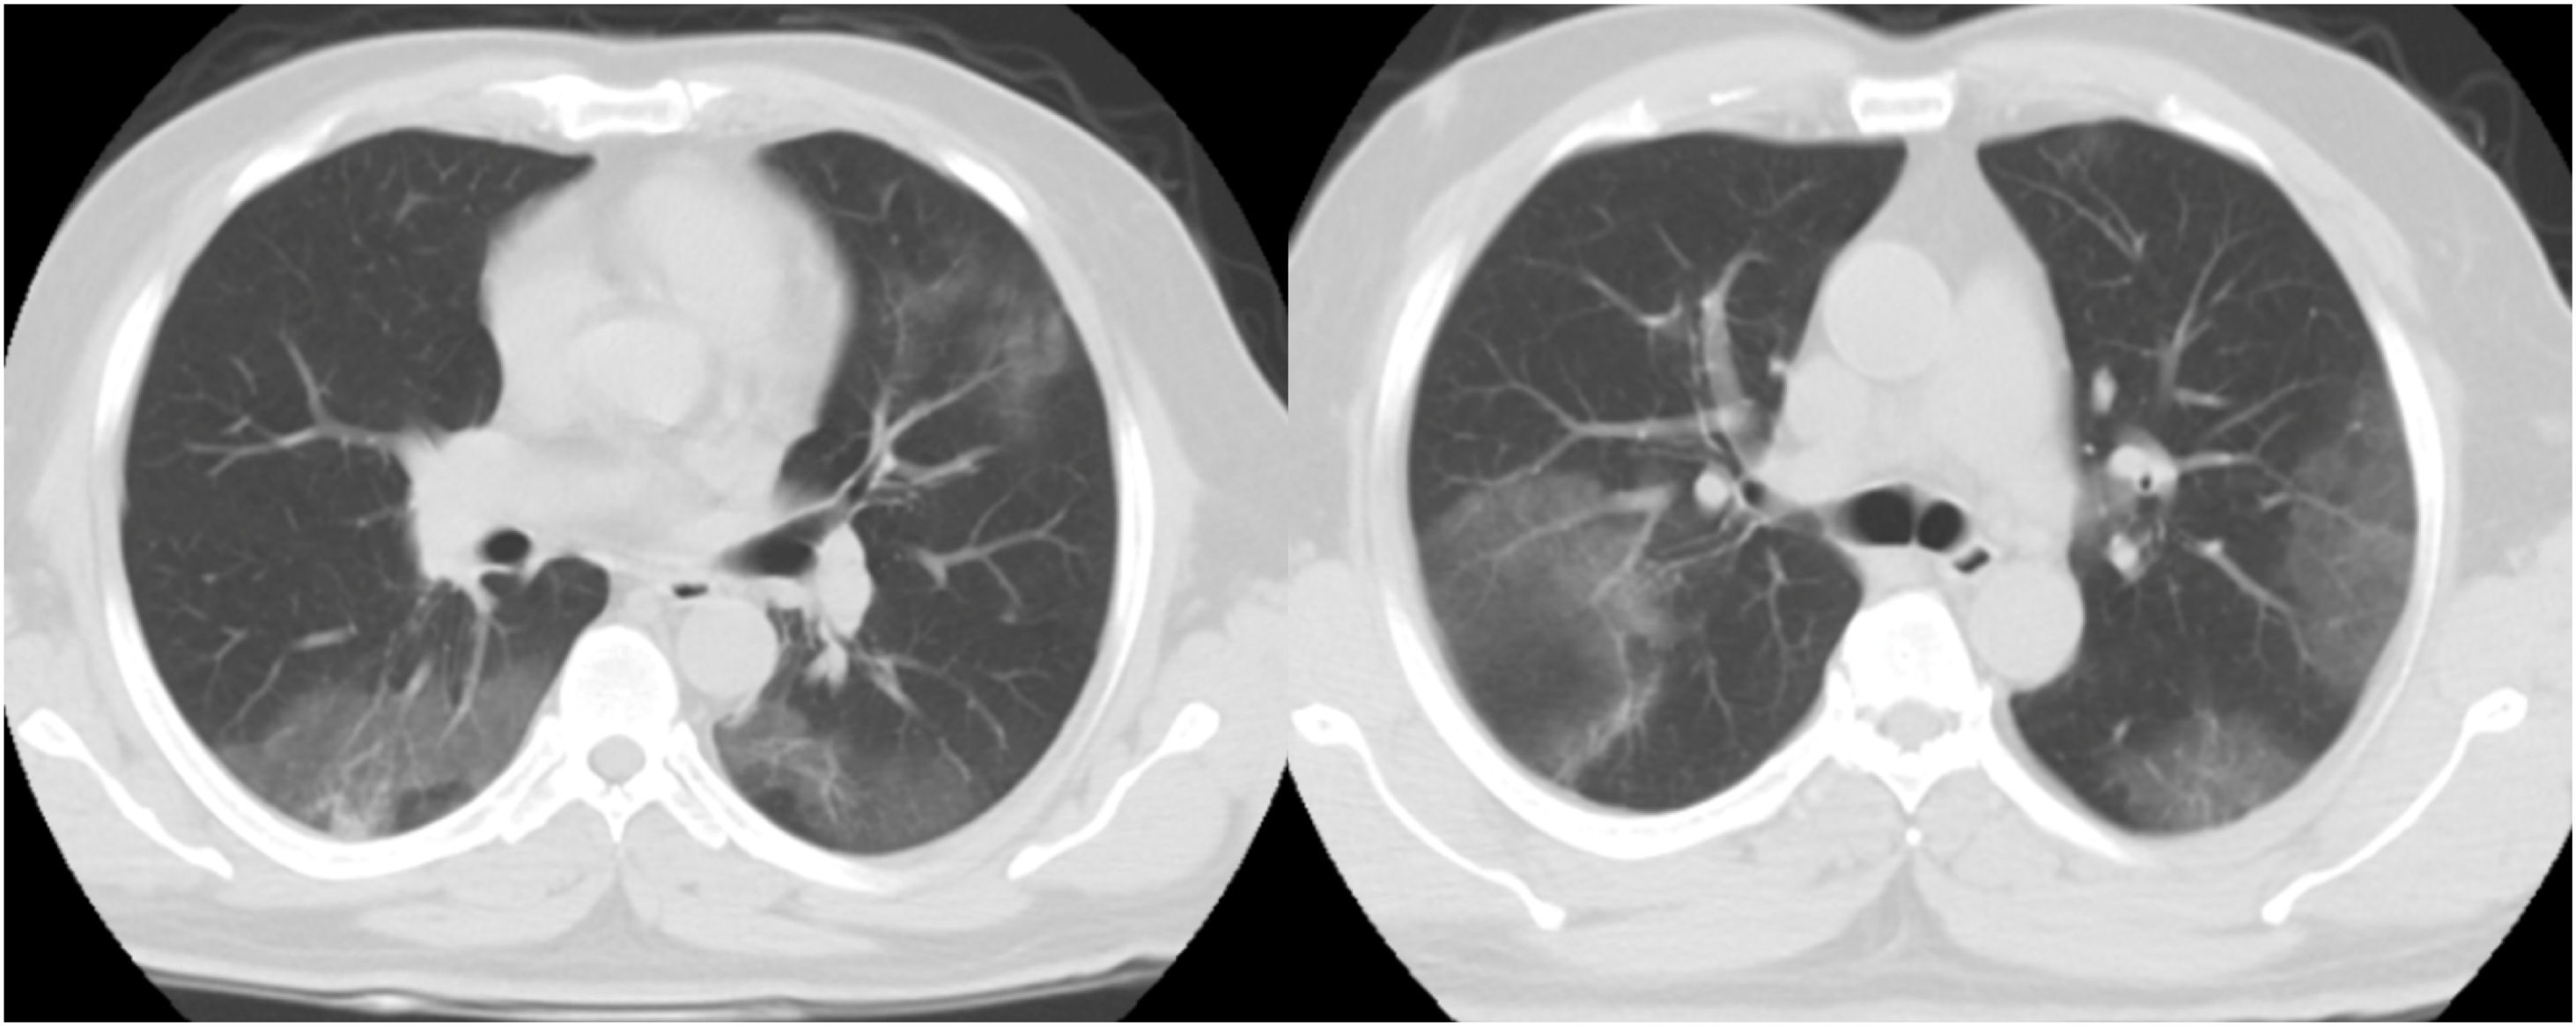
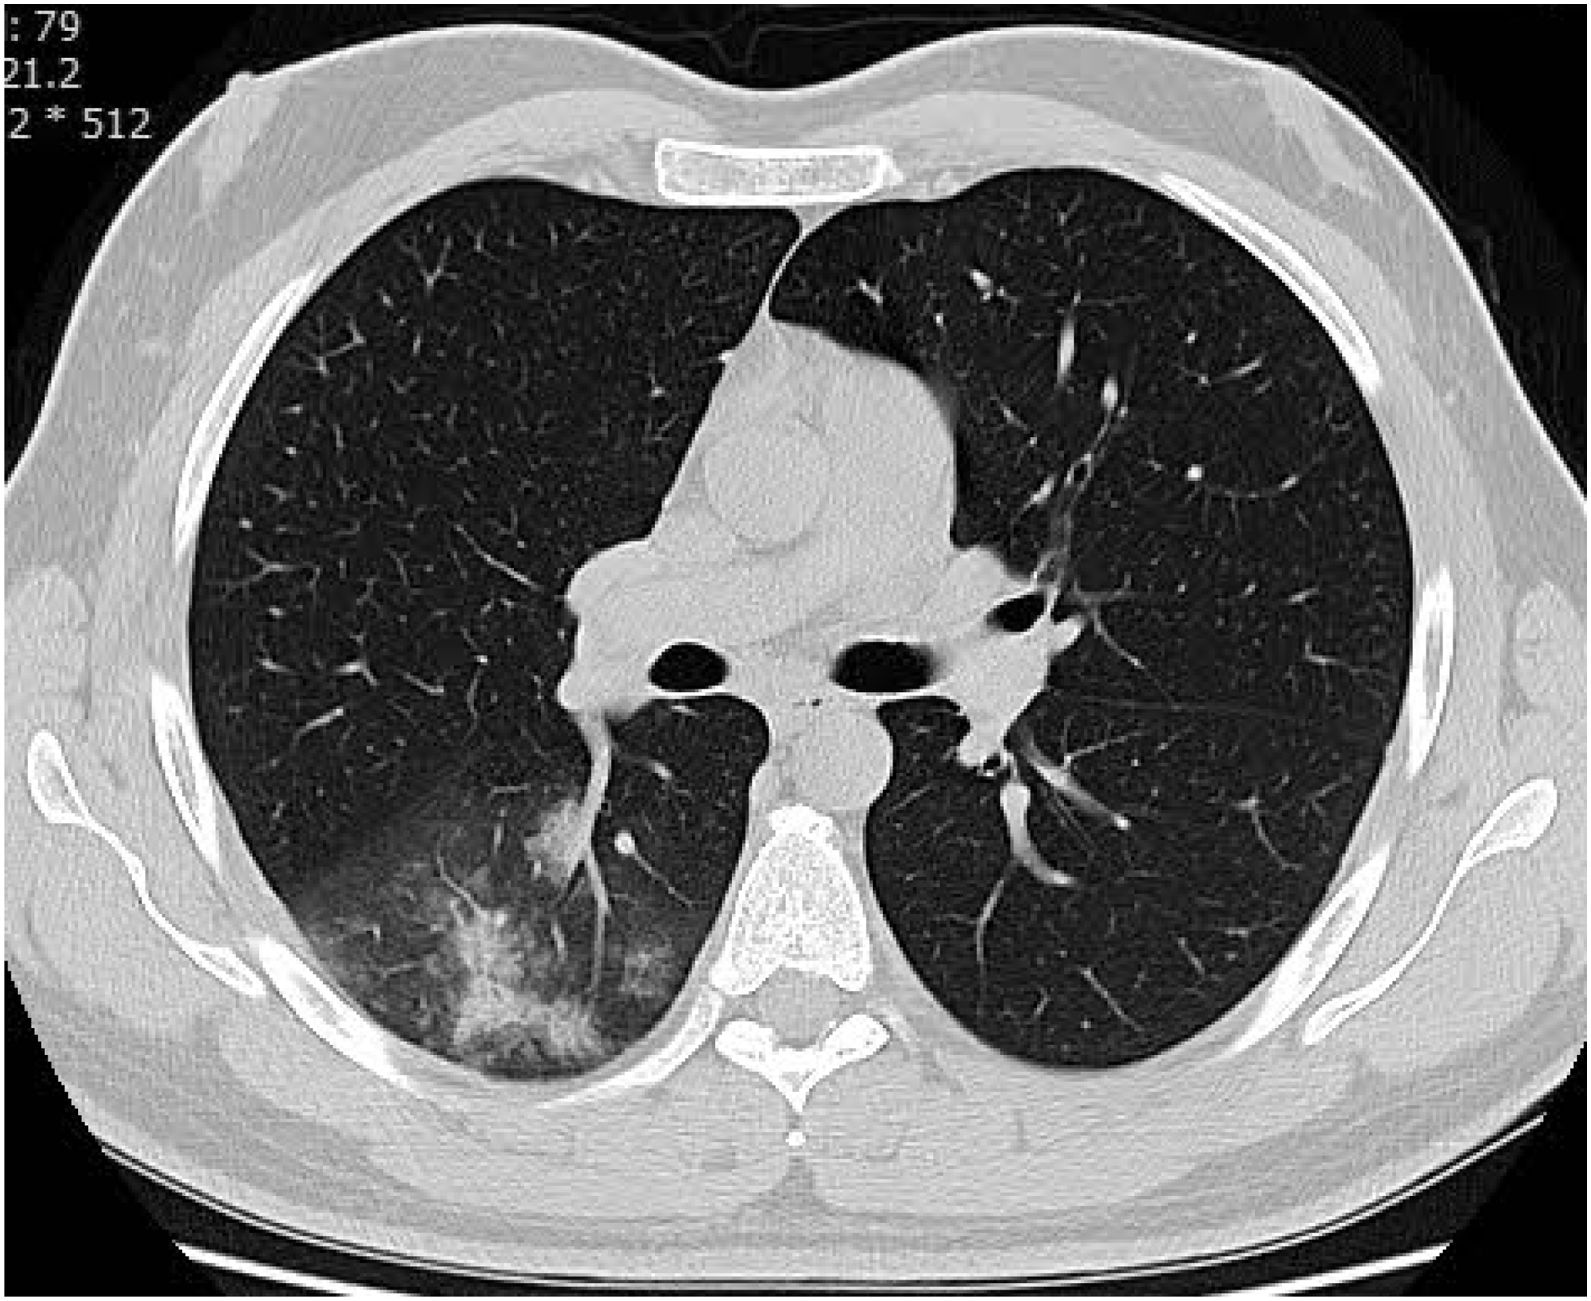
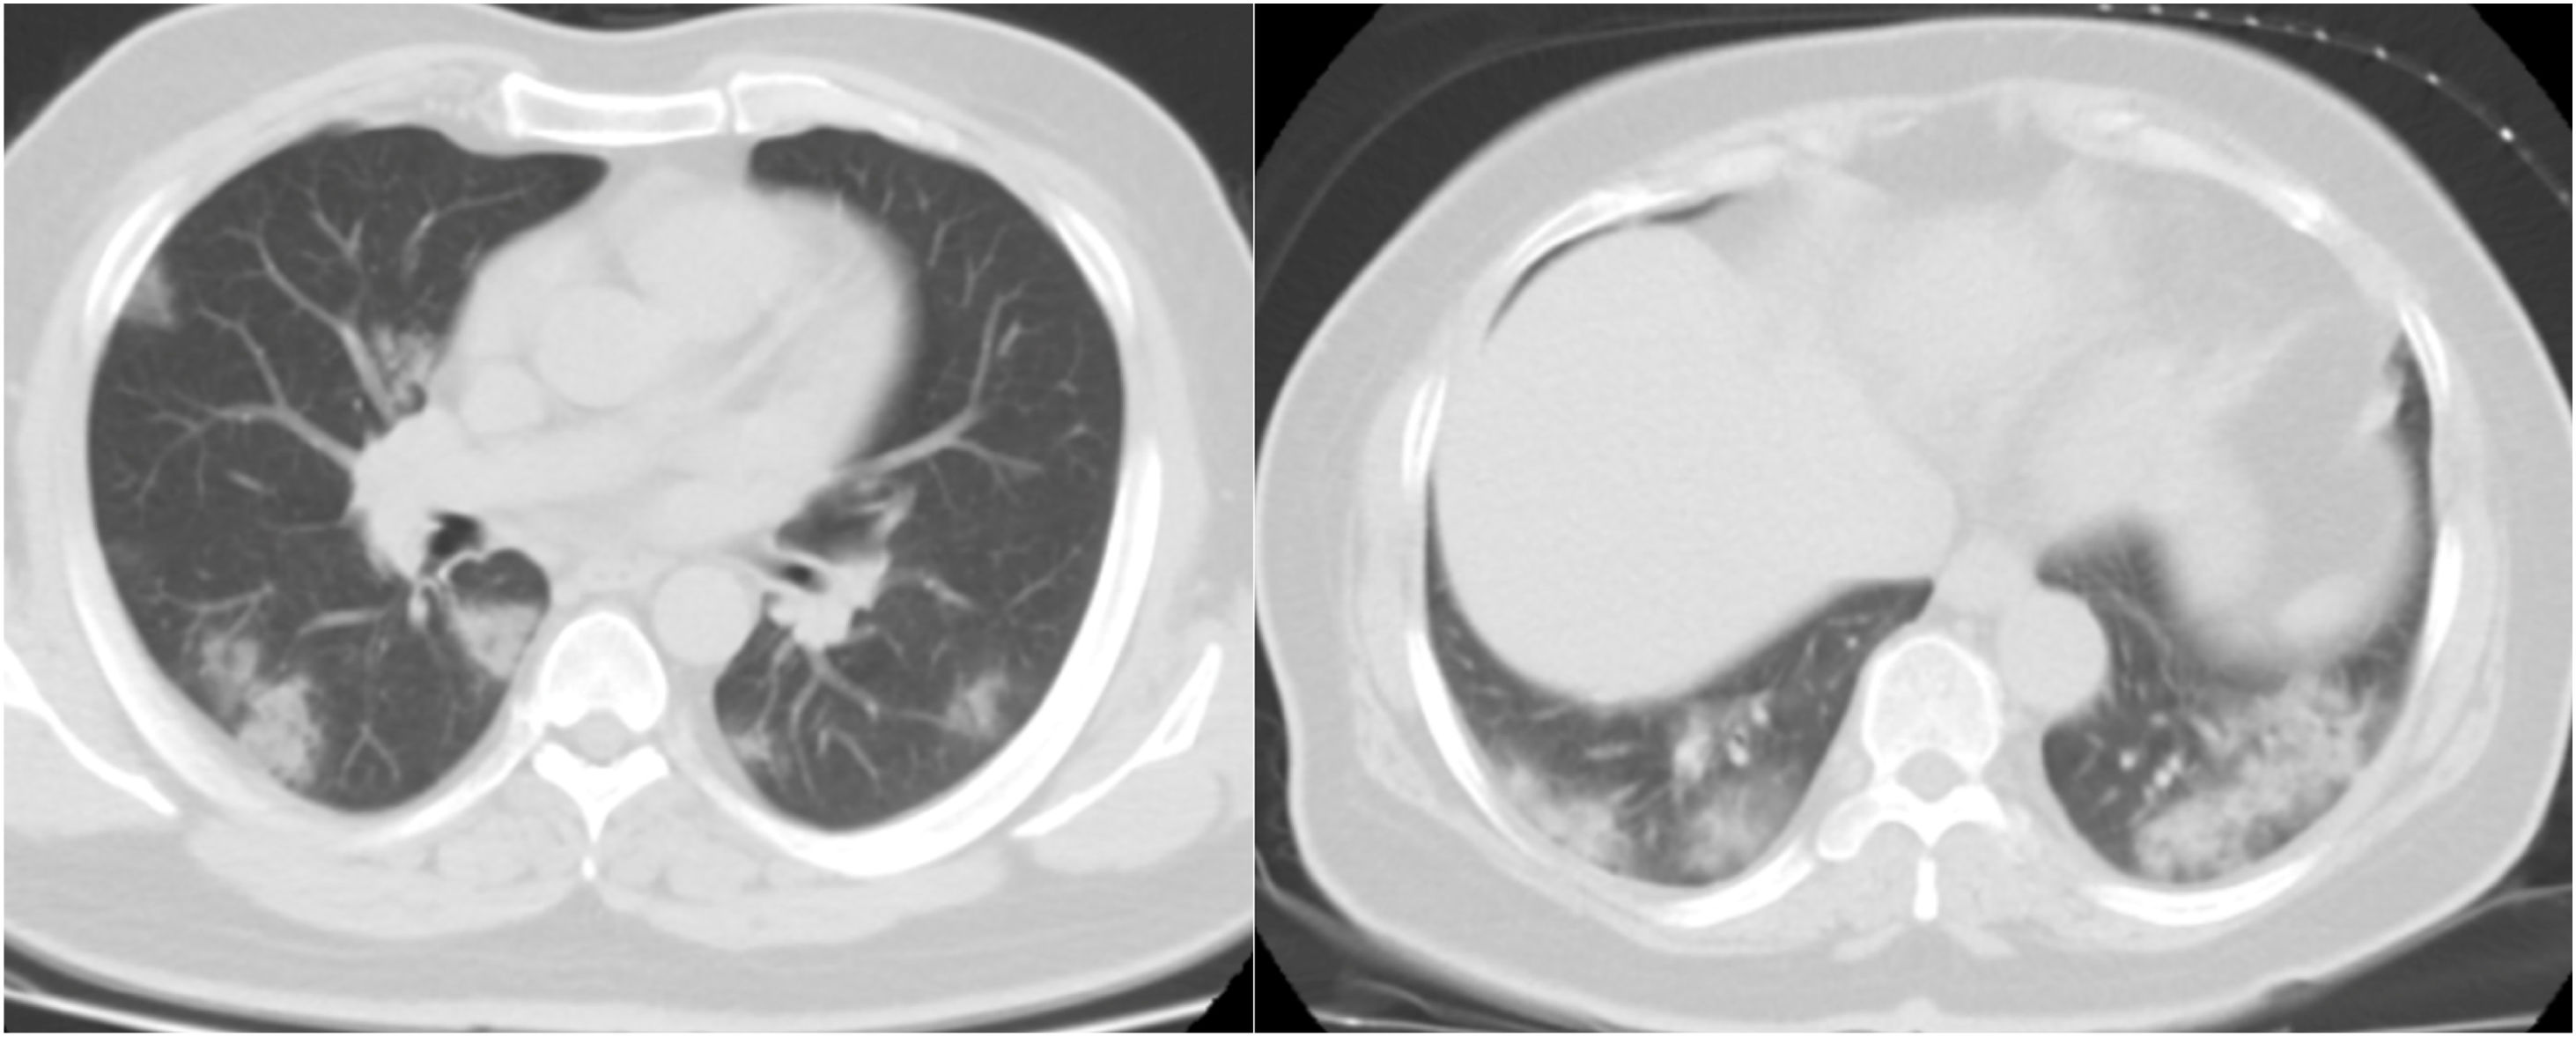
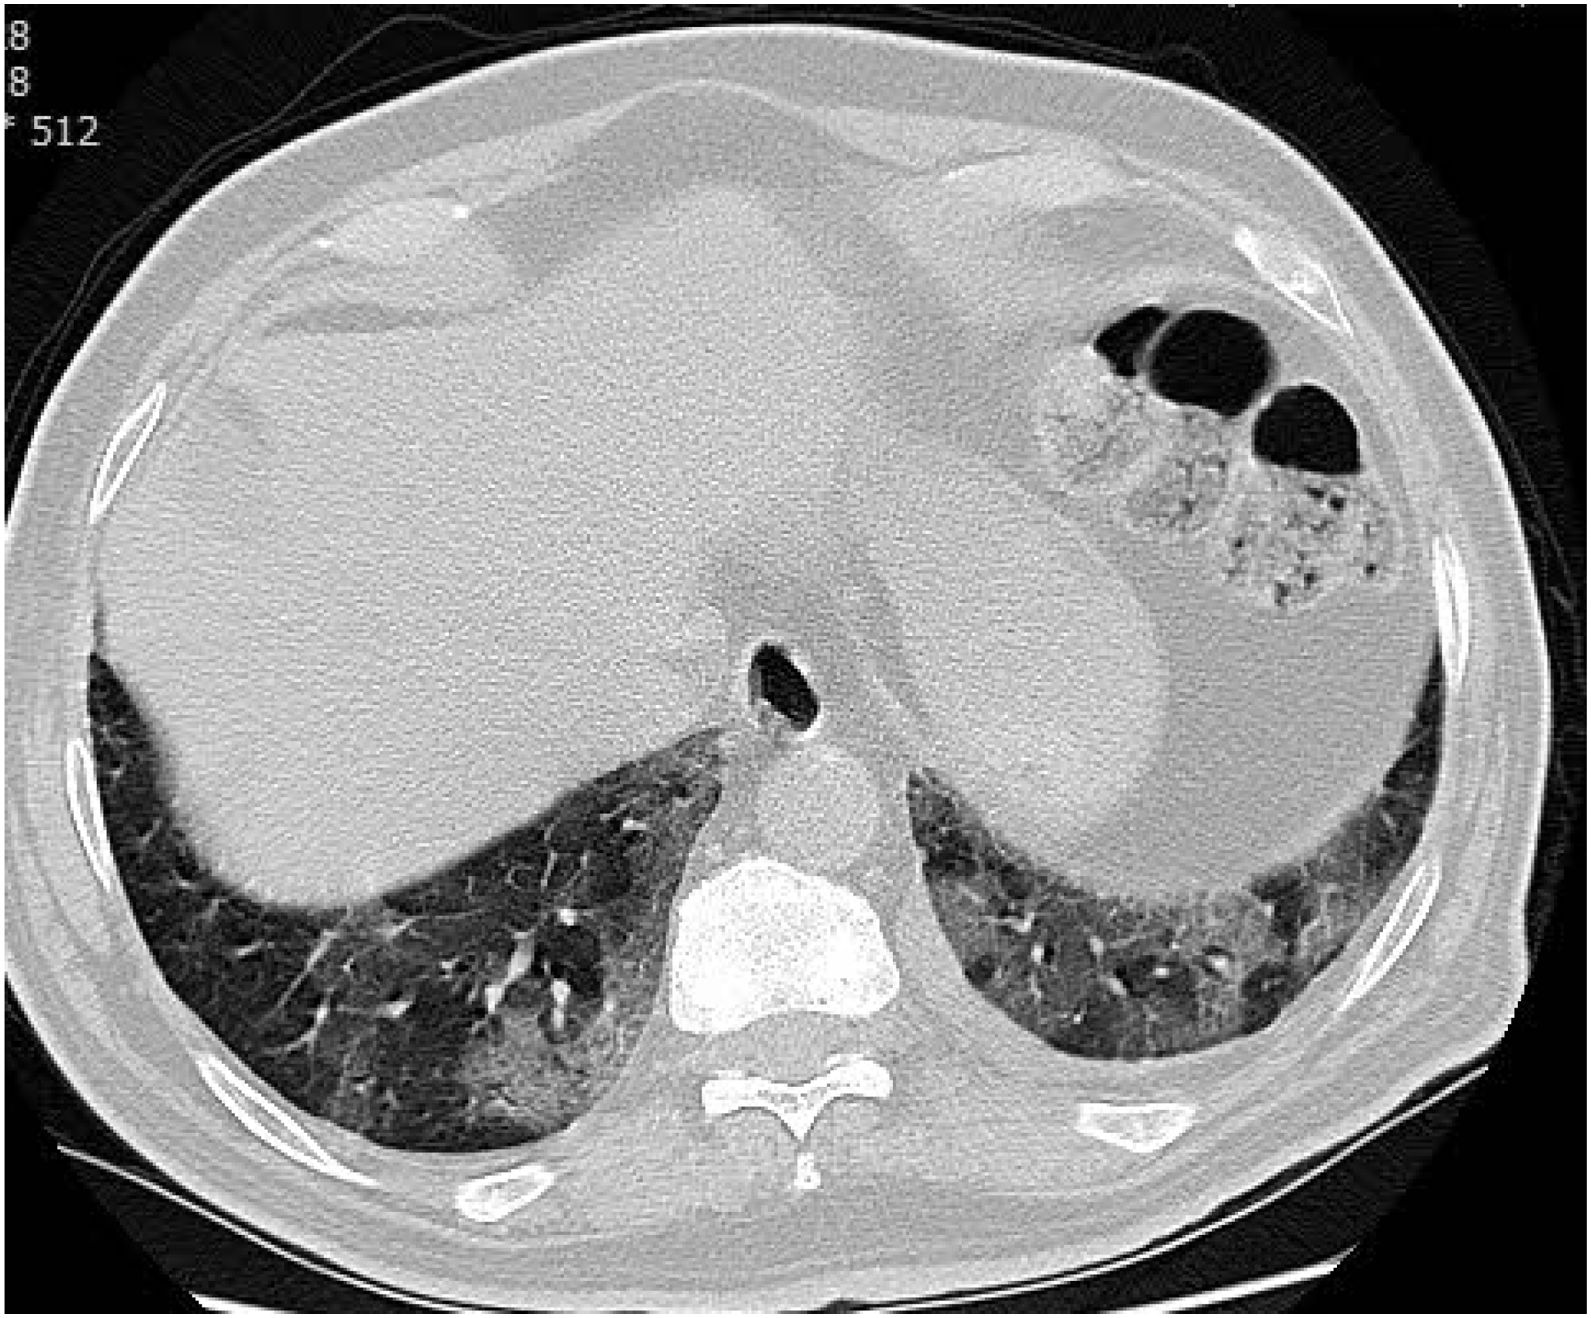
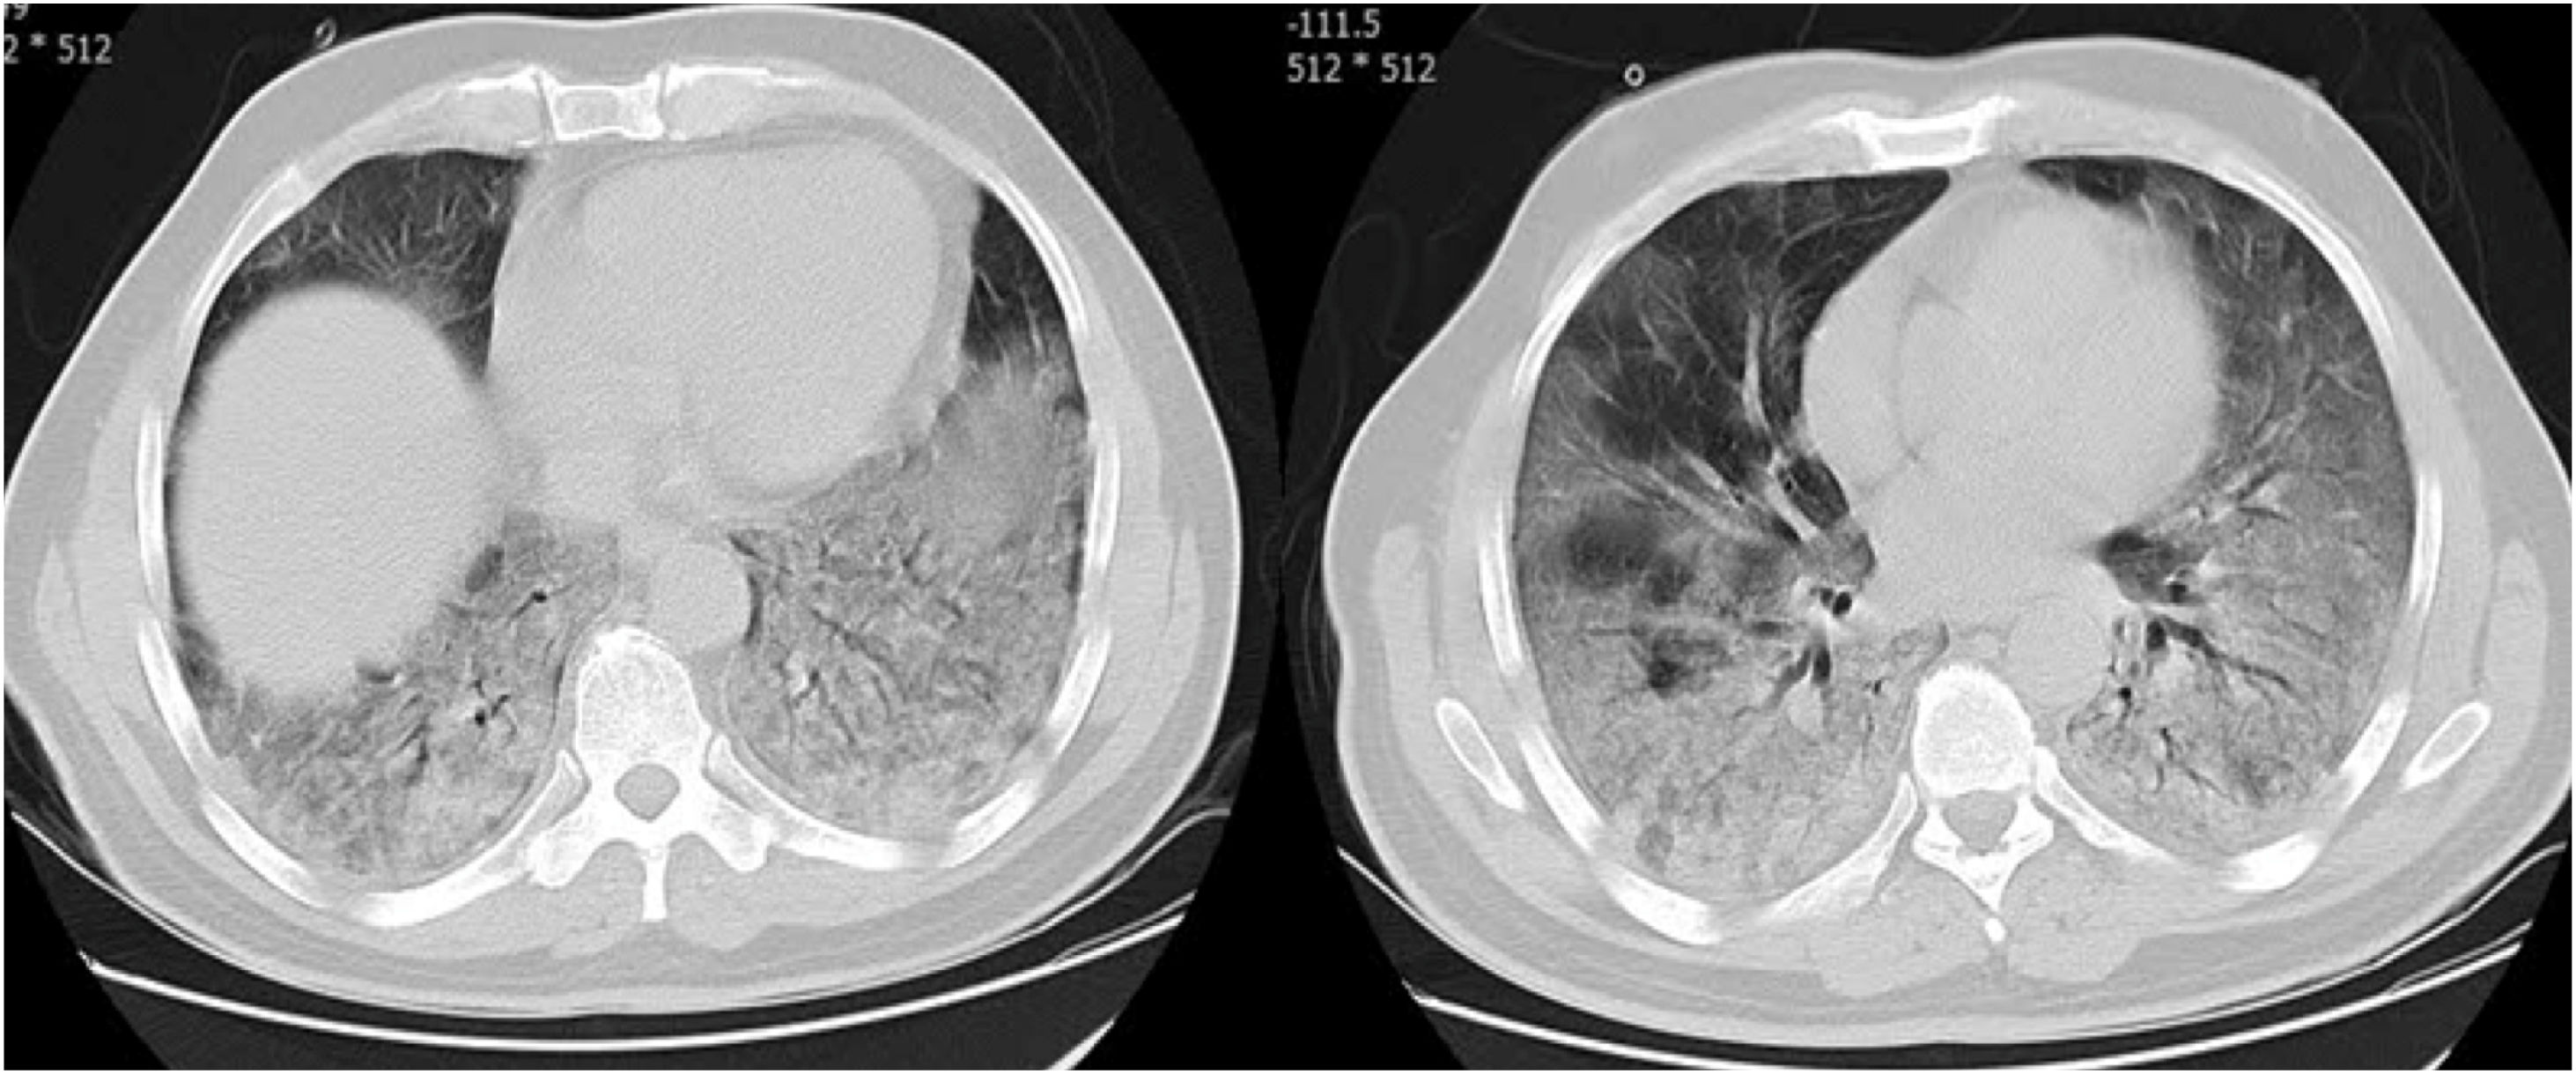
CT examination and image analysisAll the patients underwent non-enhanced chest CT examinations for detecting COVID-19 pneumonia in the supine position at full inspiration. All CT scan examinations were performed with a 16-row detector CT scanner (general electric GE, optima, USA). The detailed parameters for CT acquisition based on COVID-19 low-dose thoracic CT scan protocol were as follows: tube voltage, 100 kVp, 120mA, slice thickness of 2.5mm, reconstruction interval of 1.25mm, pitch 1.75,speed 35mm/rot, detector configuration 16*1.25, computed tomography dose index (CTDI) 3.5mGy. All the chest CT features of patients were reviewed by two radiologists with 12 and 10 years of experience in thoracic imaging who were blinded to the clinical data evaluated the CT findings in consensus. The initial chest CT images were evaluated for the following characteristics based on the Fleischner Society Nomenclature recommendations.21,22 CT images were evaluated for the presence and distribution of the following lesions: appearance of lesions (ground-glass opacities (GGO), consolidation, mixed GGO and consolidation) (Figs. 1–3), distribution of lesions (unilateral, bilateral, unifocal and multifocal), specific signs (crazy-paving pattern, liner opacity, lymphadenopathy, pleural effusion, reversed halo sign and intralesional traction bronchiectasis) (Fig. 4). Distribution of lesions was evaluated as distribution between the left and right lungs, among five lung lobes, and around the sub pleural areas and Broncho vascular bundles. The presence of diffuse opacity (over 75% in each lobe) (Fig. 5), number of lobes involved (one, two, three, four or five). GGO describes a fuzzy increase in density in the lungs with visible bronchial and blood vessel edges.21 Crazy-paving pattern shows the thickening of the interlobular septa and intralobular lines superimposed on the GGO. Consolidation describes an increase in parenchyma density that conceals blood vessels. Irregular line describes the linear shadow of high attenuation in the lung. Air bronchogram sign means that the bronchus containing gas is outlined by high attenuation, including consolidation or GGO.21 In order to stratify the degree of lung involvement, a scoring method based on CT findings was implemented. Each lobe was assigned a score that was based on the following: score 0, 0% involvement; score 1, less than 5% involvement; score 2, 5–25% involvement; score 3, 26–49% involvement; score 4, 50–75% involvement; and score 5, greater than 75% involvement. There was a score of 0–5 for each lobe, with a total possible score of 0–25.23,24


Categorical variables were expressed as counts (percentage), and continuous variable as mean±standard deviation (SD). The one-way analysis of variance (ANOVA) test will be used for the comparison of the continuous data among the three groups of study. Chi-square test where used to compare the distribution of categorical data. To explore the risk factors of COVID-19 associated with three groups of study as a dependent variable will be analyzed by multinomial logistic regression model. To avoid over-fitting in the multivariate model, just the factors which leads to P-value less than 0.05 in univariate analysis, were selected for multivariate model. In the model the survive group as the reference category was performed to identify the prognostic factors of CT associated with critical and non-survive groups. All data were analyzed using the Statistical Package for the Social Sciences (SPSS) 21.0 statistical package (Chicago, IL, USA) and two-side P<0.05 indicated a statistically significant difference.
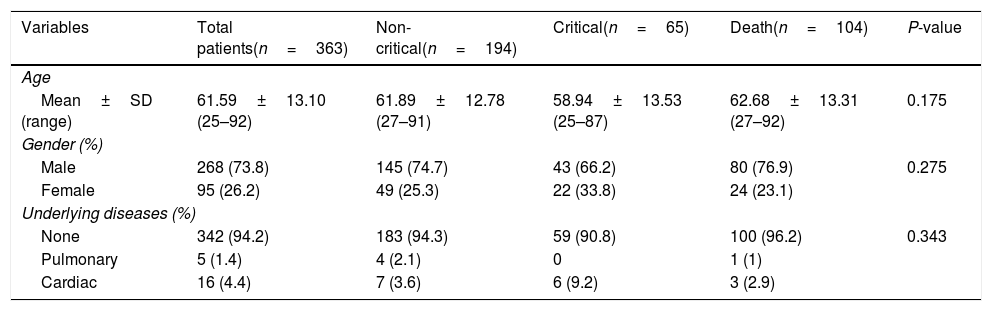
ResultsDemographic characteristics of patientsA total of 363 confirmed cases with COVID-19 were included in this study. The mean±SD age of total participants was 61.59±13.10 years and more than half of the patients were males (73.8%). In addition, the majority of patients (94.2%) did not report any underlying disease, and a small percentage of patients had cardiac (4.4%) and pulmonary problems (1.4%). According to patients’ clinical outcomes, they classified into three groups; non-critical group (n=194), critical group (n=65), and death group (n=104). Demographic characteristics of all participants according to three groups of study are presented in Table 1. The mean age of patients in non-critical, critical and death groups were 61.89±12.78, 58.94±13.53, and 62.68±13.31, respectively. More than half of the patients in all groups were males. The results showed that there was no statistically significant difference between the groups in terms of age and sex (P>0.05).
Demographic characteristics in three groups of the study.
| Variables | Total patients(n=363) | Non-critical(n=194) | Critical(n=65) | Death(n=104) | P-value |
|---|---|---|---|---|---|
| Age | |||||
| Mean±SD (range) | 61.59±13.10 (25–92) | 61.89±12.78 (27–91) | 58.94±13.53 (25–87) | 62.68±13.31 (27–92) | 0.175 |
| Gender (%) | |||||
| Male | 268 (73.8) | 145 (74.7) | 43 (66.2) | 80 (76.9) | 0.275 |
| Female | 95 (26.2) | 49 (25.3) | 22 (33.8) | 24 (23.1) | |
| Underlying diseases (%) | |||||
| None | 342 (94.2) | 183 (94.3) | 59 (90.8) | 100 (96.2) | 0.343 |
| Pulmonary | 5 (1.4) | 4 (2.1) | 0 | 1 (1) | |
| Cardiac | 16 (4.4) | 7 (3.6) | 6 (9.2) | 3 (2.9) | |
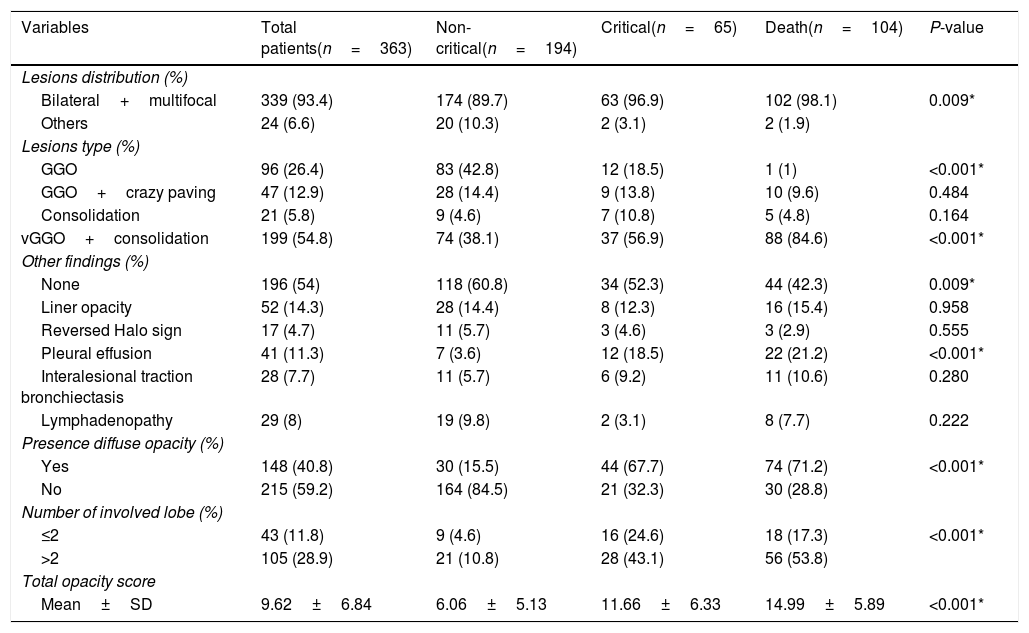
The chest CT findings of the patients in three groups of study are shown in Table 2. CT results showed most bilateral and multifocal involvement in patients (339/363, 93.4%). Although this type of distribution of lesion has been common in all groups, it was significantly more common in death group than in non-critical group (P=0.009). The common appearance of lesion based on CT in all participants was mixed GGO and consolidation (199/363, 54.8%), pure GGO (96/363, 26.4%), mixed GGO and crazy-paving pattern (47/363, 12.9%) and consolidation (21/363, 5.8%). Of the 363 participants in the study, more than half did not have specific signs (196/363, 54%). While, the liner opacities, pleural effusion, lymphadenopathy, intralesional traction bronchiectasis and reversed halo sign were observed in 14.3%, 11.3%, 8%, 7.7% and 4.7% of patients, respectively. Among the all participants, 148 (40.8%) subjects had lung diffuse opacity greater than 75% involvement in each lobe. Compared with non-critical group, mixed GGO and consolidation lesion (P<0.001), having specific sign of lesion (P=0.009), pleural effusion lesion (P<0.001), presence of diffuse opacity in cases (P<0.001), more than 2 lobes involved (P<0.001) and the scores of opacity (P<0.001) were significantly higher in the critical and death groups However, pure GGO was a predominant lesion in non-critical individuals (83/194, 42.8%, P<0.001).
CT features in three groups of the study.
| Variables | Total patients(n=363) | Non-critical(n=194) | Critical(n=65) | Death(n=104) | P-value |
|---|---|---|---|---|---|
| Lesions distribution (%) | |||||
| Bilateral+multifocal | 339 (93.4) | 174 (89.7) | 63 (96.9) | 102 (98.1) | 0.009* |
| Others | 24 (6.6) | 20 (10.3) | 2 (3.1) | 2 (1.9) | |
| Lesions type (%) | |||||
| GGO | 96 (26.4) | 83 (42.8) | 12 (18.5) | 1 (1) | <0.001* |
| GGO+crazy paving | 47 (12.9) | 28 (14.4) | 9 (13.8) | 10 (9.6) | 0.484 |
| Consolidation | 21 (5.8) | 9 (4.6) | 7 (10.8) | 5 (4.8) | 0.164 |
| vGGO+consolidation | 199 (54.8) | 74 (38.1) | 37 (56.9) | 88 (84.6) | <0.001* |
| Other findings (%) | |||||
| None | 196 (54) | 118 (60.8) | 34 (52.3) | 44 (42.3) | 0.009* |
| Liner opacity | 52 (14.3) | 28 (14.4) | 8 (12.3) | 16 (15.4) | 0.958 |
| Reversed Halo sign | 17 (4.7) | 11 (5.7) | 3 (4.6) | 3 (2.9) | 0.555 |
| Pleural effusion | 41 (11.3) | 7 (3.6) | 12 (18.5) | 22 (21.2) | <0.001* |
| Interalesional traction bronchiectasis | 28 (7.7) | 11 (5.7) | 6 (9.2) | 11 (10.6) | 0.280 |
| Lymphadenopathy | 29 (8) | 19 (9.8) | 2 (3.1) | 8 (7.7) | 0.222 |
| Presence diffuse opacity (%) | |||||
| Yes | 148 (40.8) | 30 (15.5) | 44 (67.7) | 74 (71.2) | <0.001* |
| No | 215 (59.2) | 164 (84.5) | 21 (32.3) | 30 (28.8) | |
| Number of involved lobe (%) | |||||
| ≤2 | 43 (11.8) | 9 (4.6) | 16 (24.6) | 18 (17.3) | <0.001* |
| >2 | 105 (28.9) | 21 (10.8) | 28 (43.1) | 56 (53.8) | |
| Total opacity score | |||||
| Mean±SD | 9.62±6.84 | 6.06±5.13 | 11.66±6.33 | 14.99±5.89 | <0.001* |
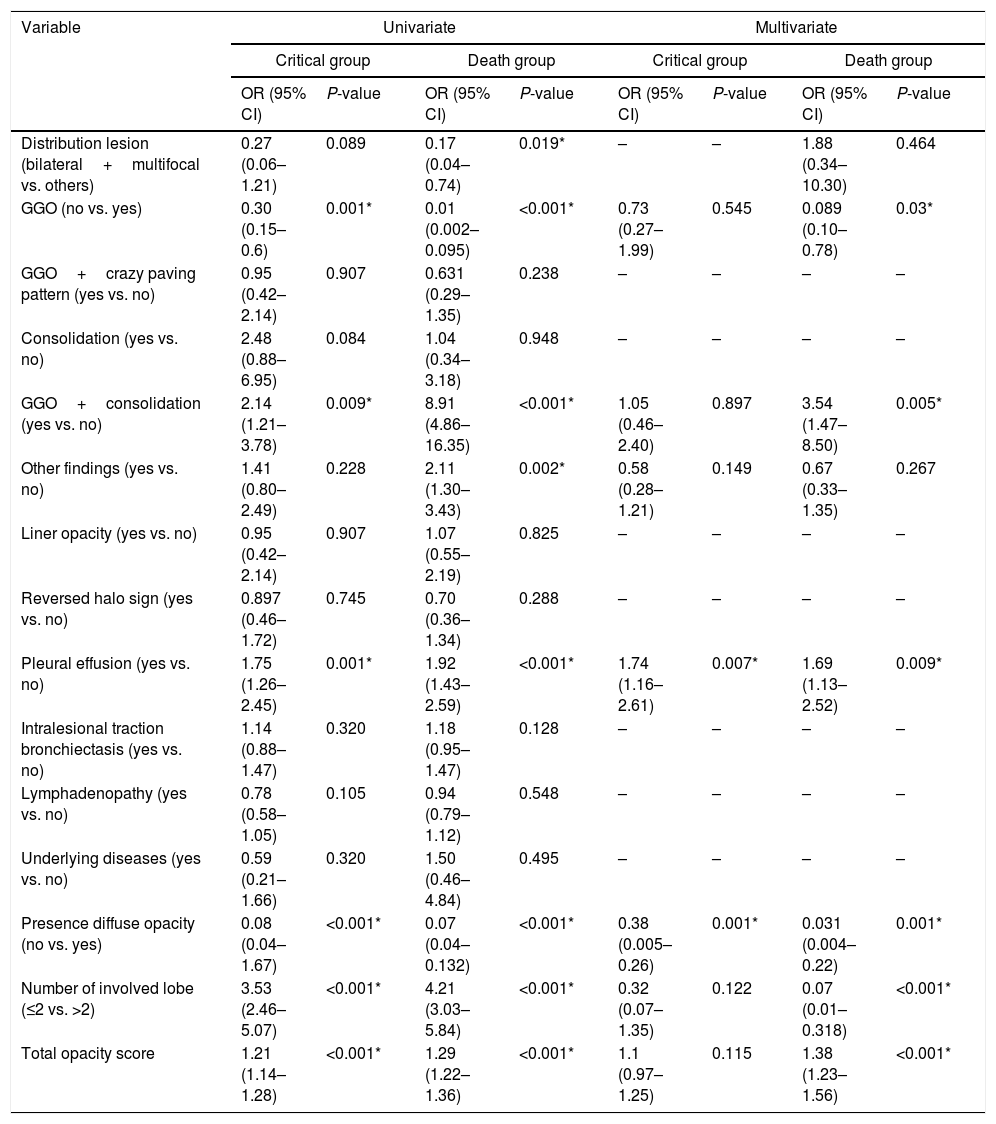
Multinomial logistic regression analysis was used to analyze risk factors according chest CT findings and investigate how odd ratios (ORs) varied in three groups of patients with COVID-19 (non-critical group vs. critical group, or death group). The findings of univariate and multivariate multinomial logistic regression analysis from chest CT findings as risk factors in three groups of the study are summarized in Table 3. According to the results of the multivariate multinomial logistic regression analysis, having more mixed GGO with consolidation lesion OR: 3.54 (95% CI: 1.47–8.5, P=0.005), and higher opacity score 1.38 (95% CI: 1.23–1.56, P<0.001) were associated with increased risk of death. In addition, having a pleural effusion lesion 1.74 (95% CI: 1.16–2.1, P=0.007) and 1.69 (95% CI: 1.13–2.52, P=0.009), can increase the risk of critical and death in patients with COVID-19, respectively. However, the absence of GGO lesion 0.089 (95% CI: 0.1–0.78, P=0.03), diffuse opacity 0.031 (95% CI: 0.004–0.22, P=0.001), and number of less involved lung lobes (≤2 vs. >2) 0.07 (95% CI: 0.01–0.318, P<0.001) were identified as protective factors for patients with COVID-19 against death. The absence of diffuse opacity 0.38 (95% CI: 0.005–0.26, P=0.001) also recognized as protective factor for patients with COVID-19 in front of critical status.
Multinomial logistic regression analysis of risk factors based on CT findings for critical and death groups compared with non-critical group as reference.
| Variable | Univariate | Multivariate | ||||||
|---|---|---|---|---|---|---|---|---|
| Critical group | Death group | Critical group | Death group | |||||
| OR (95% CI) | P-value | OR (95% CI) | P-value | OR (95% CI) | P-value | OR (95% CI) | P-value | |
| Distribution lesion (bilateral+multifocal vs. others) | 0.27 (0.06–1.21) | 0.089 | 0.17 (0.04–0.74) | 0.019* | – | – | 1.88 (0.34–10.30) | 0.464 |
| GGO (no vs. yes) | 0.30 (0.15–0.6) | 0.001* | 0.01 (0.002–0.095) | <0.001* | 0.73 (0.27–1.99) | 0.545 | 0.089 (0.10–0.78) | 0.03* |
| GGO+crazy paving pattern (yes vs. no) | 0.95 (0.42–2.14) | 0.907 | 0.631 (0.29–1.35) | 0.238 | – | – | – | – |
| Consolidation (yes vs. no) | 2.48 (0.88–6.95) | 0.084 | 1.04 (0.34–3.18) | 0.948 | – | – | – | – |
| GGO+consolidation (yes vs. no) | 2.14 (1.21–3.78) | 0.009* | 8.91 (4.86–16.35) | <0.001* | 1.05 (0.46–2.40) | 0.897 | 3.54 (1.47–8.50) | 0.005* |
| Other findings (yes vs. no) | 1.41 (0.80–2.49) | 0.228 | 2.11 (1.30–3.43) | 0.002* | 0.58 (0.28–1.21) | 0.149 | 0.67 (0.33–1.35) | 0.267 |
| Liner opacity (yes vs. no) | 0.95 (0.42–2.14) | 0.907 | 1.07 (0.55–2.19) | 0.825 | – | – | – | – |
| Reversed halo sign (yes vs. no) | 0.897 (0.46–1.72) | 0.745 | 0.70 (0.36–1.34) | 0.288 | – | – | – | – |
| Pleural effusion (yes vs. no) | 1.75 (1.26–2.45) | 0.001* | 1.92 (1.43–2.59) | <0.001* | 1.74 (1.16–2.61) | 0.007* | 1.69 (1.13–2.52) | 0.009* |
| Intralesional traction bronchiectasis (yes vs. no) | 1.14 (0.88–1.47) | 0.320 | 1.18 (0.95–1.47) | 0.128 | – | – | – | – |
| Lymphadenopathy (yes vs. no) | 0.78 (0.58–1.05) | 0.105 | 0.94 (0.79–1.12) | 0.548 | – | – | – | – |
| Underlying diseases (yes vs. no) | 0.59 (0.21–1.66) | 0.320 | 1.50 (0.46–4.84) | 0.495 | – | – | – | – |
| Presence diffuse opacity (no vs. yes) | 0.08 (0.04–1.67) | <0.001* | 0.07 (0.04–0.132) | <0.001* | 0.38 (0.005–0.26) | 0.001* | 0.031 (0.004–0.22) | 0.001* |
| Number of involved lobe (≤2 vs. >2) | 3.53 (2.46–5.07) | <0.001* | 4.21 (3.03–5.84) | <0.001* | 0.32 (0.07–1.35) | 0.122 | 0.07 (0.01–0.318) | <0.001* |
| Total opacity score | 1.21 (1.14–1.28) | <0.001* | 1.29 (1.22–1.36) | <0.001* | 1.1 (0.97–1.25) | 0.115 | 1.38 (1.23–1.56) | <0.001* |
The reference category is survive patients, OR: odd ratio, CI: confidence interval.
Chest CT scan can be used as a screening tool for patients with suspected COVID-19, and as a complementary diagnostic method alongside RT-PCR can provide important information to the treatment staff.25 In addition, it can be used as a follow-up tool to monitor the disease evolution and evaluate the severity of COVID-19 patients.26 In the present study, we focused on investigating the chest CT imaging characteristics of the COVID-19 pneumonia in three groups of Iranian patients according to the patients’ clinical outcomes. A total of 363 patients with COVID-19 including 194 non-critical cases, 65 critical patients and 104 death cases were enrolled in this study. Our study revealed that the common characteristics in the participants included mixed GGO with consolidation, pure GGO, pure consolidation, liner opacities and mixed GGO with crazy-paving pattern with predominantly bilateral distribution and multifocal lung involvement, which were similar to previous studies.27,28 However, other special classic signs, including reverse halo sign, intralesional traction bronchiectasis and lymphadenopathy were rare. Similarly to our results, Yang et al.,29 reported the low frequency of the intrathoracic lymph node enlargement, pleural effusions, the lesion distribution in lung of central, unifocal, and unilateral.
The pathology of GGOs may be the thickening of the alveolar wall, the collapse of the alveolar cavity, the reduction of the air content in the alveolar cavity and the infiltration of inflammatory cells, or a combination of these characteristics, based on an image characteristic of SARS-CoV-2 pneumonia published in various publications.30–32 The pathological mechanism of COVID-19 includes bronchoalveolar destruction and damage to lung parenchyma near the bronchioles in the early stages,33 and diffuse alveolar injury and acute fibrous and organic pneumonia can be observed in the late stages.34 This pathological pattern is the same as imaging pattern like GGO at first and then consolidation dense consolidative lesions, early in the disease. With the progression of the disease, lesions often turn more linear fashion with a predilection for the lung periphery (and somewhat with a “crazy” paving pattern or emergence of a “reverse halo” sign).
Previous studies have shown further enlargement of the lymph node and pleural effusion in severe/critical patients.35,36 Kazemi et al.,37 indicated that the crazy-paving pattern, diffuse distribution, paracardiac and anterior involvement, lymphadenopathy, main pulmonary artery dilation (above 30mm), and pleural effusion were predictors of poor prognosis, while the reversed halo sign was associated with a better prognosis for COVID-19 pneumonia, based on their logistic regression models. The immune response may be related to lymphadenopathy. The immune response of COVID-19 pneumonia patients is higher. Moreover, Guan et al. indicated that severe COVID-19 patients were more likely to show ground-glass opacity (GGO), local or bilateral patchy shadowing, and interstitial abnormalities on CT.38 In the current study, compared with the non-critical group, mixed GGO with consolidation and pleural effusion lesions, presence of diffuse opacity in cases, more than 2 lobes involved and opacity scores were significantly higher in the critical and death groups, which indicates that the alveoli are completely filled by inflammatory exudation. This usually means that the virus diffuses into the respiratory epithelium, leading to necrotizing bronchitis and diffuse alveolar damage.39,40 Patients in critical and death groups showed more pleural effusion rather than non-critical patients. These extra pulmonary lesions may indicate the occurrence of severe inflammation. Although lymphadenopathy and reversed halo sign were more frequent in non-critical individuals, no statistical incidence difference was observed between three groups (P>0.05).
The patterns of GGO with or without consolidation with the above features in predominantly peripheral distribution will facilitate the diagnosis of COVID-19 pneumonia.41 In addition, CT images of non-critical, critical and death cases with COVID-19 pneumonia have definite characteristics, which can assessment of disease scope and severity in prognosis. According to our results, most mixed GGO with consolidation and pleural effusion lesions involved bilateral lungs with multiple lung lobes (<2) and pure GGO lesions involved bilateral lungs with less than 2 lobes involved were observed in critical/death groups and non-critical group, respectively. The observation regarding the high prevalence of bilateral organizing pneumonia in these patients is potentially of importance. This suggests that corticosteroids might be an option to suppress this immune reaction within the lung parenchyma to COVID-19 pneumonia. Song et al.41 showed that the most common imaging findings were pure GGO, GGO with reticular and/or interlobular septal thickening, and GGO with consolidation and most of them were bilateral with involving multiple lobes. In a study by Meng et al.42 on 58 asymptomatic cases with COVID-19 pneumonia, showed that the predominant feature of CT findings was GGO (94.8%) with peripheral (75.9%) distribution, unilateral location (58.6%) and mostly involving one or two lobes (65.5%), often accompanied by characteristic signs.
The main strength of the present investigation was the large sample size. However, our study had several limitations. First, because COVID-19 is a novel disease and lacks a series and long-term CT data, we can analyze only the existing information in a retrospective analysis. Moreover, the time of chest CT examination after symptom onset was inconsistent, so it was difficult to summarize the CT appearances that could reflect the whole course of the disease.
ConclusionIn summary, COVID-19 pneumonia among critical individuals, both those admitted to the intensive care unit and those dying tend to manifest bilateral involvement on lung CT scans with mixed GGO and consolidation, pleural effusion lesions, presence of diffuse opacity in cases with multiple lung lobes (<2) involved. Abnormal lung CT findings can be present even in non-critical subjects and pure GGO was predominant lesion in this group. Having more mixed GGO with consolidation lesion, pleural effusion lesion, lack of pure GGO lesion, more diffuse opacity, involvement of more than 2 lobes and high opacity score on CT might be risk factors for prognosis in critical and death groups of patients with COVID-19 pneumonia.
Availability of data and materialsThe data are included in supplementary information files. The ID, age and gender information was removed to protect the patient privacy.
FundingThis study was performed in Gastroenterology and Liver Diseases Research Centre of Shahid Beheshti University of Medical Sciences and supported by grant number 23754.
Ethics declarationsThis retrospective study was approved by the Ethics Committee of Shahid Beheshti University of Medical Sciences, Tehran, Iran, with code: IR.SBMU.RIGLD.REC.1399.005.
Consent for publicationNone.
Conflict of interestNone declared.
Author's contributionConception and study design: Amir Vahedian-Azimi, Mohamad Amin Pourhoseingholi, Ramezan Jafari, Mohammad Reza Zali.
Data acquisition: Amir Vahedian-Azimi, Ramezan Jafari, Farshid R. Bashar.
Writing–original draft, editing and final approval: Sara Ashtari, Amir Vahedian-Azimi, Sajad Shojaee, Mohamad Amin Pourhoseingholi, Ramezan Jafari, Farshid R. Bashar, Mohammad Reza Zali.
We also appreciate for financial support, guidance and advice from the “Clinical Research Development Unit of Baqiyatallah Hospital.
Please cite this article as: Ashtari S, Vahedian-Azimi A, Shojaee S, Pourhoseingholi MA, Jafari R, Bashar FR, et al. Características tomográficas computarizadas de la neumonía por coronavirus-2019 (COVID-19) en tres grupos de pacientes iraníes: estudio de un solo centro. Radiología. 2021;63:314–323.

