


To analyze the profile of residency candidates choosing the specialty of diagnostic radiology in function of variables related to the positions available in different years.
Materials and methodsWe compiled the data published on the Spanish Ministry of Health's website during the acts celebrated to allow residency candidates to choose positions based on the results of the competitive examinations held from 2006 to 2015, comparing the specialty of diagnostic radiology with the other specialties available in terms of positions available, net questions, sex, nationality, and order of choice of the position.
ResultsThe specialty of diagnostic radiology occupied the 16th position in the ranking of specialties according to the median number of order in the choice for each of the positions offered in the years studied. The first diagnostic radiology residency position was usually assigned after 75 candidates had chosen other specialties, and the last position was usually assigned after 3700–4100 candidates had chosen their positions. During the period studied, of those who chose diagnostic radiology 58% were women and 76% were Spanish nationality. Candidates preferred hospitals in the Autonomous Community of Madrid, and the hospital chosen with the lowest median position (highest score on the competitive examination) was the Hospital Clínic de Barcelona.
ConclusionsDiagnostic radiology is chosen by candidates with good positioning in the ranking according to official examination results, is less likely than other specialties to be chosen by women, and is chosen mostly by Spanish physicians. Candidates prefer large hospitals in provincial capitals.
Analizar el perfil del opositor que ha escogido la especialidad de radiodiagnóstico, analizando variables relacionadas con las plazas convocadas a lo largo de la historia.
Material y métodosSe recogen los datos publicados por el Ministerio de Sanidad español en su página web durante los actos de elección de plaza en el examen MIR desde el año 2006 hasta 2015, comparando la especialidad de radiodiagnóstico con el resto de las ofertadas en términos de plaza, preguntas netas, sexo, nacionalidad y lugar de elección de la plaza.
ResultadosLa especialidad de radiodiagnóstico ocupa la posición número 16 en el ranking de especialidades ordenadas según la mediana de número de orden con la que se escogió cada una de sus plazas desde el año 2006 hasta 2015. La primera plaza se suele escoger por debajo del número de orden 75 y la elección de la especialidad se suele terminar entre los números de orden 3.700 y 4.100. Durante el periodo estudiado, un 58% de los electores de radiodiagnóstico fueron mujeres y un 76%, españoles. Los opositores prefieren los hospitales de la comunidad de Madrid, y el hospital elegido con la mediana más baja (mejor número de orden) es el Hospital Clínic de Barcelona.
ConclusionesRadiodiagnóstico se escoge en el MIR con buenos números de orden, con menor tendencia a ser elegida por mujeres que otras especialidades y escogida en su mayoría por médicos españoles. Se prefieren hospitales grandes en capitales de provincia.
In Spain, in order to be able to practice medicine, the college degree of Bachelor in Medicine and Surgery, Bachelor in Medical Science or degree in Medicine is needed. Since 1984 and as the only available way to be able to have access to specialized medical training it is mandatory to pass a nationwide access exam that the Ministry of Health, Social Services, and Equality announces every year. This exam is known as the MIR (Medical Residency Exam).1
Since 2009, the exam consists of 225 multiple choice test-like questions together with 10 reserve questions. Theoretically, the maximum number of net questions one candidate can take is 225, yet noone has ever been able to take more than 200 net questions. Net questions are those questions answered correctly in the exam minus one third of the amount of questions failed.1–3 The grade obtained in the exam (90 per cent of the final grade), added to the assessment of the scale or academic record (10 per cent of the final grade) is used to classify all candidates from first to last based on their respective scores. A higher total score equals a lower position in the classification, so candidate #1 will be the candidate with the highest final grade of all who will have earned the right to be the first one to choose his/her medical specialty among the different medical specialties available in the existing accredited academic institutions across the country.
Diagnostic radiology is one of these medical specialties since the MIR exam became a reality for choosing medical specialties back in the 1980s. The official denomination of this specialty – diagnostic radiology dates back to 1984 and is defined as that medical specialty based on imaging diagnoses aimed at achieving diagnostic impressions from macroscopic images of the inside of the body obtained using minimally or absolutely non invasive procedures that may include the use of different kinds of ionizing radiations and other types of power sources. Also, radiologists are responsible for what is known as the “method as the basis for the technique”’ that includes two different moments: choosing the most appropriate procedure (radiological technique) and acknowledging, analysing and interpreting the radiological signs.1,2
The main goal of this paper is to study what the profile of these candidates who choose the specialty of diagnostic radiology is by analysing the variables associated with the positions made available by the government from the very beginning, and the variables associated with the position within the MIR classification list that, in general, allowed the candidates to choose this specialty, based on sex, origin, hospital, and geographical region. The secondary goal of this paper is to compare the tendencies in the candidates’ profile with other published papers in other settings of similar profile,4–13 and make a correlation between them and surveys from the Spanish Ministry on specialists in medical training.14,15
Materials and methodsOne retrospective descriptive analysis was designed of the numbers of order, exam grade, age, sex, nationality of the candidaes and destination hospitals with the specialty of diagnostic radiology in the access test to the MIR medical residency exam announced publicly every year by the Spanish Ministries of Health and Education, from 2006 until present.
The denomination of the exam follows the nomenclature by the Spanish Ministry of Health including the year the exam was publicly announced - usually one year before taking the exam (the MIR medical residency exam 2015 took place in January, 2016). Data have been collected from the specialty choosing events published by the Ministry of Health in its official website after every annual public announcement.1 The “quota for foreign physicians” is the amount of total positions that can be assigned to non-EU physicians who are not sons or spouses of EU citizens, or who do not have a permit license, or are not EU residents.
Since some of the institutions that used to offer this specialty have changed along the study period–the names with which they appear within the specialty choosing lists published by the ministry, there have been times that certain institutions that were offered with a different denomination have been grouped under one single name, and this is the way they are shown both in the tables and the document herein.
The value of net questions needed to be able to choose diagnostic radiology, the average, maximum and minimum values, mean value, and percentiles 25 and 75 of the candidates’ order of choosing have been assessed by comparing the specialty of diagnostic radiology with the remaining specialties. This is an analysis of all positions segemented by institution and autonomous community. Both the demographical data and origin of the candidates have been collected too. The estimation of percentiles has been graded by weighted percentages and influenced by data distribution.
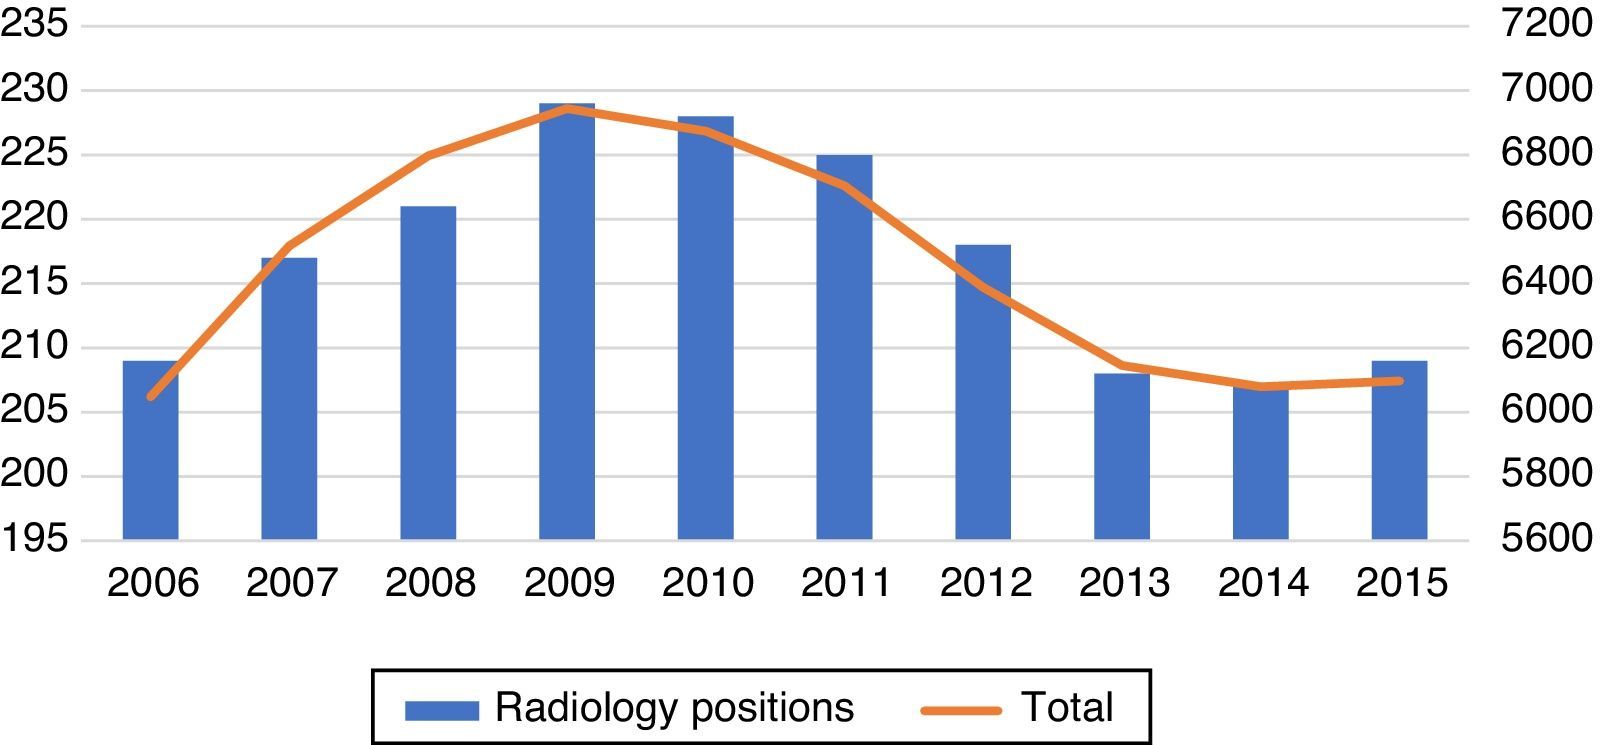
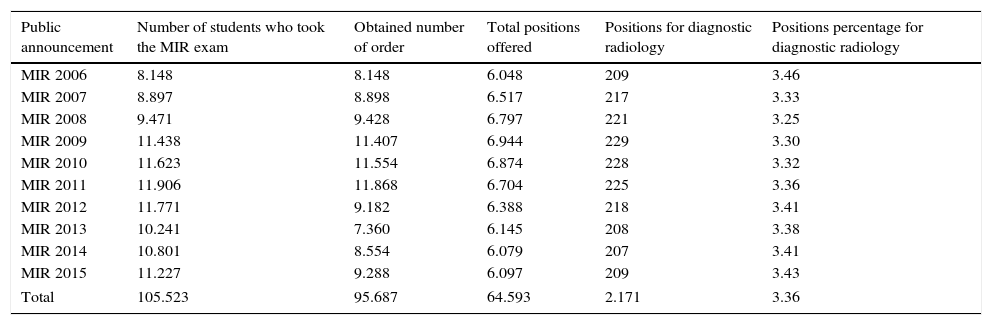
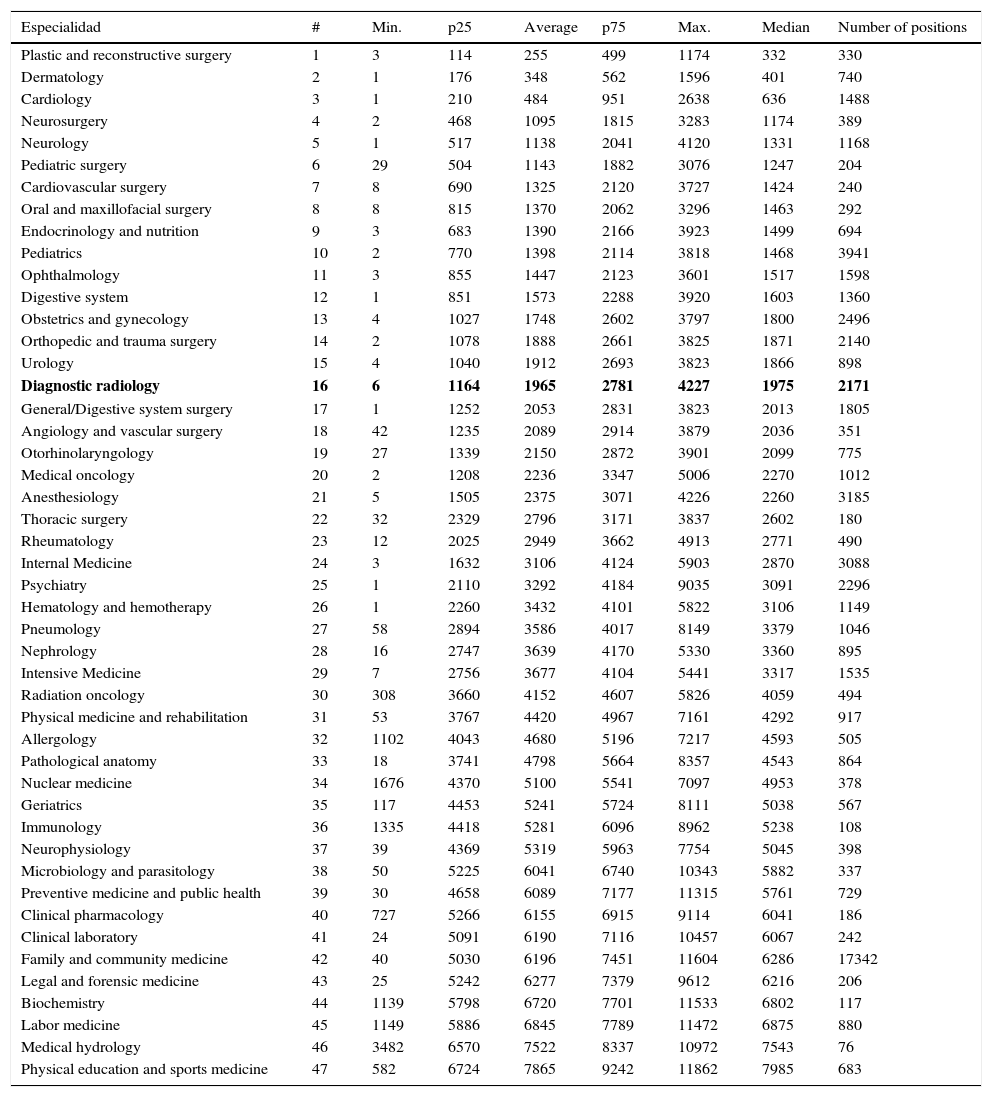
ResultsThe average of positions offered from 2006 though 2015, both inclusive, was 217.1; the year with the largest public offer was 2009 with 229 positions and the year with the smallest public offer was 2014 with 207 positions. The percentage of positions with respect to the total was 3.36 per cent and ranged between 3.25 per cent and 3.46 per cent depending on the year (Table 1, Fig. 1). In Spain, the specialty of diagnostic radiology ranks #8 in the list of medical specialities with the largest number of positions offered, with a total of 2171 in the 10 years studied (Table 2). The specialties that have ran out of positions during the specialty choosing events during the last 10 years have been plastic surgery, that was chosen with the lowest average number of order for choosing, 332, followed by dermatology, cardiology, and neurosurgery. Diagnostic radiology ranks #16 (of a total of 47 specialties, including the specialties offered by professional schools) with an average number of order for choosing of 1.965. This standing is maintained when the specialties are arranged according to percentiles 25, 50, or 75 of the numbers of order necessary to choose them (Table 2), or when the analysis is conducted only with the last MIR exam from 2015.
General data for the specialty of diagnostic radiology when choosing specialty from 2006 through 2015.
| Public announcement | Number of students who took the MIR exam | Obtained number of order | Total positions offered | Positions for diagnostic radiology | Positions percentage for diagnostic radiology |
|---|---|---|---|---|---|
| MIR 2006 | 8.148 | 8.148 | 6.048 | 209 | 3.46 |
| MIR 2007 | 8.897 | 8.898 | 6.517 | 217 | 3.33 |
| MIR 2008 | 9.471 | 9.428 | 6.797 | 221 | 3.25 |
| MIR 2009 | 11.438 | 11.407 | 6.944 | 229 | 3.30 |
| MIR 2010 | 11.623 | 11.554 | 6.874 | 228 | 3.32 |
| MIR 2011 | 11.906 | 11.868 | 6.704 | 225 | 3.36 |
| MIR 2012 | 11.771 | 9.182 | 6.388 | 218 | 3.41 |
| MIR 2013 | 10.241 | 7.360 | 6.145 | 208 | 3.38 |
| MIR 2014 | 10.801 | 8.554 | 6.079 | 207 | 3.41 |
| MIR 2015 | 11.227 | 9.288 | 6.097 | 209 | 3.43 |
| Total | 105.523 | 95.687 | 64.593 | 2.171 | 3.36 |
 and between 5600 and 7200 in the total of positions offered (right) in order to see the correlation between the variation of all the positions offered and the total of positions offered in diagnostic radiology only.")
Total of positions offered: progression of the public offer of diagnostic radiology positions in the MIR exam with respect to the total of positions offered. Notice data truncation in the axis of ordinates between 195 and 235 in diagnostic radiology positions (left) and between 5600 and 7200 in the total of positions offered (right) in order to see the correlation between the variation of all the positions offered and the total of positions offered in diagnostic radiology only.
Comparison among different specialties from 2006 through 2015.
| Especialidad | # | Min. | p25 | Average | p75 | Max. | Median | Number of positions |
|---|---|---|---|---|---|---|---|---|
| Plastic and reconstructive surgery | 1 | 3 | 114 | 255 | 499 | 1174 | 332 | 330 |
| Dermatology | 2 | 1 | 176 | 348 | 562 | 1596 | 401 | 740 |
| Cardiology | 3 | 1 | 210 | 484 | 951 | 2638 | 636 | 1488 |
| Neurosurgery | 4 | 2 | 468 | 1095 | 1815 | 3283 | 1174 | 389 |
| Neurology | 5 | 1 | 517 | 1138 | 2041 | 4120 | 1331 | 1168 |
| Pediatric surgery | 6 | 29 | 504 | 1143 | 1882 | 3076 | 1247 | 204 |
| Cardiovascular surgery | 7 | 8 | 690 | 1325 | 2120 | 3727 | 1424 | 240 |
| Oral and maxillofacial surgery | 8 | 8 | 815 | 1370 | 2062 | 3296 | 1463 | 292 |
| Endocrinology and nutrition | 9 | 3 | 683 | 1390 | 2166 | 3923 | 1499 | 694 |
| Pediatrics | 10 | 2 | 770 | 1398 | 2114 | 3818 | 1468 | 3941 |
| Ophthalmology | 11 | 3 | 855 | 1447 | 2123 | 3601 | 1517 | 1598 |
| Digestive system | 12 | 1 | 851 | 1573 | 2288 | 3920 | 1603 | 1360 |
| Obstetrics and gynecology | 13 | 4 | 1027 | 1748 | 2602 | 3797 | 1800 | 2496 |
| Orthopedic and trauma surgery | 14 | 2 | 1078 | 1888 | 2661 | 3825 | 1871 | 2140 |
| Urology | 15 | 4 | 1040 | 1912 | 2693 | 3823 | 1866 | 898 |
| Diagnostic radiology | 16 | 6 | 1164 | 1965 | 2781 | 4227 | 1975 | 2171 |
| General/Digestive system surgery | 17 | 1 | 1252 | 2053 | 2831 | 3823 | 2013 | 1805 |
| Angiology and vascular surgery | 18 | 42 | 1235 | 2089 | 2914 | 3879 | 2036 | 351 |
| Otorhinolaryngology | 19 | 27 | 1339 | 2150 | 2872 | 3901 | 2099 | 775 |
| Medical oncology | 20 | 2 | 1208 | 2236 | 3347 | 5006 | 2270 | 1012 |
| Anesthesiology | 21 | 5 | 1505 | 2375 | 3071 | 4226 | 2260 | 3185 |
| Thoracic surgery | 22 | 32 | 2329 | 2796 | 3171 | 3837 | 2602 | 180 |
| Rheumatology | 23 | 12 | 2025 | 2949 | 3662 | 4913 | 2771 | 490 |
| Internal Medicine | 24 | 3 | 1632 | 3106 | 4124 | 5903 | 2870 | 3088 |
| Psychiatry | 25 | 1 | 2110 | 3292 | 4184 | 9035 | 3091 | 2296 |
| Hematology and hemotherapy | 26 | 1 | 2260 | 3432 | 4101 | 5822 | 3106 | 1149 |
| Pneumology | 27 | 58 | 2894 | 3586 | 4017 | 8149 | 3379 | 1046 |
| Nephrology | 28 | 16 | 2747 | 3639 | 4170 | 5330 | 3360 | 895 |
| Intensive Medicine | 29 | 7 | 2756 | 3677 | 4104 | 5441 | 3317 | 1535 |
| Radiation oncology | 30 | 308 | 3660 | 4152 | 4607 | 5826 | 4059 | 494 |
| Physical medicine and rehabilitation | 31 | 53 | 3767 | 4420 | 4967 | 7161 | 4292 | 917 |
| Allergology | 32 | 1102 | 4043 | 4680 | 5196 | 7217 | 4593 | 505 |
| Pathological anatomy | 33 | 18 | 3741 | 4798 | 5664 | 8357 | 4543 | 864 |
| Nuclear medicine | 34 | 1676 | 4370 | 5100 | 5541 | 7097 | 4953 | 378 |
| Geriatrics | 35 | 117 | 4453 | 5241 | 5724 | 8111 | 5038 | 567 |
| Immunology | 36 | 1335 | 4418 | 5281 | 6096 | 8962 | 5238 | 108 |
| Neurophysiology | 37 | 39 | 4369 | 5319 | 5963 | 7754 | 5045 | 398 |
| Microbiology and parasitology | 38 | 50 | 5225 | 6041 | 6740 | 10343 | 5882 | 337 |
| Preventive medicine and public health | 39 | 30 | 4658 | 6089 | 7177 | 11315 | 5761 | 729 |
| Clinical pharmacology | 40 | 727 | 5266 | 6155 | 6915 | 9114 | 6041 | 186 |
| Clinical laboratory | 41 | 24 | 5091 | 6190 | 7116 | 10457 | 6067 | 242 |
| Family and community medicine | 42 | 40 | 5030 | 6196 | 7451 | 11604 | 6286 | 17342 |
| Legal and forensic medicine | 43 | 25 | 5242 | 6277 | 7379 | 9612 | 6216 | 206 |
| Biochemistry | 44 | 1139 | 5798 | 6720 | 7701 | 11533 | 6802 | 117 |
| Labor medicine | 45 | 1149 | 5886 | 6845 | 7789 | 11472 | 6875 | 880 |
| Medical hydrology | 46 | 3482 | 6570 | 7522 | 8337 | 10972 | 7543 | 76 |
| Physical education and sports medicine | 47 | 582 | 6724 | 7865 | 9242 | 11862 | 7985 | 683 |
The number of positions, the minimum and maximum numbers of positions, percentiles 25, 50, and 75, and average numbers are shown in this table. Specialties have been arranged based on the orden number average required to choose among such specialties from 2006 through 2015.
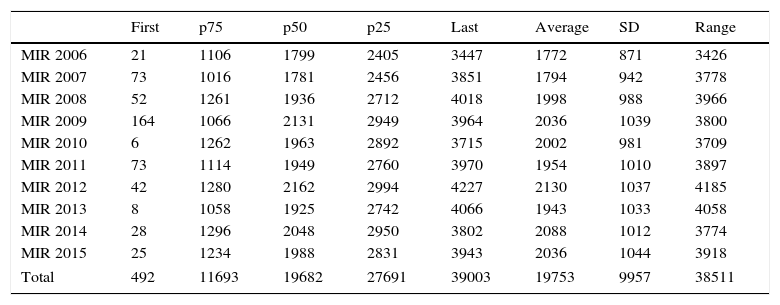
Between the years 2006 and 2015, the lowest number of order with which the specialty of diagnostic radiology was chosen was 6 in the year 2010, and the highest number of order was 4227 in the year 2012. The year with the lowest average number of order (1772) for choosing the specialty of diagnostic radiology was 2006, and the year with the highest average number of order (2130) was 2012. (Table 3).
Analysis of numbers of order needed to be able to choose the specialty of diagnostic radiology from 2006 through 2015.
| First | p75 | p50 | p25 | Last | Average | SD | Range | |
|---|---|---|---|---|---|---|---|---|
| MIR 2006 | 21 | 1106 | 1799 | 2405 | 3447 | 1772 | 871 | 3426 |
| MIR 2007 | 73 | 1016 | 1781 | 2456 | 3851 | 1794 | 942 | 3778 |
| MIR 2008 | 52 | 1261 | 1936 | 2712 | 4018 | 1998 | 988 | 3966 |
| MIR 2009 | 164 | 1066 | 2131 | 2949 | 3964 | 2036 | 1039 | 3800 |
| MIR 2010 | 6 | 1262 | 1963 | 2892 | 3715 | 2002 | 981 | 3709 |
| MIR 2011 | 73 | 1114 | 1949 | 2760 | 3970 | 1954 | 1010 | 3897 |
| MIR 2012 | 42 | 1280 | 2162 | 2994 | 4227 | 2130 | 1037 | 4185 |
| MIR 2013 | 8 | 1058 | 1925 | 2742 | 4066 | 1943 | 1033 | 4058 |
| MIR 2014 | 28 | 1296 | 2048 | 2950 | 3802 | 2088 | 1012 | 3774 |
| MIR 2015 | 25 | 1234 | 1988 | 2831 | 3943 | 2036 | 1044 | 3918 |
| Total | 492 | 11693 | 19682 | 27691 | 39003 | 19753 | 9957 | 38511 |
SD: standard deviation.
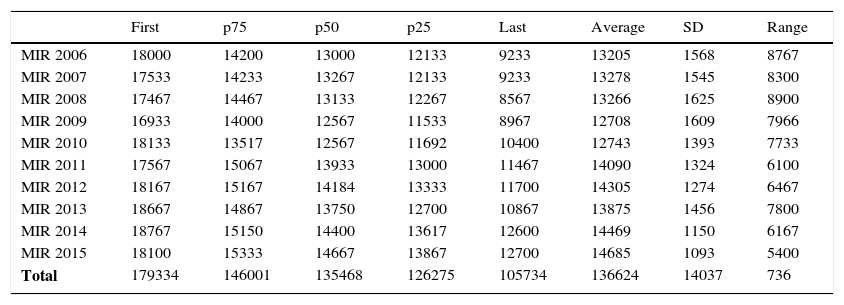
With respect to net questions, right questions answered minus one third of the questions failed, and using as a reference a 10 year statistics average, the specialty of diagnostic radiology may be chosen starting at 179.3 nets questions all the way through 105.7 net questions. The year 2014 was the year when this specialty was chosen with the highest score of net questions, 187.67 and the year 2008 when the last position in this specialty was chosen with the lowest score of net questions, 85.67 (Table 4).
Analysis of the amount of net questions, and correct questions minus one third of the amount of questions failed with which the specialty of diagnostic radiology was chosen from 2006 through 2015.
| First | p75 | p50 | p25 | Last | Average | SD | Range | |
|---|---|---|---|---|---|---|---|---|
| MIR 2006 | 18000 | 14200 | 13000 | 12133 | 9233 | 13205 | 1568 | 8767 |
| MIR 2007 | 17533 | 14233 | 13267 | 12133 | 9233 | 13278 | 1545 | 8300 |
| MIR 2008 | 17467 | 14467 | 13133 | 12267 | 8567 | 13266 | 1625 | 8900 |
| MIR 2009 | 16933 | 14000 | 12567 | 11533 | 8967 | 12708 | 1609 | 7966 |
| MIR 2010 | 18133 | 13517 | 12567 | 11692 | 10400 | 12743 | 1393 | 7733 |
| MIR 2011 | 17567 | 15067 | 13933 | 13000 | 11467 | 14090 | 1324 | 6100 |
| MIR 2012 | 18167 | 15167 | 14184 | 13333 | 11700 | 14305 | 1274 | 6467 |
| MIR 2013 | 18667 | 14867 | 13750 | 12700 | 10867 | 13875 | 1456 | 7800 |
| MIR 2014 | 18767 | 15150 | 14400 | 13617 | 12600 | 14469 | 1150 | 6167 |
| MIR 2015 | 18100 | 15333 | 14667 | 13867 | 12700 | 14685 | 1093 | 5400 |
| Total | 179334 | 146001 | 135468 | 126275 | 105734 | 136624 | 14037 | 736 |
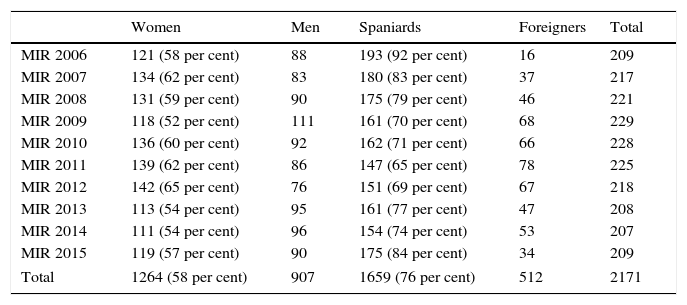
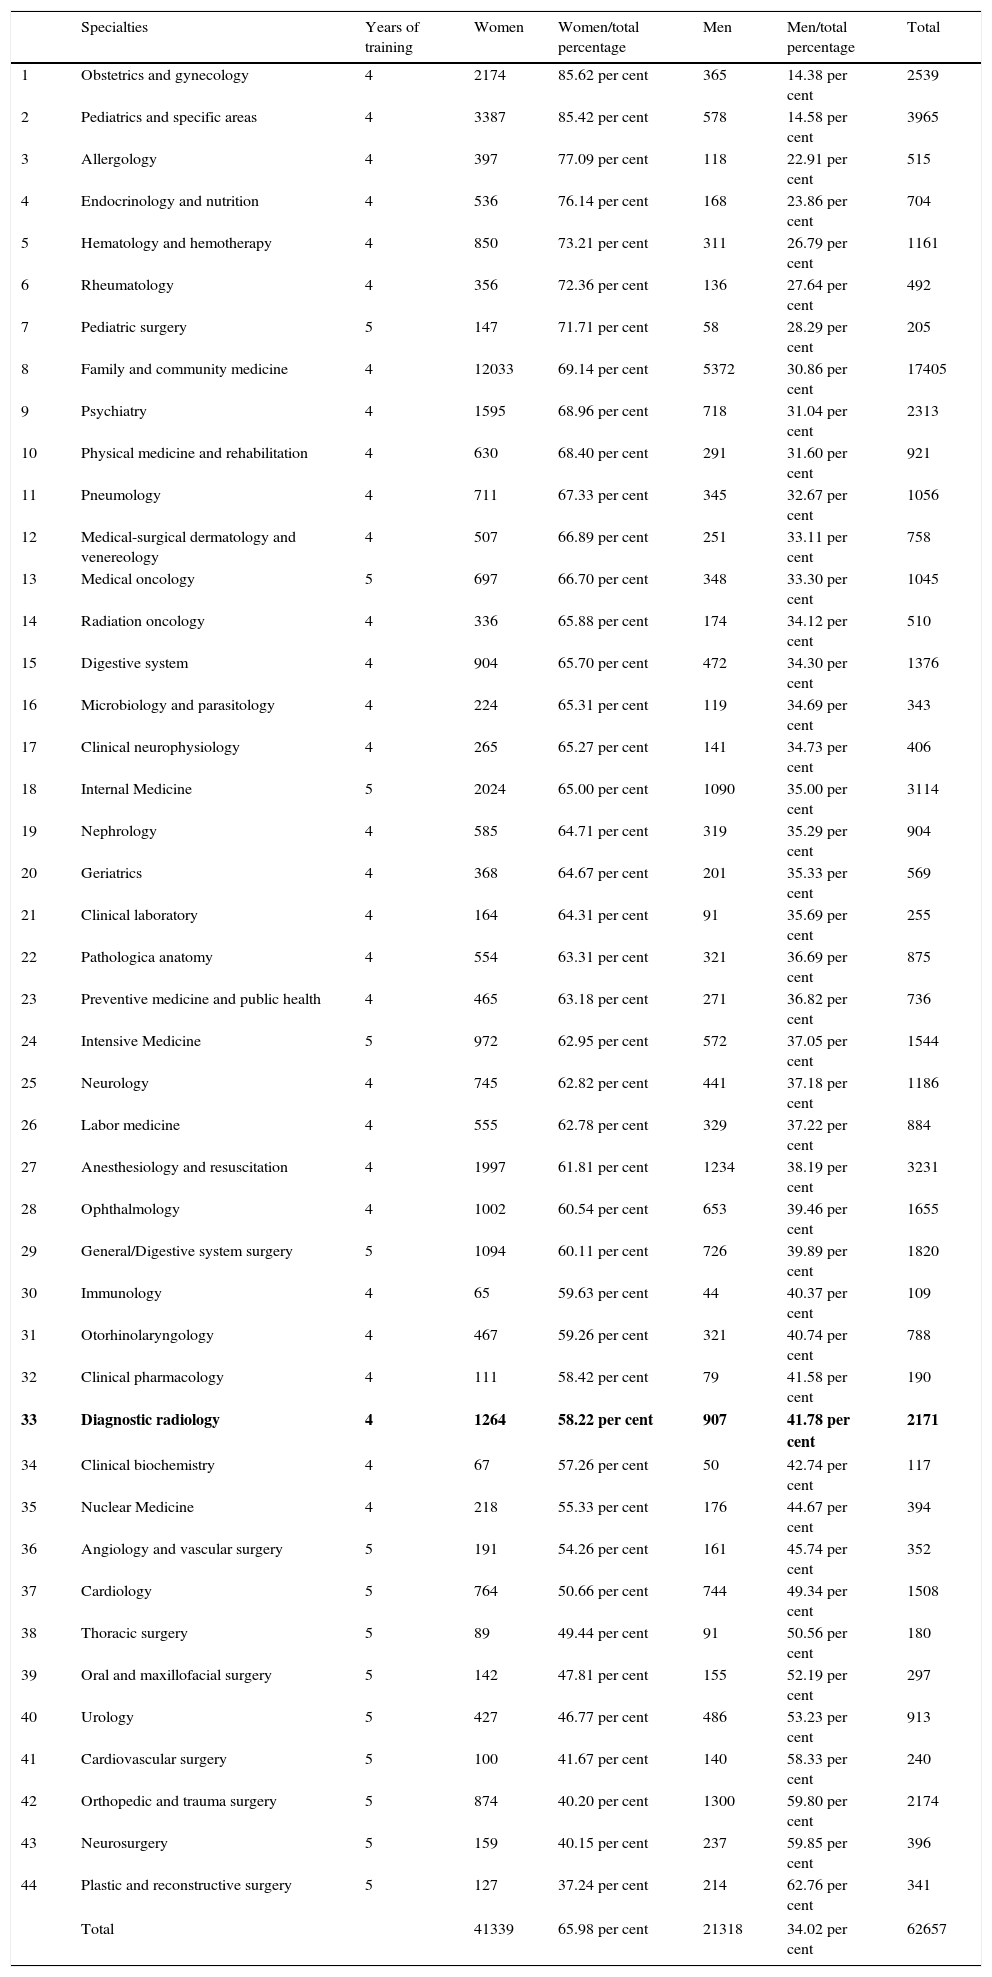
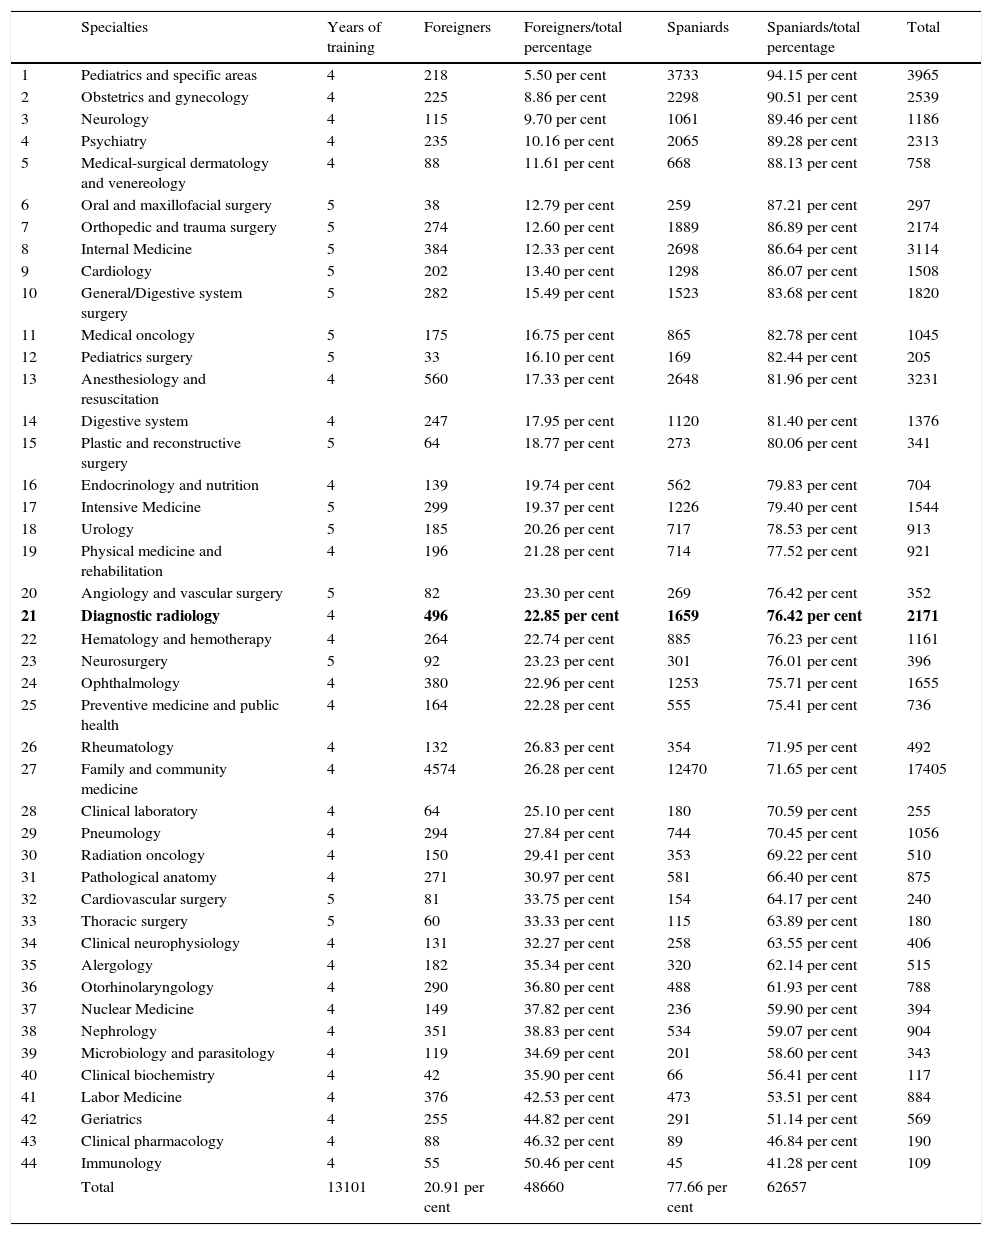
When it comes to analysing the positions chosen in diagnostic radiology according to sex and origin of the candidates, during the last ten (10) years, 58.22 per cent of the candidates have been women and 76.42 per cent of the candidates have been Spanish physicians. The year with the largest amount of women was 2012 with 65 per cent, and the year with the largest amount of Spanish physicians was 2006 with 92 per cent. The year 2009 was the year with the lowest percentage of women (52 per cent) and 2011 was the year with the lowest amount of Spanish physicians (65 per cent) (Table 5). The specialty of diagnostic radiology ranks #33 in the ranking of specialties arranged by highest percentage of women, and ranks #21 in the ranking of specialties arranged by highest percentage of foreign physicians (Tables 6 and 7).
Analysis of candidates who chose the specialty of diagnostic radiology based on sex and nationality (Spanish or foreign physicians).
| Women | Men | Spaniards | Foreigners | Total | |
|---|---|---|---|---|---|
| MIR 2006 | 121 (58 per cent) | 88 | 193 (92 per cent) | 16 | 209 |
| MIR 2007 | 134 (62 per cent) | 83 | 180 (83 per cent) | 37 | 217 |
| MIR 2008 | 131 (59 per cent) | 90 | 175 (79 per cent) | 46 | 221 |
| MIR 2009 | 118 (52 per cent) | 111 | 161 (70 per cent) | 68 | 229 |
| MIR 2010 | 136 (60 per cent) | 92 | 162 (71 per cent) | 66 | 228 |
| MIR 2011 | 139 (62 per cent) | 86 | 147 (65 per cent) | 78 | 225 |
| MIR 2012 | 142 (65 per cent) | 76 | 151 (69 per cent) | 67 | 218 |
| MIR 2013 | 113 (54 per cent) | 95 | 161 (77 per cent) | 47 | 208 |
| MIR 2014 | 111 (54 per cent) | 96 | 154 (74 per cent) | 53 | 207 |
| MIR 2015 | 119 (57 per cent) | 90 | 175 (84 per cent) | 34 | 209 |
| Total | 1264 (58 per cent) | 907 | 1659 (76 per cent) | 512 | 2171 |
Classification of medical specialties arranged according the percentage of candidates who chose them in the 10 years of study. Diagnostic radiology ranks #33 with an average 58.26 per cent of women among the candidates.
| Specialties | Years of training | Women | Women/total percentage | Men | Men/total percentage | Total | |
|---|---|---|---|---|---|---|---|
| 1 | Obstetrics and gynecology | 4 | 2174 | 85.62 per cent | 365 | 14.38 per cent | 2539 |
| 2 | Pediatrics and specific areas | 4 | 3387 | 85.42 per cent | 578 | 14.58 per cent | 3965 |
| 3 | Allergology | 4 | 397 | 77.09 per cent | 118 | 22.91 per cent | 515 |
| 4 | Endocrinology and nutrition | 4 | 536 | 76.14 per cent | 168 | 23.86 per cent | 704 |
| 5 | Hematology and hemotherapy | 4 | 850 | 73.21 per cent | 311 | 26.79 per cent | 1161 |
| 6 | Rheumatology | 4 | 356 | 72.36 per cent | 136 | 27.64 per cent | 492 |
| 7 | Pediatric surgery | 5 | 147 | 71.71 per cent | 58 | 28.29 per cent | 205 |
| 8 | Family and community medicine | 4 | 12033 | 69.14 per cent | 5372 | 30.86 per cent | 17405 |
| 9 | Psychiatry | 4 | 1595 | 68.96 per cent | 718 | 31.04 per cent | 2313 |
| 10 | Physical medicine and rehabilitation | 4 | 630 | 68.40 per cent | 291 | 31.60 per cent | 921 |
| 11 | Pneumology | 4 | 711 | 67.33 per cent | 345 | 32.67 per cent | 1056 |
| 12 | Medical-surgical dermatology and venereology | 4 | 507 | 66.89 per cent | 251 | 33.11 per cent | 758 |
| 13 | Medical oncology | 5 | 697 | 66.70 per cent | 348 | 33.30 per cent | 1045 |
| 14 | Radiation oncology | 4 | 336 | 65.88 per cent | 174 | 34.12 per cent | 510 |
| 15 | Digestive system | 4 | 904 | 65.70 per cent | 472 | 34.30 per cent | 1376 |
| 16 | Microbiology and parasitology | 4 | 224 | 65.31 per cent | 119 | 34.69 per cent | 343 |
| 17 | Clinical neurophysiology | 4 | 265 | 65.27 per cent | 141 | 34.73 per cent | 406 |
| 18 | Internal Medicine | 5 | 2024 | 65.00 per cent | 1090 | 35.00 per cent | 3114 |
| 19 | Nephrology | 4 | 585 | 64.71 per cent | 319 | 35.29 per cent | 904 |
| 20 | Geriatrics | 4 | 368 | 64.67 per cent | 201 | 35.33 per cent | 569 |
| 21 | Clinical laboratory | 4 | 164 | 64.31 per cent | 91 | 35.69 per cent | 255 |
| 22 | Pathologica anatomy | 4 | 554 | 63.31 per cent | 321 | 36.69 per cent | 875 |
| 23 | Preventive medicine and public health | 4 | 465 | 63.18 per cent | 271 | 36.82 per cent | 736 |
| 24 | Intensive Medicine | 5 | 972 | 62.95 per cent | 572 | 37.05 per cent | 1544 |
| 25 | Neurology | 4 | 745 | 62.82 per cent | 441 | 37.18 per cent | 1186 |
| 26 | Labor medicine | 4 | 555 | 62.78 per cent | 329 | 37.22 per cent | 884 |
| 27 | Anesthesiology and resuscitation | 4 | 1997 | 61.81 per cent | 1234 | 38.19 per cent | 3231 |
| 28 | Ophthalmology | 4 | 1002 | 60.54 per cent | 653 | 39.46 per cent | 1655 |
| 29 | General/Digestive system surgery | 5 | 1094 | 60.11 per cent | 726 | 39.89 per cent | 1820 |
| 30 | Immunology | 4 | 65 | 59.63 per cent | 44 | 40.37 per cent | 109 |
| 31 | Otorhinolaryngology | 4 | 467 | 59.26 per cent | 321 | 40.74 per cent | 788 |
| 32 | Clinical pharmacology | 4 | 111 | 58.42 per cent | 79 | 41.58 per cent | 190 |
| 33 | Diagnostic radiology | 4 | 1264 | 58.22 per cent | 907 | 41.78 per cent | 2171 |
| 34 | Clinical biochemistry | 4 | 67 | 57.26 per cent | 50 | 42.74 per cent | 117 |
| 35 | Nuclear Medicine | 4 | 218 | 55.33 per cent | 176 | 44.67 per cent | 394 |
| 36 | Angiology and vascular surgery | 5 | 191 | 54.26 per cent | 161 | 45.74 per cent | 352 |
| 37 | Cardiology | 5 | 764 | 50.66 per cent | 744 | 49.34 per cent | 1508 |
| 38 | Thoracic surgery | 5 | 89 | 49.44 per cent | 91 | 50.56 per cent | 180 |
| 39 | Oral and maxillofacial surgery | 5 | 142 | 47.81 per cent | 155 | 52.19 per cent | 297 |
| 40 | Urology | 5 | 427 | 46.77 per cent | 486 | 53.23 per cent | 913 |
| 41 | Cardiovascular surgery | 5 | 100 | 41.67 per cent | 140 | 58.33 per cent | 240 |
| 42 | Orthopedic and trauma surgery | 5 | 874 | 40.20 per cent | 1300 | 59.80 per cent | 2174 |
| 43 | Neurosurgery | 5 | 159 | 40.15 per cent | 237 | 59.85 per cent | 396 |
| 44 | Plastic and reconstructive surgery | 5 | 127 | 37.24 per cent | 214 | 62.76 per cent | 341 |
| Total | 41339 | 65.98 per cent | 21318 | 34.02 per cent | 62657 | ||
Absolute and relative values of the positions adjudicated to the different medical specialties on grouds of public demand arranged from the lowest to the highest percentage of foreign physicians among the candidates (from the public announcement made in 2006 until the public announcement made in 2015).
| Specialties | Years of training | Foreigners | Foreigners/total percentage | Spaniards | Spaniards/total percentage | Total | |
|---|---|---|---|---|---|---|---|
| 1 | Pediatrics and specific areas | 4 | 218 | 5.50 per cent | 3733 | 94.15 per cent | 3965 |
| 2 | Obstetrics and gynecology | 4 | 225 | 8.86 per cent | 2298 | 90.51 per cent | 2539 |
| 3 | Neurology | 4 | 115 | 9.70 per cent | 1061 | 89.46 per cent | 1186 |
| 4 | Psychiatry | 4 | 235 | 10.16 per cent | 2065 | 89.28 per cent | 2313 |
| 5 | Medical-surgical dermatology and venereology | 4 | 88 | 11.61 per cent | 668 | 88.13 per cent | 758 |
| 6 | Oral and maxillofacial surgery | 5 | 38 | 12.79 per cent | 259 | 87.21 per cent | 297 |
| 7 | Orthopedic and trauma surgery | 5 | 274 | 12.60 per cent | 1889 | 86.89 per cent | 2174 |
| 8 | Internal Medicine | 5 | 384 | 12.33 per cent | 2698 | 86.64 per cent | 3114 |
| 9 | Cardiology | 5 | 202 | 13.40 per cent | 1298 | 86.07 per cent | 1508 |
| 10 | General/Digestive system surgery | 5 | 282 | 15.49 per cent | 1523 | 83.68 per cent | 1820 |
| 11 | Medical oncology | 5 | 175 | 16.75 per cent | 865 | 82.78 per cent | 1045 |
| 12 | Pediatrics surgery | 5 | 33 | 16.10 per cent | 169 | 82.44 per cent | 205 |
| 13 | Anesthesiology and resuscitation | 4 | 560 | 17.33 per cent | 2648 | 81.96 per cent | 3231 |
| 14 | Digestive system | 4 | 247 | 17.95 per cent | 1120 | 81.40 per cent | 1376 |
| 15 | Plastic and reconstructive surgery | 5 | 64 | 18.77 per cent | 273 | 80.06 per cent | 341 |
| 16 | Endocrinology and nutrition | 4 | 139 | 19.74 per cent | 562 | 79.83 per cent | 704 |
| 17 | Intensive Medicine | 5 | 299 | 19.37 per cent | 1226 | 79.40 per cent | 1544 |
| 18 | Urology | 5 | 185 | 20.26 per cent | 717 | 78.53 per cent | 913 |
| 19 | Physical medicine and rehabilitation | 4 | 196 | 21.28 per cent | 714 | 77.52 per cent | 921 |
| 20 | Angiology and vascular surgery | 5 | 82 | 23.30 per cent | 269 | 76.42 per cent | 352 |
| 21 | Diagnostic radiology | 4 | 496 | 22.85 per cent | 1659 | 76.42 per cent | 2171 |
| 22 | Hematology and hemotherapy | 4 | 264 | 22.74 per cent | 885 | 76.23 per cent | 1161 |
| 23 | Neurosurgery | 5 | 92 | 23.23 per cent | 301 | 76.01 per cent | 396 |
| 24 | Ophthalmology | 4 | 380 | 22.96 per cent | 1253 | 75.71 per cent | 1655 |
| 25 | Preventive medicine and public health | 4 | 164 | 22.28 per cent | 555 | 75.41 per cent | 736 |
| 26 | Rheumatology | 4 | 132 | 26.83 per cent | 354 | 71.95 per cent | 492 |
| 27 | Family and community medicine | 4 | 4574 | 26.28 per cent | 12470 | 71.65 per cent | 17405 |
| 28 | Clinical laboratory | 4 | 64 | 25.10 per cent | 180 | 70.59 per cent | 255 |
| 29 | Pneumology | 4 | 294 | 27.84 per cent | 744 | 70.45 per cent | 1056 |
| 30 | Radiation oncology | 4 | 150 | 29.41 per cent | 353 | 69.22 per cent | 510 |
| 31 | Pathological anatomy | 4 | 271 | 30.97 per cent | 581 | 66.40 per cent | 875 |
| 32 | Cardiovascular surgery | 5 | 81 | 33.75 per cent | 154 | 64.17 per cent | 240 |
| 33 | Thoracic surgery | 5 | 60 | 33.33 per cent | 115 | 63.89 per cent | 180 |
| 34 | Clinical neurophysiology | 4 | 131 | 32.27 per cent | 258 | 63.55 per cent | 406 |
| 35 | Alergology | 4 | 182 | 35.34 per cent | 320 | 62.14 per cent | 515 |
| 36 | Otorhinolaryngology | 4 | 290 | 36.80 per cent | 488 | 61.93 per cent | 788 |
| 37 | Nuclear Medicine | 4 | 149 | 37.82 per cent | 236 | 59.90 per cent | 394 |
| 38 | Nephrology | 4 | 351 | 38.83 per cent | 534 | 59.07 per cent | 904 |
| 39 | Microbiology and parasitology | 4 | 119 | 34.69 per cent | 201 | 58.60 per cent | 343 |
| 40 | Clinical biochemistry | 4 | 42 | 35.90 per cent | 66 | 56.41 per cent | 117 |
| 41 | Labor Medicine | 4 | 376 | 42.53 per cent | 473 | 53.51 per cent | 884 |
| 42 | Geriatrics | 4 | 255 | 44.82 per cent | 291 | 51.14 per cent | 569 |
| 43 | Clinical pharmacology | 4 | 88 | 46.32 per cent | 89 | 46.84 per cent | 190 |
| 44 | Immunology | 4 | 55 | 50.46 per cent | 45 | 41.28 per cent | 109 |
| Total | 13101 | 20.91 per cent | 48660 | 77.66 per cent | 62657 | ||
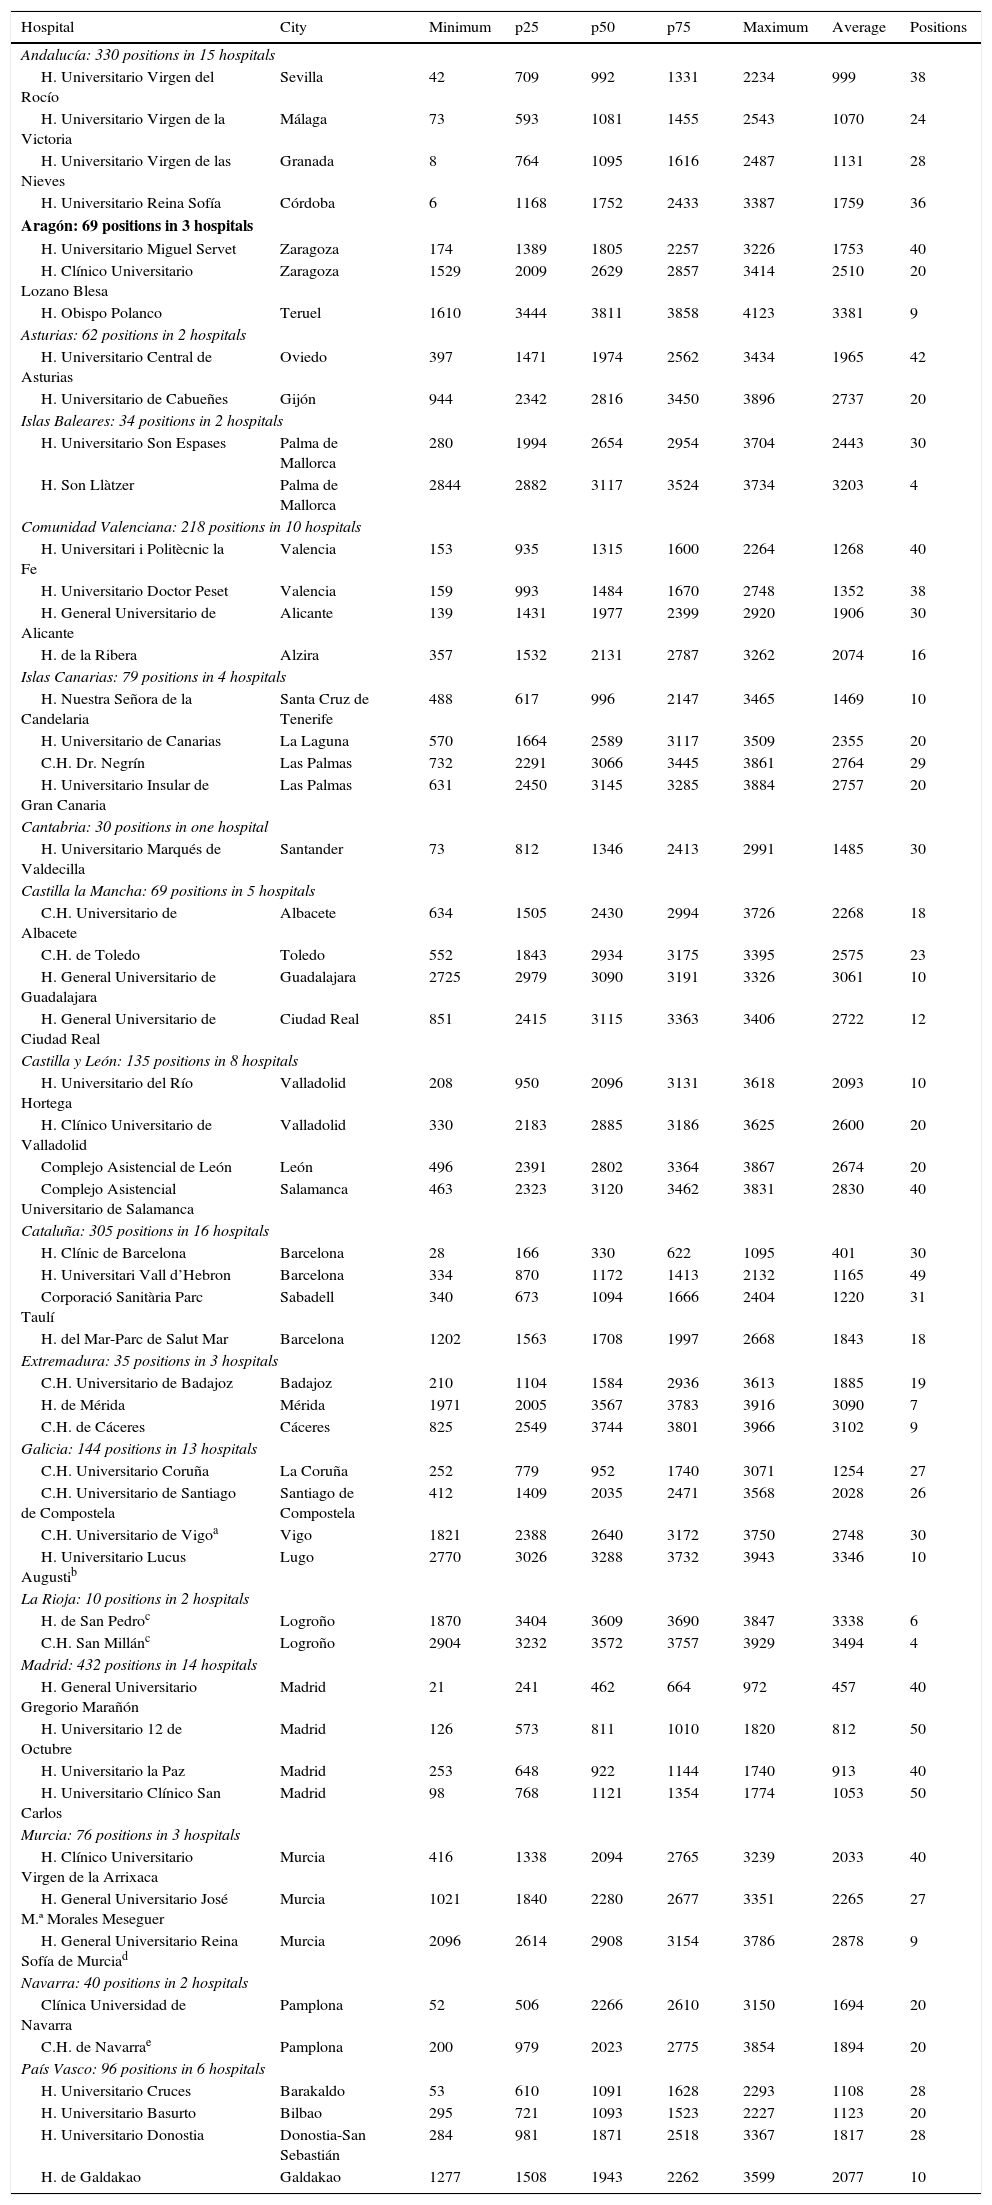
The autonomous community that has offered the largest amount of positions for the specialty of diagnostic radiology from 2006 through 2015 has been Madrid with 432 (20 per cent), followed by Andalucía with 330 (15 per cent), and Catalonia with 305 (14 per cent) (Table 8).
Data based on the choosing process and arranged by autonomous community and hospital in the present study.
| Hospital | City | Minimum | p25 | p50 | p75 | Maximum | Average | Positions |
|---|---|---|---|---|---|---|---|---|
| Andalucía: 330 positions in 15 hospitals | ||||||||
| H. Universitario Virgen del Rocío | Sevilla | 42 | 709 | 992 | 1331 | 2234 | 999 | 38 |
| H. Universitario Virgen de la Victoria | Málaga | 73 | 593 | 1081 | 1455 | 2543 | 1070 | 24 |
| H. Universitario Virgen de las Nieves | Granada | 8 | 764 | 1095 | 1616 | 2487 | 1131 | 28 |
| H. Universitario Reina Sofía | Córdoba | 6 | 1168 | 1752 | 2433 | 3387 | 1759 | 36 |
| Aragón: 69 positions in 3 hospitals | ||||||||
| H. Universitario Miguel Servet | Zaragoza | 174 | 1389 | 1805 | 2257 | 3226 | 1753 | 40 |
| H. Clínico Universitario Lozano Blesa | Zaragoza | 1529 | 2009 | 2629 | 2857 | 3414 | 2510 | 20 |
| H. Obispo Polanco | Teruel | 1610 | 3444 | 3811 | 3858 | 4123 | 3381 | 9 |
| Asturias: 62 positions in 2 hospitals | ||||||||
| H. Universitario Central de Asturias | Oviedo | 397 | 1471 | 1974 | 2562 | 3434 | 1965 | 42 |
| H. Universitario de Cabueñes | Gijón | 944 | 2342 | 2816 | 3450 | 3896 | 2737 | 20 |
| Islas Baleares: 34 positions in 2 hospitals | ||||||||
| H. Universitario Son Espases | Palma de Mallorca | 280 | 1994 | 2654 | 2954 | 3704 | 2443 | 30 |
| H. Son Llàtzer | Palma de Mallorca | 2844 | 2882 | 3117 | 3524 | 3734 | 3203 | 4 |
| Comunidad Valenciana: 218 positions in 10 hospitals | ||||||||
| H. Universitari i Politècnic la Fe | Valencia | 153 | 935 | 1315 | 1600 | 2264 | 1268 | 40 |
| H. Universitario Doctor Peset | Valencia | 159 | 993 | 1484 | 1670 | 2748 | 1352 | 38 |
| H. General Universitario de Alicante | Alicante | 139 | 1431 | 1977 | 2399 | 2920 | 1906 | 30 |
| H. de la Ribera | Alzira | 357 | 1532 | 2131 | 2787 | 3262 | 2074 | 16 |
| Islas Canarias: 79 positions in 4 hospitals | ||||||||
| H. Nuestra Señora de la Candelaria | Santa Cruz de Tenerife | 488 | 617 | 996 | 2147 | 3465 | 1469 | 10 |
| H. Universitario de Canarias | La Laguna | 570 | 1664 | 2589 | 3117 | 3509 | 2355 | 20 |
| C.H. Dr. Negrín | Las Palmas | 732 | 2291 | 3066 | 3445 | 3861 | 2764 | 29 |
| H. Universitario Insular de Gran Canaria | Las Palmas | 631 | 2450 | 3145 | 3285 | 3884 | 2757 | 20 |
| Cantabria: 30 positions in one hospital | ||||||||
| H. Universitario Marqués de Valdecilla | Santander | 73 | 812 | 1346 | 2413 | 2991 | 1485 | 30 |
| Castilla la Mancha: 69 positions in 5 hospitals | ||||||||
| C.H. Universitario de Albacete | Albacete | 634 | 1505 | 2430 | 2994 | 3726 | 2268 | 18 |
| C.H. de Toledo | Toledo | 552 | 1843 | 2934 | 3175 | 3395 | 2575 | 23 |
| H. General Universitario de Guadalajara | Guadalajara | 2725 | 2979 | 3090 | 3191 | 3326 | 3061 | 10 |
| H. General Universitario de Ciudad Real | Ciudad Real | 851 | 2415 | 3115 | 3363 | 3406 | 2722 | 12 |
| Castilla y León: 135 positions in 8 hospitals | ||||||||
| H. Universitario del Río Hortega | Valladolid | 208 | 950 | 2096 | 3131 | 3618 | 2093 | 10 |
| H. Clínico Universitario de Valladolid | Valladolid | 330 | 2183 | 2885 | 3186 | 3625 | 2600 | 20 |
| Complejo Asistencial de León | León | 496 | 2391 | 2802 | 3364 | 3867 | 2674 | 20 |
| Complejo Asistencial Universitario de Salamanca | Salamanca | 463 | 2323 | 3120 | 3462 | 3831 | 2830 | 40 |
| Cataluña: 305 positions in 16 hospitals | ||||||||
| H. Clínic de Barcelona | Barcelona | 28 | 166 | 330 | 622 | 1095 | 401 | 30 |
| H. Universitari Vall d’Hebron | Barcelona | 334 | 870 | 1172 | 1413 | 2132 | 1165 | 49 |
| Corporació Sanitària Parc Taulí | Sabadell | 340 | 673 | 1094 | 1666 | 2404 | 1220 | 31 |
| H. del Mar-Parc de Salut Mar | Barcelona | 1202 | 1563 | 1708 | 1997 | 2668 | 1843 | 18 |
| Extremadura: 35 positions in 3 hospitals | ||||||||
| C.H. Universitario de Badajoz | Badajoz | 210 | 1104 | 1584 | 2936 | 3613 | 1885 | 19 |
| H. de Mérida | Mérida | 1971 | 2005 | 3567 | 3783 | 3916 | 3090 | 7 |
| C.H. de Cáceres | Cáceres | 825 | 2549 | 3744 | 3801 | 3966 | 3102 | 9 |
| Galicia: 144 positions in 13 hospitals | ||||||||
| C.H. Universitario Coruña | La Coruña | 252 | 779 | 952 | 1740 | 3071 | 1254 | 27 |
| C.H. Universitario de Santiago de Compostela | Santiago de Compostela | 412 | 1409 | 2035 | 2471 | 3568 | 2028 | 26 |
| C.H. Universitario de Vigoa | Vigo | 1821 | 2388 | 2640 | 3172 | 3750 | 2748 | 30 |
| H. Universitario Lucus Augustib | Lugo | 2770 | 3026 | 3288 | 3732 | 3943 | 3346 | 10 |
| La Rioja: 10 positions in 2 hospitals | ||||||||
| H. de San Pedroc | Logroño | 1870 | 3404 | 3609 | 3690 | 3847 | 3338 | 6 |
| C.H. San Millánc | Logroño | 2904 | 3232 | 3572 | 3757 | 3929 | 3494 | 4 |
| Madrid: 432 positions in 14 hospitals | ||||||||
| H. General Universitario Gregorio Marañón | Madrid | 21 | 241 | 462 | 664 | 972 | 457 | 40 |
| H. Universitario 12 de Octubre | Madrid | 126 | 573 | 811 | 1010 | 1820 | 812 | 50 |
| H. Universitario la Paz | Madrid | 253 | 648 | 922 | 1144 | 1740 | 913 | 40 |
| H. Universitario Clínico San Carlos | Madrid | 98 | 768 | 1121 | 1354 | 1774 | 1053 | 50 |
| Murcia: 76 positions in 3 hospitals | ||||||||
| H. Clínico Universitario Virgen de la Arrixaca | Murcia | 416 | 1338 | 2094 | 2765 | 3239 | 2033 | 40 |
| H. General Universitario José M.ª Morales Meseguer | Murcia | 1021 | 1840 | 2280 | 2677 | 3351 | 2265 | 27 |
| H. General Universitario Reina Sofía de Murciad | Murcia | 2096 | 2614 | 2908 | 3154 | 3786 | 2878 | 9 |
| Navarra: 40 positions in 2 hospitals | ||||||||
| Clínica Universidad de Navarra | Pamplona | 52 | 506 | 2266 | 2610 | 3150 | 1694 | 20 |
| C.H. de Navarrae | Pamplona | 200 | 979 | 2023 | 2775 | 3854 | 1894 | 20 |
| País Vasco: 96 positions in 6 hospitals | ||||||||
| H. Universitario Cruces | Barakaldo | 53 | 610 | 1091 | 1628 | 2293 | 1108 | 28 |
| H. Universitario Basurto | Bilbao | 295 | 721 | 1093 | 1523 | 2227 | 1123 | 20 |
| H. Universitario Donostia | Donostia-San Sebastián | 284 | 981 | 1871 | 2518 | 3367 | 1817 | 28 |
| H. de Galdakao | Galdakao | 1277 | 1508 | 1943 | 2262 | 3599 | 2077 | 10 |
Here follows data from a 10 year study of hospitals with the lowest mean of position choosing in every autonomous community with a maximum of 4 hospitals. C.H.U.: Complejo Hospitalario Universitario; H., hospital; #, total amount of positions offered in this period; p25, percentile 25; p75, percentile 75; the name of each training center as provided by the Ministry in its public offering with the following center group is the name that has been taken into consideration:
Vigo has experienced the merge of various hospitals with several changes in the denomination of public hospitals and the training offer for the candidates, so for better clarification purposes, the positions offer has beed divided based on whether such offer comes from the Hospital Policlínico de Vigo (POVISA) or the Complejo Hospitalario Universidad de Vigo – including the offer by the Xeral-Cíes and Meixoeiro hospitals.
In Lugo, the actual Hospital Universitario Lucus Augusti is referred to in the public announcements as C.H. Universitario Xeral–Calde de Lugo.
C.H. San Millán and H. de San Pedro should be considered as the same hospital due to name change; consequently the autonomous community of La Rioja has had one resident per year only.
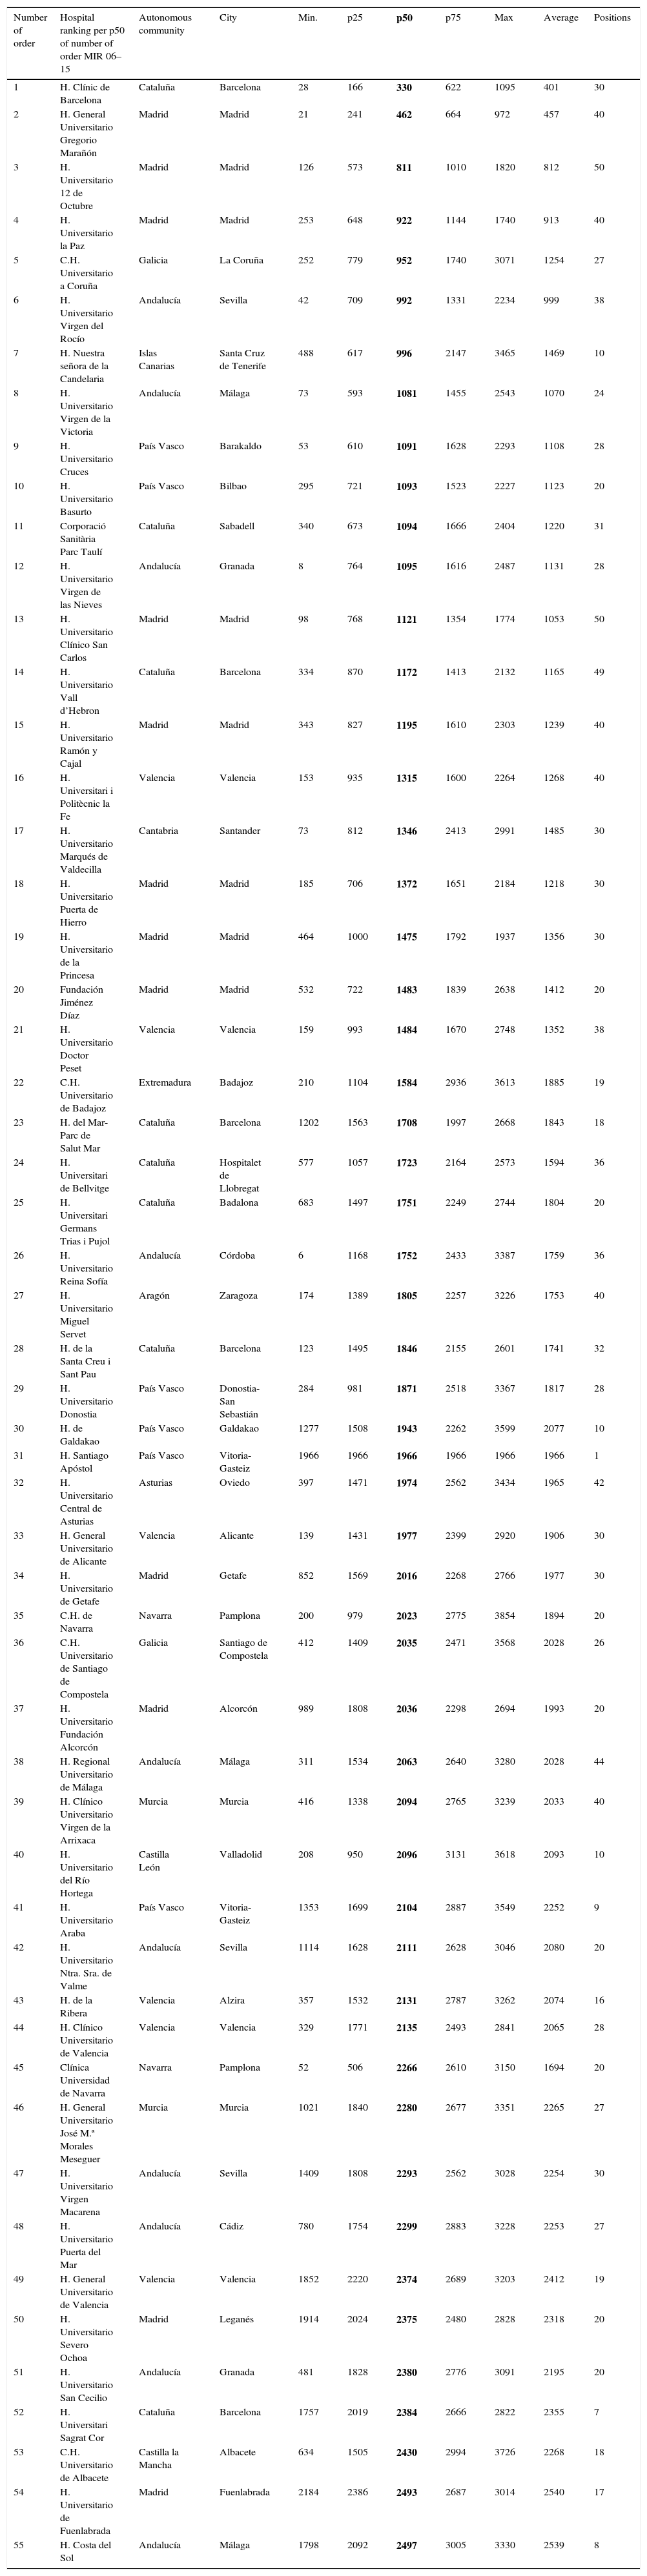
The hospital chosen with the lowest number of order mean (best number) is Hospital Clínic de Barcelona, followed by three (3) hospitals from Madrid: Hospital Universitario Gregorio Marañón, Hospital Universitario 12 de Octubre, and Hospital Universitario La Paz (Table 9).
Hospitals with an position pick mean <2500 regardless of the amount of positions offered.
| Number of order | Hospital ranking per p50 of number of order MIR 06–15 | Autonomous community | City | Min. | p25 | p50 | p75 | Max | Average | Positions |
|---|---|---|---|---|---|---|---|---|---|---|
| 1 | H. Clínic de Barcelona | Cataluña | Barcelona | 28 | 166 | 330 | 622 | 1095 | 401 | 30 |
| 2 | H. General Universitario Gregorio Marañón | Madrid | Madrid | 21 | 241 | 462 | 664 | 972 | 457 | 40 |
| 3 | H. Universitario 12 de Octubre | Madrid | Madrid | 126 | 573 | 811 | 1010 | 1820 | 812 | 50 |
| 4 | H. Universitario la Paz | Madrid | Madrid | 253 | 648 | 922 | 1144 | 1740 | 913 | 40 |
| 5 | C.H. Universitario a Coruña | Galicia | La Coruña | 252 | 779 | 952 | 1740 | 3071 | 1254 | 27 |
| 6 | H. Universitario Virgen del Rocío | Andalucía | Sevilla | 42 | 709 | 992 | 1331 | 2234 | 999 | 38 |
| 7 | H. Nuestra señora de la Candelaria | Islas Canarias | Santa Cruz de Tenerife | 488 | 617 | 996 | 2147 | 3465 | 1469 | 10 |
| 8 | H. Universitario Virgen de la Victoria | Andalucía | Málaga | 73 | 593 | 1081 | 1455 | 2543 | 1070 | 24 |
| 9 | H. Universitario Cruces | País Vasco | Barakaldo | 53 | 610 | 1091 | 1628 | 2293 | 1108 | 28 |
| 10 | H. Universitario Basurto | País Vasco | Bilbao | 295 | 721 | 1093 | 1523 | 2227 | 1123 | 20 |
| 11 | Corporació Sanitària Parc Taulí | Cataluña | Sabadell | 340 | 673 | 1094 | 1666 | 2404 | 1220 | 31 |
| 12 | H. Universitario Virgen de las Nieves | Andalucía | Granada | 8 | 764 | 1095 | 1616 | 2487 | 1131 | 28 |
| 13 | H. Universitario Clínico San Carlos | Madrid | Madrid | 98 | 768 | 1121 | 1354 | 1774 | 1053 | 50 |
| 14 | H. Universitario Vall d’Hebron | Cataluña | Barcelona | 334 | 870 | 1172 | 1413 | 2132 | 1165 | 49 |
| 15 | H. Universitario Ramón y Cajal | Madrid | Madrid | 343 | 827 | 1195 | 1610 | 2303 | 1239 | 40 |
| 16 | H. Universitari i Politècnic la Fe | Valencia | Valencia | 153 | 935 | 1315 | 1600 | 2264 | 1268 | 40 |
| 17 | H. Universitario Marqués de Valdecilla | Cantabria | Santander | 73 | 812 | 1346 | 2413 | 2991 | 1485 | 30 |
| 18 | H. Universitario Puerta de Hierro | Madrid | Madrid | 185 | 706 | 1372 | 1651 | 2184 | 1218 | 30 |
| 19 | H. Universitario de la Princesa | Madrid | Madrid | 464 | 1000 | 1475 | 1792 | 1937 | 1356 | 30 |
| 20 | Fundación Jiménez Díaz | Madrid | Madrid | 532 | 722 | 1483 | 1839 | 2638 | 1412 | 20 |
| 21 | H. Universitario Doctor Peset | Valencia | Valencia | 159 | 993 | 1484 | 1670 | 2748 | 1352 | 38 |
| 22 | C.H. Universitario de Badajoz | Extremadura | Badajoz | 210 | 1104 | 1584 | 2936 | 3613 | 1885 | 19 |
| 23 | H. del Mar-Parc de Salut Mar | Cataluña | Barcelona | 1202 | 1563 | 1708 | 1997 | 2668 | 1843 | 18 |
| 24 | H. Universitari de Bellvitge | Cataluña | Hospitalet de Llobregat | 577 | 1057 | 1723 | 2164 | 2573 | 1594 | 36 |
| 25 | H. Universitari Germans Trias i Pujol | Cataluña | Badalona | 683 | 1497 | 1751 | 2249 | 2744 | 1804 | 20 |
| 26 | H. Universitario Reina Sofía | Andalucía | Córdoba | 6 | 1168 | 1752 | 2433 | 3387 | 1759 | 36 |
| 27 | H. Universitario Miguel Servet | Aragón | Zaragoza | 174 | 1389 | 1805 | 2257 | 3226 | 1753 | 40 |
| 28 | H. de la Santa Creu i Sant Pau | Cataluña | Barcelona | 123 | 1495 | 1846 | 2155 | 2601 | 1741 | 32 |
| 29 | H. Universitario Donostia | País Vasco | Donostia-San Sebastián | 284 | 981 | 1871 | 2518 | 3367 | 1817 | 28 |
| 30 | H. de Galdakao | País Vasco | Galdakao | 1277 | 1508 | 1943 | 2262 | 3599 | 2077 | 10 |
| 31 | H. Santiago Apóstol | País Vasco | Vitoria-Gasteiz | 1966 | 1966 | 1966 | 1966 | 1966 | 1966 | 1 |
| 32 | H. Universitario Central de Asturias | Asturias | Oviedo | 397 | 1471 | 1974 | 2562 | 3434 | 1965 | 42 |
| 33 | H. General Universitario de Alicante | Valencia | Alicante | 139 | 1431 | 1977 | 2399 | 2920 | 1906 | 30 |
| 34 | H. Universitario de Getafe | Madrid | Getafe | 852 | 1569 | 2016 | 2268 | 2766 | 1977 | 30 |
| 35 | C.H. de Navarra | Navarra | Pamplona | 200 | 979 | 2023 | 2775 | 3854 | 1894 | 20 |
| 36 | C.H. Universitario de Santiago de Compostela | Galicia | Santiago de Compostela | 412 | 1409 | 2035 | 2471 | 3568 | 2028 | 26 |
| 37 | H. Universitario Fundación Alcorcón | Madrid | Alcorcón | 989 | 1808 | 2036 | 2298 | 2694 | 1993 | 20 |
| 38 | H. Regional Universitario de Málaga | Andalucía | Málaga | 311 | 1534 | 2063 | 2640 | 3280 | 2028 | 44 |
| 39 | H. Clínico Universitario Virgen de la Arrixaca | Murcia | Murcia | 416 | 1338 | 2094 | 2765 | 3239 | 2033 | 40 |
| 40 | H. Universitario del Río Hortega | Castilla León | Valladolid | 208 | 950 | 2096 | 3131 | 3618 | 2093 | 10 |
| 41 | H. Universitario Araba | País Vasco | Vitoria-Gasteiz | 1353 | 1699 | 2104 | 2887 | 3549 | 2252 | 9 |
| 42 | H. Universitario Ntra. Sra. de Valme | Andalucía | Sevilla | 1114 | 1628 | 2111 | 2628 | 3046 | 2080 | 20 |
| 43 | H. de la Ribera | Valencia | Alzira | 357 | 1532 | 2131 | 2787 | 3262 | 2074 | 16 |
| 44 | H. Clínico Universitario de Valencia | Valencia | Valencia | 329 | 1771 | 2135 | 2493 | 2841 | 2065 | 28 |
| 45 | Clínica Universidad de Navarra | Navarra | Pamplona | 52 | 506 | 2266 | 2610 | 3150 | 1694 | 20 |
| 46 | H. General Universitario José M.ª Morales Meseguer | Murcia | Murcia | 1021 | 1840 | 2280 | 2677 | 3351 | 2265 | 27 |
| 47 | H. Universitario Virgen Macarena | Andalucía | Sevilla | 1409 | 1808 | 2293 | 2562 | 3028 | 2254 | 30 |
| 48 | H. Universitario Puerta del Mar | Andalucía | Cádiz | 780 | 1754 | 2299 | 2883 | 3228 | 2253 | 27 |
| 49 | H. General Universitario de Valencia | Valencia | Valencia | 1852 | 2220 | 2374 | 2689 | 3203 | 2412 | 19 |
| 50 | H. Universitario Severo Ochoa | Madrid | Leganés | 1914 | 2024 | 2375 | 2480 | 2828 | 2318 | 20 |
| 51 | H. Universitario San Cecilio | Andalucía | Granada | 481 | 1828 | 2380 | 2776 | 3091 | 2195 | 20 |
| 52 | H. Universitari Sagrat Cor | Cataluña | Barcelona | 1757 | 2019 | 2384 | 2666 | 2822 | 2355 | 7 |
| 53 | C.H. Universitario de Albacete | Castilla la Mancha | Albacete | 634 | 1505 | 2430 | 2994 | 3726 | 2268 | 18 |
| 54 | H. Universitario de Fuenlabrada | Madrid | Fuenlabrada | 2184 | 2386 | 2493 | 2687 | 3014 | 2540 | 17 |
| 55 | H. Costa del Sol | Andalucía | Málaga | 1798 | 2092 | 2497 | 3005 | 3330 | 2539 | 8 |
Here follows data from a 10 year study of hospitals with the lowest mean of position choosing in every autonomous community with a maximum of 4 hospitals. C.H.U., Complejo Hospitalario Universitario; H., hospital; #, total amount of positions offered in this period; p25, percentile 25; p75, percentile 75; the name of each training center as they appear in the public offer by the Ministry is the one that has been considered with the following center grouping:
a Vigo has experienced the merge of various hospitals with several changes in the denomination of public hospitals and the training offer for the candidates, so for better clarification purposes, the positions offer has beed divided based on whether such offer comes from the Hospital Policlínico de Vigo (POVISA) or the Complejo Hospitalario Universidad de Vigo - including the offer by the Xeral-Cíes and Meixoeiro hospitals.
b In Lugo, the actual Hospital Universitario Lucus Augusti is referred to in the public announcements as C.H. Universitario Xeral–Calde de Lugo.
c C.H. San Millán and H. de San Pedro should be considered as the same hospital due to name change; consequently the autonomous community of La Rioja has had one resident per year only.
d The Hospital General de Murcia has changed its name into Hospital General Universitario Reina Sofía.
e The actual Complejo Hospitalario de Navarra is the combination of two hospitals. On the one hand, Hospital de Navarra (provincial) and on the other hand, Hospital Virgen del Camino.
The specialty of diagnostic radiology is one of the classic specialties that started offering traning positions for specialized physicians back in the 1980s. We have picked the last ten (10) years for our study for two reasons: because they are pretty homogeneous in the positions offer with respect to the total, and because there are no significant variations in its geographic distribution.
The amount of positions offered for all medical specialties varies on a yearly basis. For example, in the MIR exam 2015, 12,427 physicans were admitted to take the test for a total of 6097 positions and 11,227 physicians attended the exam. Out of all the physicians who attended the exam, 9288 obtained a number of order (potential candidates) in the lists of definitive results from the Ministry after the application of the cut-off mark (65.67 net questions), while 1939 physicians were disqualified because their score in the exam was not above the cut-off mark. In the MIR exam 2015, the last position of all the opernings offered was chosen with number of order 7759 (physicians unaffected by the ratio of foreign candidates), and with number of order 4547 (physicians affected by the ratio of foreign candidates). The ratio of foreign candidates ranges between 10 per cent in the year 2010, and 4 per cent from 2014 until present day.
The number of positions offered for diagnostic radiology ranges between 207 and 230, with a maximum amount of positions offered in the years 2008 and 2009 and then a drop until 207 in 2014. This oscillation in the number of positions for the specialty of diagnostic radiology is directly proportional to the total number of positions offered, because if we analyze the percentage of annual positions, the value is nearly stable at 3.36 per cent (Fig. 1). This stability is constant in most medical specialties, though there are cases like the specialty of clinical laboratory that offered some 35 positions in the year 2007 but that has been reduced to only 18 positions in 2015. Other medical specialties like digestive system, pneumology, and pediatrics have increase their percentage of annual positions; these variations occur based on estimation researches conducted by the Ministry on the need for specialists14–16.
In the classification of specialties arranged by number of order mean for all candidates, the specialty of diagnostic radiology ranks #16 among the 47 medical specialties offered, which is a stable position when all medical specialties are arranged by number of order mean of the candidates who chose them, or by percentiles 25, 50, or 75 for number of order.
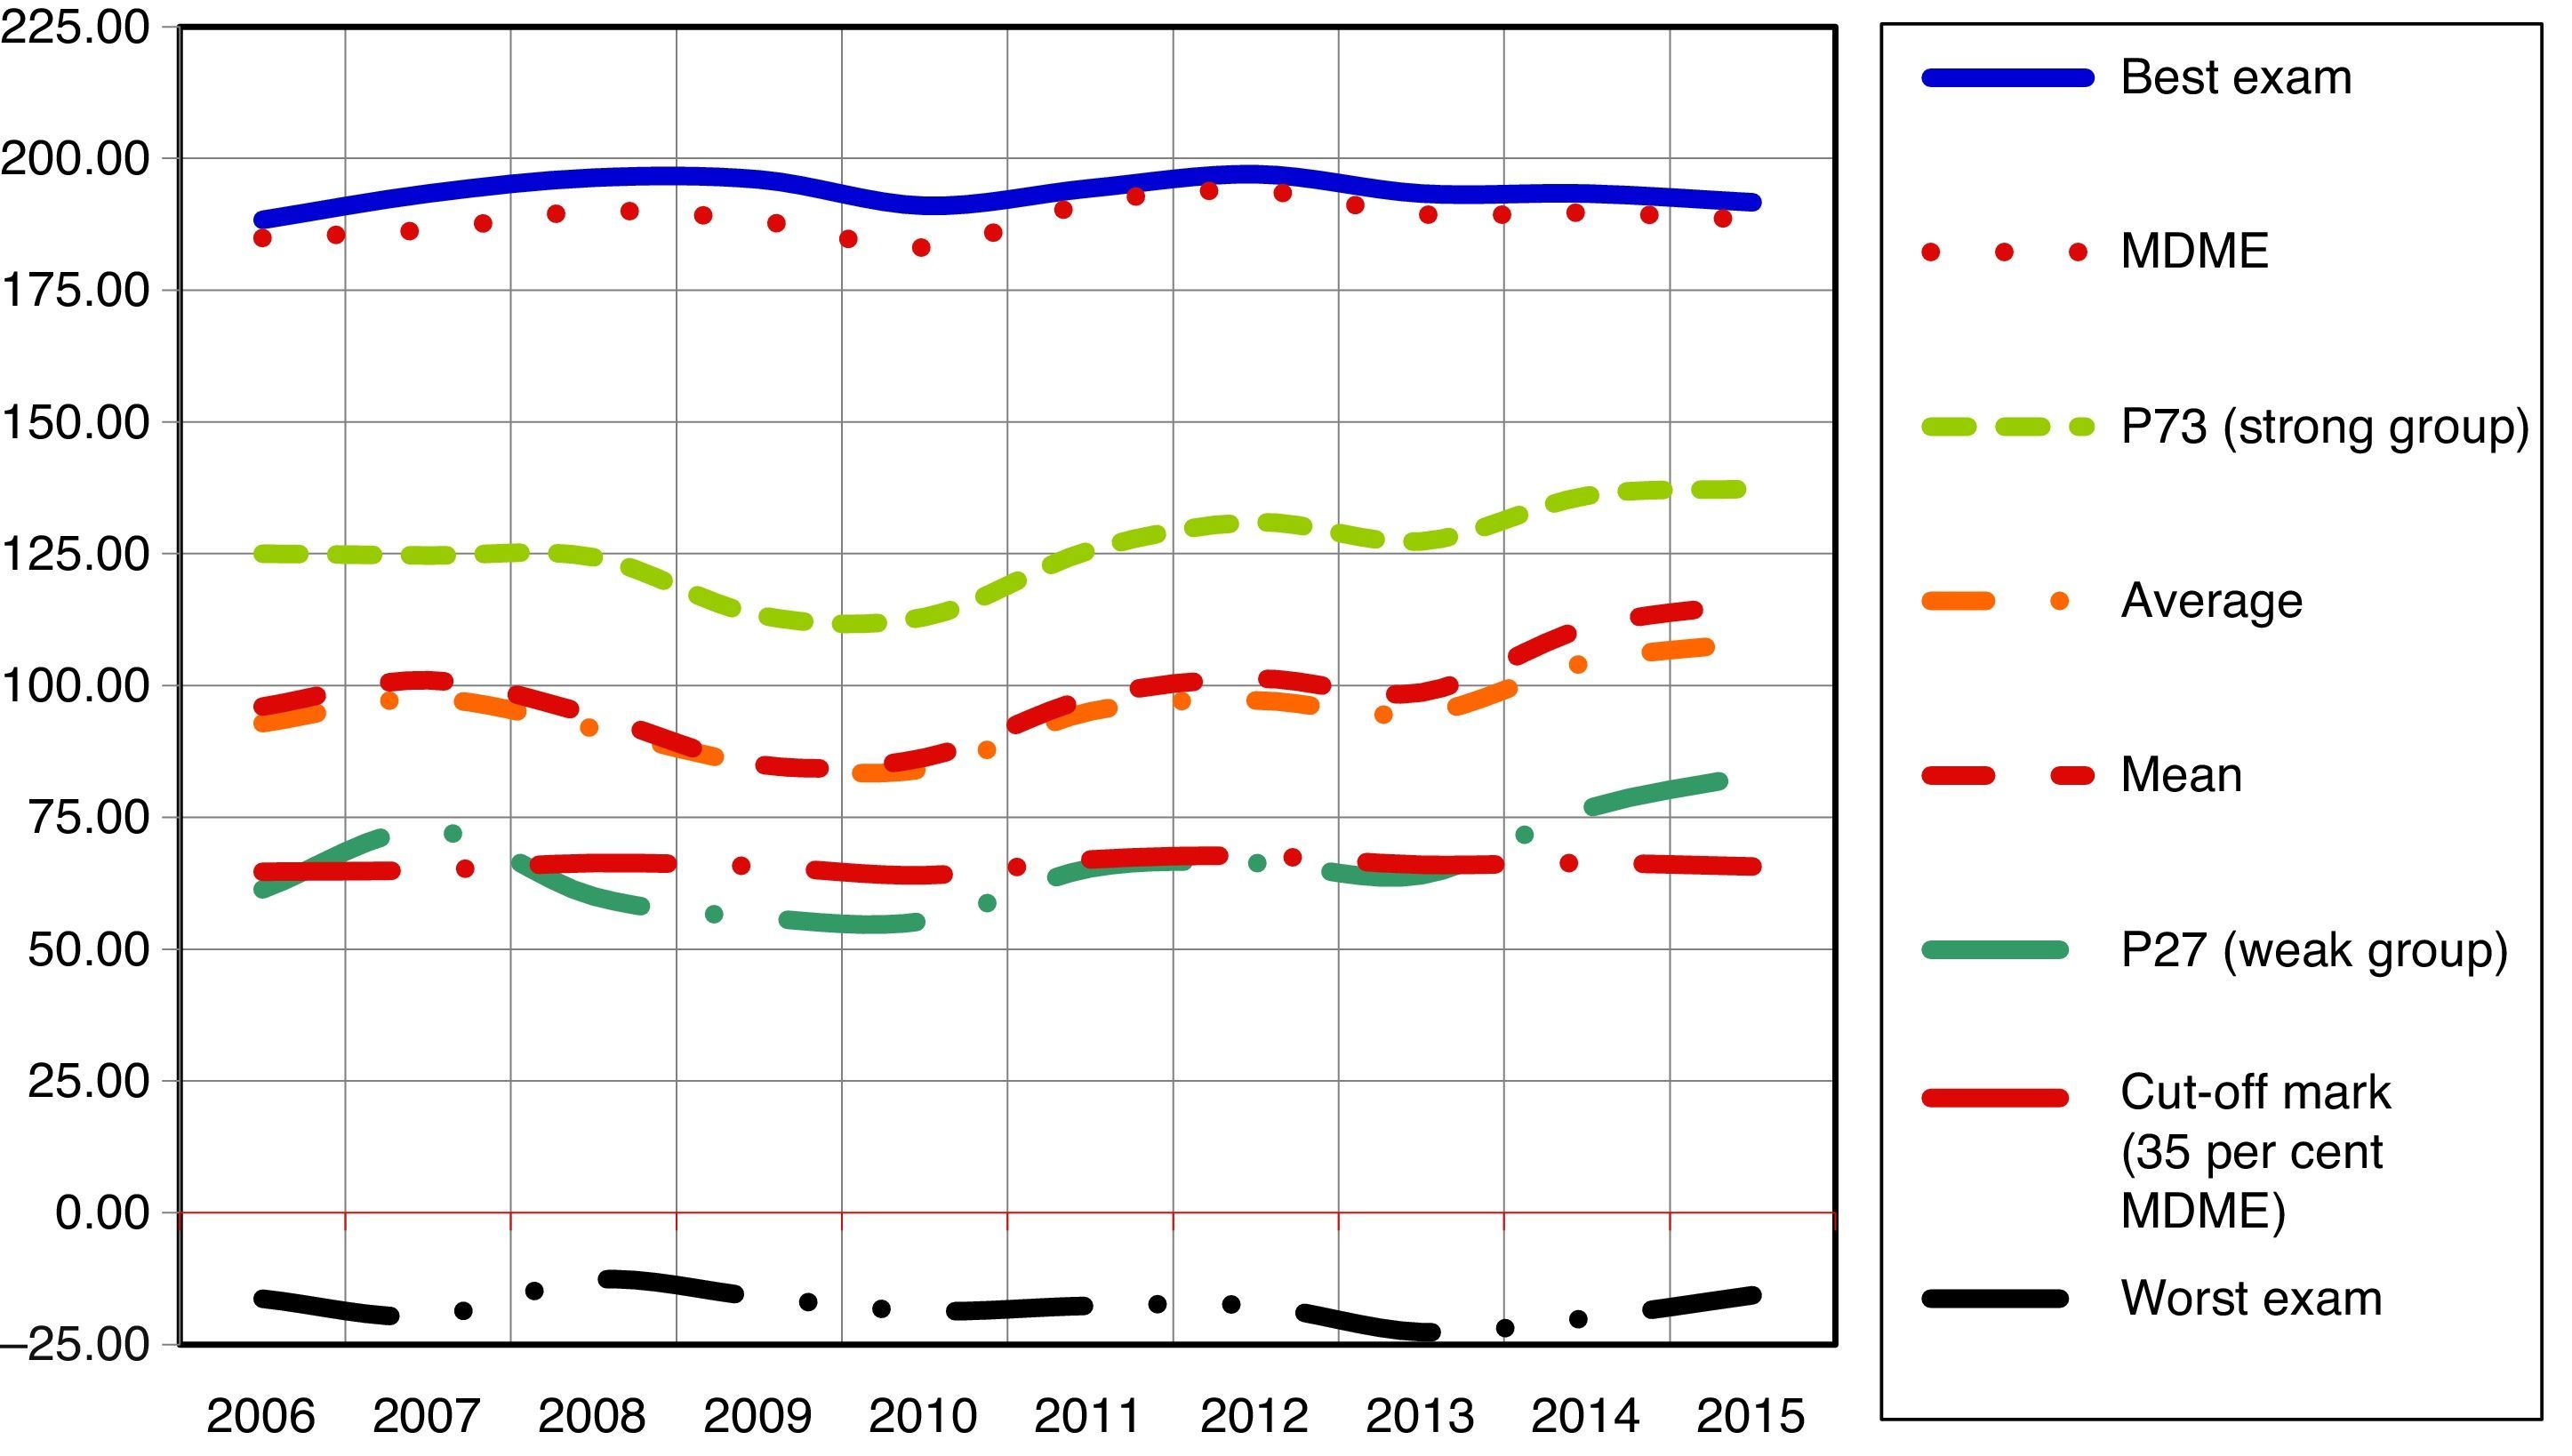
The first candidate who is eligible to choose diagnostic radiology usually scores in over 170 net questions, except for the year 2009 when the maximum score dropped to 164 net questions; 25 per cent of all positions have already been covered by the time candidates score in 150 net questions, and the last position by the time they score in over 100 net questions. Comparing these data with the simulation for exams of 225 questions as shown in Fig. 2, we see that to be eligible for the very first position in diagnostic radiology, the candidates’ scores need to be among the top 75 exams, that 25 per cent of the positions have been covered by the time the numbers of order reach numbers 1016 and 1296 and that the last position is usually above the average and mean of candidates between the numbers of order 3715 and 4066. The surveys published by the Ministry confirm that 78 per cent of the candidates who choose diagnostic radiology say that such medical specialty was their very their first choice.14,15 Also these surveys confirm that diagnostic radiology is one of the most popular medical specialties, far from specialties such as family and community medicine, or internal medicine. The average age of the candidates is 28 years old–well above the average age of medical college graduates, suggestive that the average candidate is savvy on diagnostic radiology, that he or she has followed special training and that he/she has not finished such training until the completion of this specialty.14,15 As the surveys from the Ministry claim, the main issue here is trying to generalize these outcomes to the overall population of candidates, since only the candidates who answer these surveys are included.14
 and the cut-off mark was stable at 35 per cent. Compiled and edited from https://gangasmir.blogspot.com.es/. The MDME is the average grade of the top ten (10) exams, and the cut-off mark was 35 per cent of the MDME grade in the 2013–2015 period, and 30 per cent in 2012. From 2008 through 2012 the cut-off mark was the minimum positive grade only, while from 2001 through 2007 there was not cut-off mark.")
Simultation of MIR exams as if they consisted of 225 questions (it only happens since 2009) and the cut-off mark was stable at 35 per cent. Compiled and edited from https://gangasmir.blogspot.com.es/. The MDME is the average grade of the top ten (10) exams, and the cut-off mark was 35 per cent of the MDME grade in the 2013–2015 period, and 30 per cent in 2012. From 2008 through 2012 the cut-off mark was the minimum positive grade only, while from 2001 through 2007 there was not cut-off mark.
Twenty four per cent of all diagnostic radiology positions are chosen by foreign physicians–which makes this specialty rank #21 in the overeall classification of 44 offered medical specialties (excluding the specialties offered by professional schools) arranged from lower to higher percentage of foreign physicians, which is suggestive that diagnostic radiology is an intermediate option for foreign candidates living in Spain. Always taking into account that the ratio of foreign physicians conditions access of such physicians to the medical specialties and that only those with low numbers of order have access to specialized training.
Every year the amount of women who choose diagnostic radiology exceeds the number of men who do so, and in the year 2012 it reached its peak with 65 per cent of all positions offered (Tables 3 and 5). Diagnostic radiology ranks #33 in the ranking of medical specialties arranged from lowest to highest presence of female physicians. This is indicative that the feminization of diagnostic radiology is lower than the feminization of most specialties. The largest presence of masculine candidates who choose diagnostic radiology has been reported in descriptive studies conducted in the United States, though countries like Switzerland report different results.8–10 The studies published by the Ministry reveal that there are 49 per cent of female specialists in diagnostic radiology today, there will be 48.4 per cent by 2020, and 47.2 per cent by 2025, meaning that we will witness a slight drop of women who choose this specialty.14,15 We have not found any sources that give a clear explanation for this finding which is particulary unsual given the benefits associated with this specialty that ease the family responsibility of women, which should rise the percentage of women who choose this specialty.9,10 Barriers in the advancement of women in the field of academic radiology have been proposed as one of the possible reasons, though without specific data,9 as well as the low satisfaction of female radiologists in their job17 and even that this type of technology is not appealing to female physicians anymore.10 Other studies talk about meeting this specialty for the first time in the colleges of medicine, and about the low exposure of candidates to female specialists in diagnostic radiology during training.10 In any case, in our study we have not found any justification or conclusive reason to explain this.
The first autonomous community in the number of positions offered in diagnostic radiology in 10 years of study is Madrid with 432 posititions distributed in 14 hospitals. Up to 130 of these positions are offered by (3) hospitals from the Comunidad de Madrid, that cover all positions with a number of order mean below 1000 (Hospital General Universitario Gregorio Marañón, Hospital Universitario 12 de Octubre, and Hospital Universitario la Paz).
Andalucía is the second autonomous community in the number of positions offered during the 2006–2015 period: 330 positions distributed in 15 hospitals. Two (2) hospitals from Andalucía reported a number of order mean below 1000: Hospital Universitario Virgen del Rocío de Sevilla, with 38 residents in 10 years, and Hospital Universitario Virgen de la Victoria de Málaga, with fewer residents per year, and a total of 24 residents in 10 years.
The hospital with the best number of order mean in this classification is Hospital Clínic de Barcelona with a number of order mean among candidates of 330. Catalonia is the third autonomous community in the number of positions offered (305) in the studied period.
The fourth autonomous community in the number of positions offered for residents is Comunidad Valenciana (218 positions), distributed in 10 hospitals. The hospital with the lowest number of order mean is Hospital Universitari i Politècnic la Fe with 1.315 and 40 residents trained in 10years.
This list of hospitals with a number of order mean below 1000 is completed with Hospital Universitario de la Coruña, with a percentile 50 of 952 and 27 residents trained during the 10 years of study, and Hospital Nuestra Señora de la Candelaria with a number of order mean of 996, though with a significantly lower number of residents trained – 10 residents in 10 years. The Basque Country has been offering 96 positions during these 10 years and two (2) of its hospitals complete the classification of the 10 hospitals with the lowest percentile 50 of number of order: Hospital Universitario de Cruces, with a number of order mean of 1081 and 28 residents trained in 10 years, and Hospital Universitario de Basurto with a number of order mean of 1093 and 20 residents trained in the 10 years of the study. The first hospital of one mono-provincial autonomous community is Hospital Universitario Marqués de Valdecilla, with a number of order mean of 1346 and 30 residents trained in 10 years.
Consequently, we can deduce that the candidates of the specialty of diagnostic radiology prefer to do their medical residency in large volume hospitals like those located in provincial capital cities. This statement is a constant in the process of choosing all medical specialties since all surveys pubished by the Ministry and conducted among training specialists claim that if candidates were free to choose, the first three hospitals they would choose from are (1) Hospital Universitario La Paz, (2) Hospital Clínic de Barcelona, and (3) Hospital 12 de Octubre.14,15
What physicians look for when they choose position and place of residence is personal and varies from one physician to the other. In Spain, specialized healthcare training is strictly characterized by the process of choosing position, and by the number of order obtained in the MIR exam, something that does not happen in other settings. According to the surveys conducted by the Ministry, up to 40 per cent of the residents said that they chose their medical specialty based on career opportunities, professional development, and future of such medical specialty, 17 per cent chose their medical specialty on grounds of social recognition, and 9 per cent for the prestige they were going to get from family and friends14,15; also other variables such as “because the hospital offering this specialty is highly advanced”4–7,12,13 were studied too. Probably, all the aforementioned motivations make candidates choose hospitals located in provincial capital cities that are closer to their main future goals, with more technological advancements, and career opportunities.
In these studies the influence of medical schools has not been analyzed, and yet they play a role in the candiates’ process of choosing probably because they choose hospitals they knew during their college training versus unknown hospitals of similar characteristics.
In any case, we cannot ignore the territorial reality of Spain or the personal characteristics of each candidate that make some hospitals fall outside this general rule. According to surveys from the Ministry, up to 23 per cent of the candidates choose their training center because it is close to their place of residence and because they want to be close to their families. These personal of family motivations are often quoted among the most important ones in studies that analyze how the process of choosing this or that center to complete the specialty unfolds, such as one survey conducted in Germany where respondants said that both family and leisure opportunities are more important than social status, scientific work, or mentoring. One Australian study that analyzed the reasons to choose diagnostic radiology says that what is perceived as the most important of all is how the specialty will shape family life, and how it is an organized job with a flexible schedule to which one can return easily after a period of absence.11,13
On the other hand, in the surveys published by the Ministry, training specialists say that money is not the main motivation to choose diagnostic radiology in any of surveys conducted through the years.14,15 But this cannot be ignored when making the decision of specializing in diagnostic radiology since the prospect of good career opportunities when completing the specialty is among the main motivations as reported by the specialists - up to 10 per cent of the respondents.14 Our specialty offers the appropriate career opportunities if we consider that the Ministry of Health thinks that by offering positions in the MIR training exam in diagnostic radiology there is already a balance between training and the withdrawal of specialists, unlike what happens in other specialties with training surplus like allergology or negative balance like pediatrics.15
The main difficulties we had while conducting this study are the lists including the positions to choose from published by the Ministry that happen to be available only for a short period of time in the official website of the Ministry of Health. We had to conduct annual registrations of these lists while the position choosing events of each year were taking place for further grouped data analysis.
Hospital classification by number of order mean of the candidates is biased due to the different number of positions offered every year in each center. The number of order mean of the candidates of one center used to elaborate the ranking is not as important if such estimate derives from a high number of positions offered by large volume centers compared to a low number of positions offered by small volume centers. In the latter case, the results from one or few candidates may dramatically modify the mean value (up or down).
Lastly, there is significant bias in the statistics of the different positions available due to hospital merge processes. The motivations of the candidates are not the same in old compared to new hospitals or hospital merges, even if both the setting and personnel stay the same. So, as far as possible, we tried to keep those institutions with a different denomination in the public announcement separately, except for certain occasions whose special characteristics are described herein.
In conclusion, candidates eligible for the medical specialty of diagnostic radiology need good numbers of order in the MIR exam, and the specialty is usually chosen by Spanish physicians, but not so much by women. Also, those eligible for the specialty of diagnostic radiology prefer large volume hospitals located in provincial capital cities.
Ethical responsibilitiesProtection of people and animalsThe authors declare that no experiments with human beings or animals have been performed while conducting this investigation.
Data confidentialityThe authors confirm that in this article there are no data from patients.
Right to privacy and informed consentThe authors confirm that in this article there are no data from patients.
Authors’ contribution- 1.
Manager of the integrity of the study: EMQ.
- 2.
Study idea: EMQ, JBR.
- 3.
Study design: EMQ, JBR.
- 4.
Data mining: EMQ, JBR, FSL, JMRL.
- 5.
Data analysis and interpretation: EMQ, FSL, AFS, JMRL, MCR.
- 6.
Statistical analysis: EMQ, FSL, JMRL.
- 7.
Reference: EMQ.
- 8.
Writing: EMQ, SCG, JBR, MCR, AFS, SCG.
- 9.
Critical review of the manuscript with intellectually relevant remarks: MCR, JBR, AFS, FSL, JMRL, MCR, SCG.
- 10.
Approval of final version: all authors.
The authors declare no conflict of interests associated with this article whatsoever.
We wish to thank Ms. Conchi García, Head of the Spanish Medical Residency Examination (MIR Asturias).
Please cite this article as: Murias Quintana E, Sánchez Lasheras F, Fernández-Somoano A, Romeo Ladrero JM, Costilla García SM, Cadenas Rodríguez M, et al. Análisis de la elección de la especialidad de radiodiagnóstico en el examen MIR desde el año 2006 hasta 2015. Radiología. 2017;59:232–246.

