


To compare the findings on chest computed tomography (CT) in patients with COVID-19 during different phases of the disease and to evaluate the reproducibility of a visual radiologic score for estimating the extent of lung involvement.
MethodsWe retrospectively reviewed chest CT studies from 182 patients with RT-PCR findings positive for SARS-CoV-2. Patients were classified according to the time elapsed from the onset of symptoms, as follows: early (0–4 days), intermediate/progressive (5–9 days), or advanced (≥10 days). We analysed the frequency of each radiologic finding, as well as the pattern, appearance, and predominant distribution of lung involvement. A visual tomographic score (range, 0−25) was used to estimate the extent of involvement in each lobe and in the total lung volume.
ResultsThe predominant CT finding was the ground-glass pattern (n = 110; 60.4%), the most common distribution was peripheral (n = 116; 66.7%), and the most prevalent appearance was typical (n = 112; 61.5%). The halo sign was seen most frequently in the early phase (25%), whereas ground-glass opacities were more common in the intermediate/progressive and advanced phases. The median severity score was 10 (IQR: 5–13), and the scores increased as the disease progressed. The interobserver agreement (kappa) was 0.92 for the appearance, 0.84 for the distribution, 0.70 for the predominant pattern, and 0.89 for the visual score.
ConclusionThe CT findings in patients with COVID-19 vary with the course of the infection. The proposed visual radiologic score is a simple, reproducible, and reliable tool for assessing lung involvement in COVID-19 pneumonia.
Comparar los hallazgos radiológicos mediante tomografía computarizada (TC) torácica en pacientes con COVID-19 en diferentes fases de la enfermedad y evaluar la reproducibilidad de unscore radiológico visual para estimar la extensión de la afectación pulmonar.
MétodosSe evaluaron retrospectivamente las tomografías computarizadas de tórax de 182 pacientes con RT-PCR positiva para SARS-CoV-2. En función del tiempo de evolución de la infección, los pacientes fueron clasificados en tres grupos/estadios: fase precoz (0–4 días), intermedia/progresiva (5–9 días) y avanzada (≥10 días). Se analizó la frecuencia de cada hallazgo radiológico, así como el patrón, la apariencia y la distribución predominantes de la afectación pulmonar. La extensión de la afectación pulmonar se estimó para cada lóbulo pulmonar y para el volumen pulmonar total mediante un score tomográfico visual (rango 0−25).
ResultadosEl hallazgo tomográfico predominante fue el patrón en vidrio deslustrado (n = 110, 60,4%), la distribución más frecuente, la periférica (n = 116, 66,7%) y la apariencia más prevalente, la típica (n = 112, 61,5%). El “signo del halo” se encontró más frecuentemente en la fase precoz (25%), mientras que las opacidades en vidrio deslustrado, el patrón en empedrado y las líneas subpleurales fueron más frecuentes en las fases intermedia/progresiva y avanzada. La mediana delscore de gravedad fue de 10 (RIQ: 5–13), aumentando los valores con la progresión de la enfermedad. El acuerdo interobservador (kappa, k) para la apariencia, la distribución y el patrón predominante, así como para el score visual fueron de 0,92; 0,84; 0,70, y 0,89; respectivamente.
ConclusiónLos hallazgos tomográficos en la COVID-19 varían con el curso de la infección. Elscore radiológico sugerido es una herramienta sencilla, reproducible y fiable para evaluar la afectación pulmonar en la neumonía COVID-19.
In December 2019, an increasing number of cases of patients with pneumonia of unknown aetiology was registered in the city of Wuhan (Hubei, China). In the study of the epithelial cells of the airways of infected patients, a new type of mutated coronavirus was discovered, which was called severe acute respiratory syndrome coronavirus 2 (SARS-CoV-2).1–3 Since then, the number of confirmed coronavirus cases has risen rapidly around the world. On 11 March, the World Health Organization (WHO) declared the infection a pandemic and designated the official term COVID-19 (Coronavirus Disease 2019) to refer to the disease caused by SARS-CoV-2.4 As of 19 January 2021, more than 93 million cases worldwide and more than 2 million deaths from COVID-19 had been confirmed.2
Clinically, COVID-19 pneumonia is characterised by fever, fatigue, dyspnoea and a dry cough. Other presenting symptoms of SARS-CoV-2 infection include diarrhoea, headache, myalgia, anorexia and anosmia.5 Among the risk factors for the development of adult respiratory distress syndrome (ARDS) are advanced age (over 65, especially males) and comorbidities, such as diabetes and chronic cardiovascular or pulmonary diseases.3
Chest computed tomography (CT) takes on great value in the diagnosis and prognosis of patients with suspected COVID-19 pneumonia.1,6–9 A wide variety of chest tomography findings have been described in these patients.10–12 Among them, ground-glass opacity, with or without associated consolidation, has been described as a typical (although not specific) finding in COVID-19 pneumonia, especially in the initial phases.6–10 In fact, the identification of bilateral ground-glass opacities with a predominantly peripheral and posterior distribution has shown greater sensitivity than the reverse transcription polymerase chain reaction (RT-PCR) test.13–15 However, some of the imaging findings resemble those seen in other viral pneumonias or do not show a specific distribution for the diagnosis of COVID-19.6,16
From a prognostic point of view, some research groups have proposed different radiological scores (by visual estimation or automated evaluation using artificial intelligence) to assess the extension and severity of COVID-19 pneumonia.17–21 Validation of radiological scores that assess the severity of SARS-CoV-2 pneumonia would provide additional information to identify patients who may benefit from antiviral treatment or who are at risk of developing ARDS.22
The primary objective of this study was to describe the prevalence of different radiological findings in the time course of COVID-19 pneumonia in a cohort of patients from two centres in Spain. Secondarily, we evaluated the reproducibility of a visual radiological score (semi-quantitative) to assess the extent and severity of COVID-19 pneumonia.
Materials and methodsPatient recruitment and data collectionIn this retrospective observational study, from 7 March to 30 March 2020, CT studies were performed in 218 patients from two Spanish tertiary hospitals with suspected or diagnosed COVID-19 pneumonia. From the initial sample of chest CT scans, we included patients who had symptoms suggestive of SARS-CoV-2 infection and had a positive RT-PCR test. Exclusion criteria were: a) patients under 18 years of age: b) negative RT-PCR test; c) pneumonia caused by a pathogen other than SARS-CoV-2; and d) consecutive CT scans performed on the same individual. The patients were classified into three groups based on the stage of their COVID-19 infection6–12: early phase, less than five days from the onset of symptoms; intermediate/progressive phase, from five to nine days from the onset of symptoms; and advanced phase, more than nine days from the onset of symptoms. The ethics committees of both hospitals approved the study protocol (2020.55) and all patients signed the informed consent form.
CT acquisition protocolThe chest CT scans were performed on admission with two multidetector CT machines (SOMATOM Sensation 64 and SOMATOM Emotion 16; Siemens Healthineers, Forchheim, Germany) specifically dedicated to the study of patients with suspected or diagnosed SARS-CoV-2 infection. The studies were obtained with the patient in the supine position and holding their breath. The parameters used were: 120 kV tube voltage, 190 mAs tube current with anthropomorphic current modulation system (CareDose 4D, Siemens Healthineers), detector collimation of 32 × 0.6 mm and pitch of 1. Images were reconstructed with a slice thickness of 1 mm and a reconstruction increment of 1 mm, using soft tissue filters (B31f) and high resolution (B60f) to assess the mediastinum and lung parenchyma, respectively. The images were stored in PACS (Picture Archiving and Communication Systems) for study.
Imaging analysisThe chest CT images were analysed independently by two radiologists (a resident with two years' experience in chest CT imaging and a chest radiologist with 16 years' experience). The observers did not know the result obtained by the other (double-blind study). The findings were described using the Fleischner Society glossary of terms as reference.23
Sixteen radiological findings were assessed which, in accordance with the literature,9–12 might be observed in the different chest CT scans of patients with COVID-19 pneumonia: ground-glass opacities; consolidation; ground-glass opacities associated with areas of consolidation; reticular pattern; nodules; subpleural lines; round/pseudonodular opacities; cavitation; crazy-paving pattern; intralesional vascular engorgement; air bronchogram; halo sign; inverted halo sign; thickening of the bronchial walls; bronchiolectasis; and pulmonary fibrosis. From these abnormalities, the six main radiological patterns of lung involvement were defined (ground-glass opacities, ground-glass opacities with areas of consolidation, consolidation, crazy-paving pattern, reticular pattern and subpleural lines). The predominant pattern (ground-glass opacities, consolidation or fibrosis) was assessed for each lobe (>50% of the affected lobe) and for the total lung volume (>50% of the lung). The distribution of lung abnormalities was described as predominantly peripheral, central or mixed (peripheral and central involvement).
Following the consensus statement of the Radiological Society of North America (RSNA) and based on the radiological findings for each patient, four categories were determined which indicated the likelihood of COVID-19 pneumonia (typical, indeterminate, atypical and negative patterns).24 The presence of thoracic lymphadenopathy (≥10 mm short-axis diameter) and pleural or pericardial effusion or thickening were also assessed.
A visual radiological score was used for the semiquantitative assessment of each of the five lobes of the lungs9: score = 0, no involvement; score = 1, involvement of 1%–5% of the volume of the lobe; score = 2, 6%–25% involvement; score = 3, 26%–50% involvement; score = 4, 51%–75% involvement; and score = 5, 76%–100% involvement. The total score was obtained by adding together the scores for each lobe. Discrepancies were resolved by consensus.
Statistical analysisCategorical variables were expressed as proportions and percentages, and continuous quantitative variables as mean ± standard deviation (95% confidence interval for the mean) or as median and interquartile range (IQR). The analysis of normality was performed with the Kolmogorov-Smirnov test. Differences between previously established groups were compared with the χ2 test for categorical variables and with the ANOVA test for continuous variables.
The Cohen's weighted kappa statistic (κ) was used to establish interobserver agreement for the predominant pattern, distribution and appearance of CT findings and the severity score. The kappa value obtained was interpreted as follows: ≤0.20, poor agreement; 0.21−0.40, acceptable agreement; 0.41−0.60, moderate agreement; 0.61−0.80, strong agreement; >0.80, excellent agreement.25 The statistical analysis was performed with SPSS software (version 25.0; IBM Corporation). Statistical significance was set at P < .05.
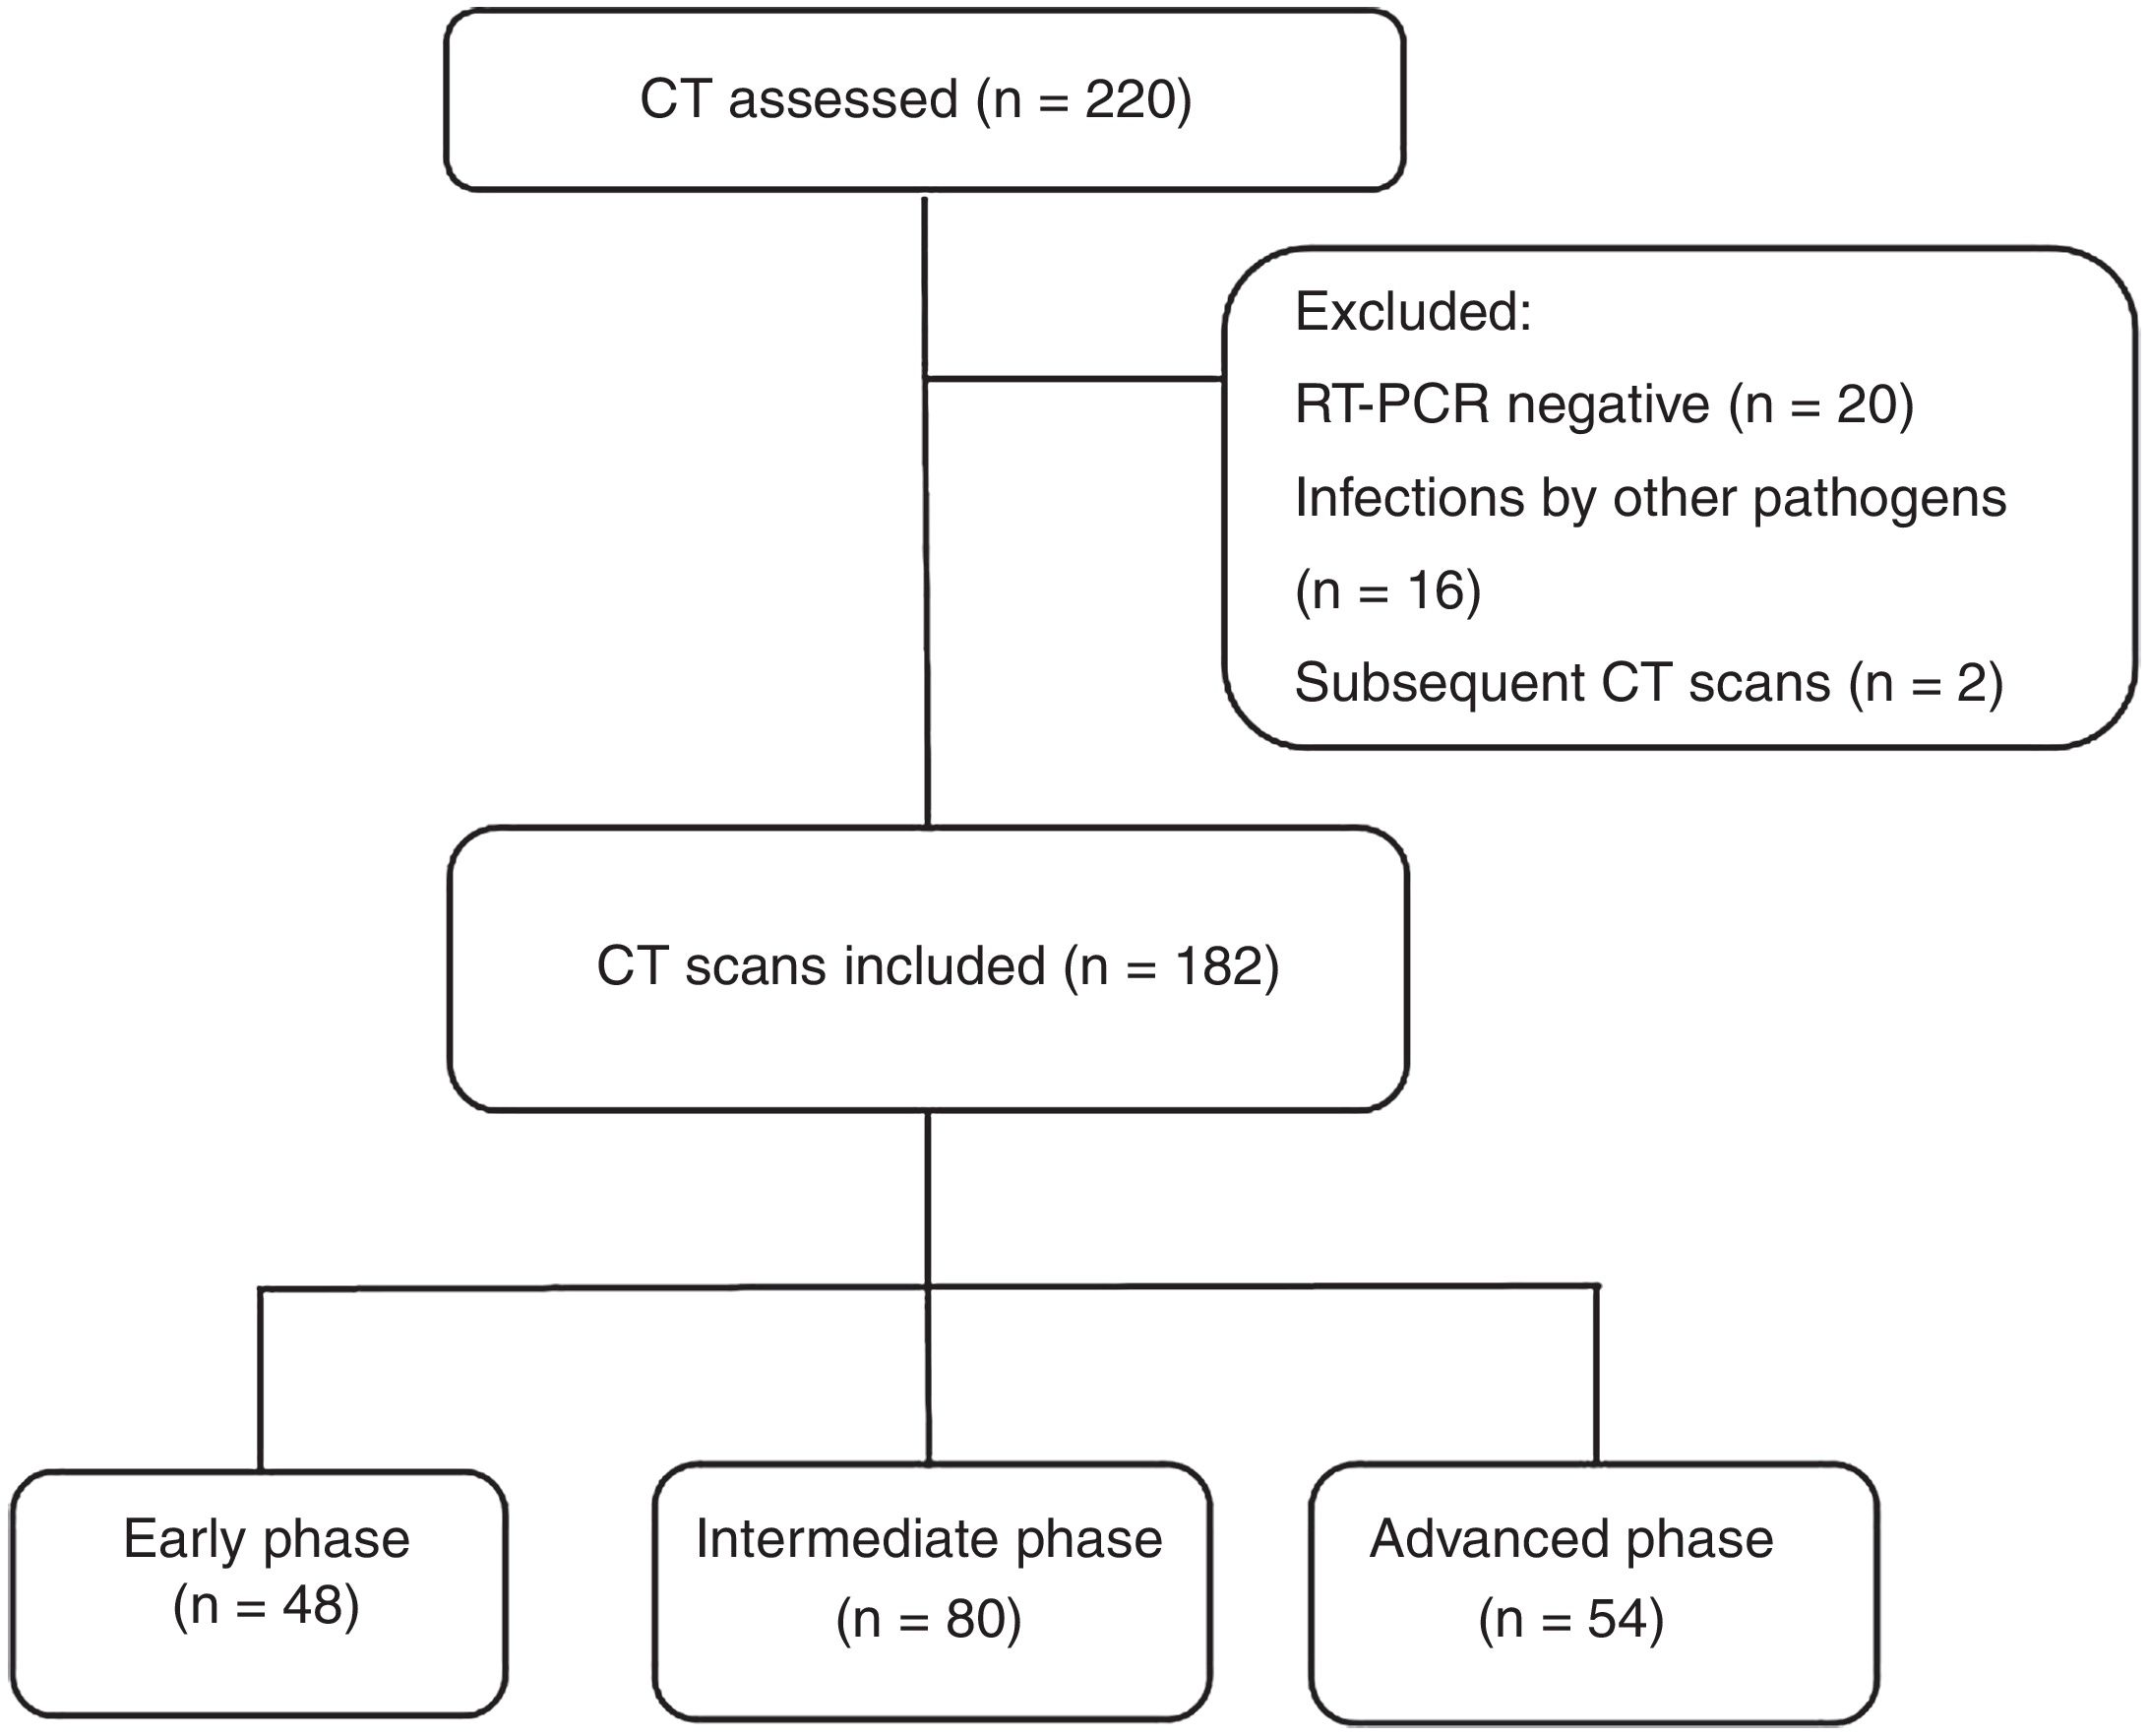
ResultsPopulationOf the 218 initial patients, 20 were excluded for having negative RT-PCR tests and 16 for having infections with pathogens other than SARS-CoV-2. Additional CT scans were performed in two subjects due to secondary complications, but only the initial CT scan was included in the final analysis (Fig. 1). In the end, 182 patients were included, 48 of whom were in the early phase of the disease, 80 in the intermediate/progressive phase and 54 in the advanced phase.

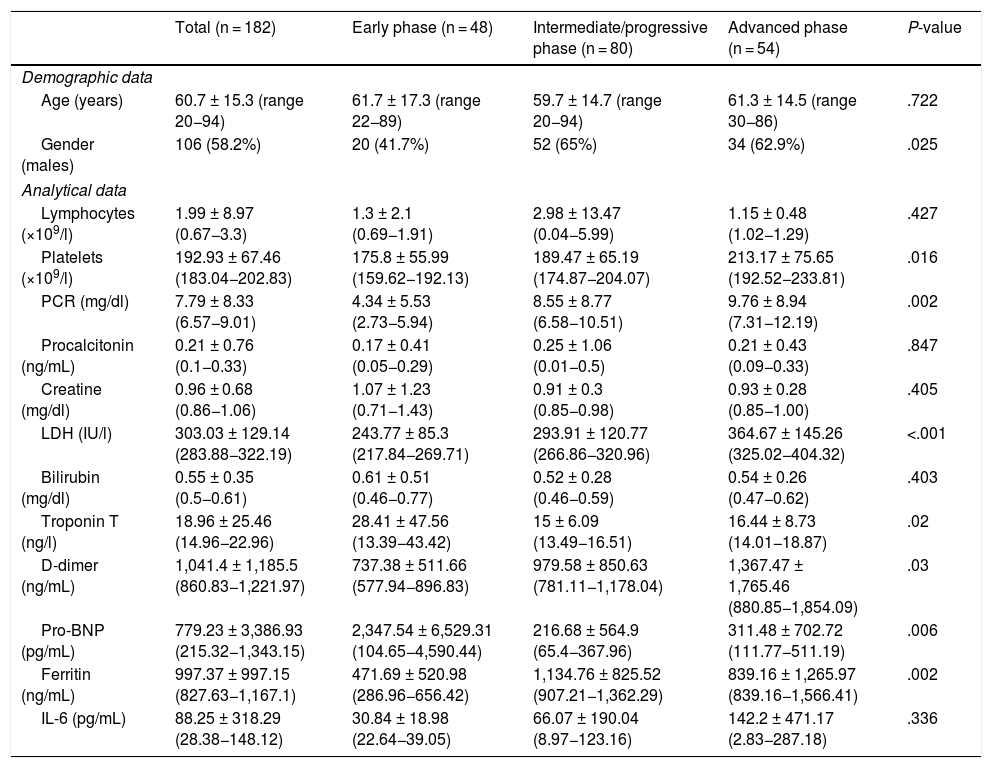
Demographic data and laboratory tests at the time of admission are shown in Table 1. Most of the individuals were male (58.2%), with a mean age of 60.7 ± 15.3 years (range 20−94). The mean time from onset of symptoms to CT scan was 7.31 ± 3.98 days (range 6.73–7.89). There was a higher proportion of males in the intermediate/progressive (65%) and advanced (62.9%) groups. The patients in intermediate/progressive or advanced phases presented higher values in platelet count, C-reactive protein (CRP), lactate dehydrogenase (LDH), D-dimer and ferritin (P < .05) (Table 1).
Demographic and laboratory data of patients in the early, intermediate/progressive and advanced stages of the disease.
| Total (n = 182) | Early phase (n = 48) | Intermediate/progressive phase (n = 80) | Advanced phase (n = 54) | P-value | |
|---|---|---|---|---|---|
| Demographic data | |||||
| Age (years) | 60.7 ± 15.3 (range 20−94) | 61.7 ± 17.3 (range 22−89) | 59.7 ± 14.7 (range 20−94) | 61.3 ± 14.5 (range 30−86) | .722 |
| Gender (males) | 106 (58.2%) | 20 (41.7%) | 52 (65%) | 34 (62.9%) | .025 |
| Analytical data | |||||
| Lymphocytes (×109/l) | 1.99 ± 8.97 (0.67−3.3) | 1.3 ± 2.1 (0.69−1.91) | 2.98 ± 13.47 (0.04−5.99) | 1.15 ± 0.48 (1.02−1.29) | .427 |
| Platelets (×109/l) | 192.93 ± 67.46 (183.04−202.83) | 175.8 ± 55.99 (159.62−192.13) | 189.47 ± 65.19 (174.87−204.07) | 213.17 ± 75.65 (192.52−233.81) | .016 |
| PCR (mg/dl) | 7.79 ± 8.33 (6.57−9.01) | 4.34 ± 5.53 (2.73−5.94) | 8.55 ± 8.77 (6.58−10.51) | 9.76 ± 8.94 (7.31−12.19) | .002 |
| Procalcitonin (ng/mL) | 0.21 ± 0.76 (0.1−0.33) | 0.17 ± 0.41 (0.05−0.29) | 0.25 ± 1.06 (0.01−0.5) | 0.21 ± 0.43 (0.09−0.33) | .847 |
| Creatine (mg/dl) | 0.96 ± 0.68 (0.86−1.06) | 1.07 ± 1.23 (0.71−1.43) | 0.91 ± 0.3 (0.85−0.98) | 0.93 ± 0.28 (0.85−1.00) | .405 |
| LDH (IU/l) | 303.03 ± 129.14 (283.88−322.19) | 243.77 ± 85.3 (217.84−269.71) | 293.91 ± 120.77 (266.86−320.96) | 364.67 ± 145.26 (325.02−404.32) | <.001 |
| Bilirubin (mg/dl) | 0.55 ± 0.35 (0.5−0.61) | 0.61 ± 0.51 (0.46−0.77) | 0.52 ± 0.28 (0.46−0.59) | 0.54 ± 0.26 (0.47−0.62) | .403 |
| Troponin T (ng/l) | 18.96 ± 25.46 (14.96−22.96) | 28.41 ± 47.56 (13.39−43.42) | 15 ± 6.09 (13.49−16.51) | 16.44 ± 8.73 (14.01−18.87) | .02 |
| D-dimer (ng/mL) | 1,041.4 ± 1,185.5 (860.83−1,221.97) | 737.38 ± 511.66 (577.94−896.83) | 979.58 ± 850.63 (781.11−1,178.04) | 1,367.47 ± 1,765.46 (880.85−1,854.09) | .03 |
| Pro-BNP (pg/mL) | 779.23 ± 3,386.93 (215.32−1,343.15) | 2,347.54 ± 6,529.31 (104.65−4,590.44) | 216.68 ± 564.9 (65.4−367.96) | 311.48 ± 702.72 (111.77−511.19) | .006 |
| Ferritin (ng/mL) | 997.37 ± 997.15 (827.63−1,167.1) | 471.69 ± 520.98 (286.96−656.42) | 1,134.76 ± 825.52 (907.21−1,362.29) | 839.16 ± 1,265.97 (839.16−1,566.41) | .002 |
| IL-6 (pg/mL) | 88.25 ± 318.29 (28.38−148.12) | 30.84 ± 18.98 (22.64−39.05) | 66.07 ± 190.04 (8.97−123.16) | 142.2 ± 471.17 (2.83−287.18) | .336 |
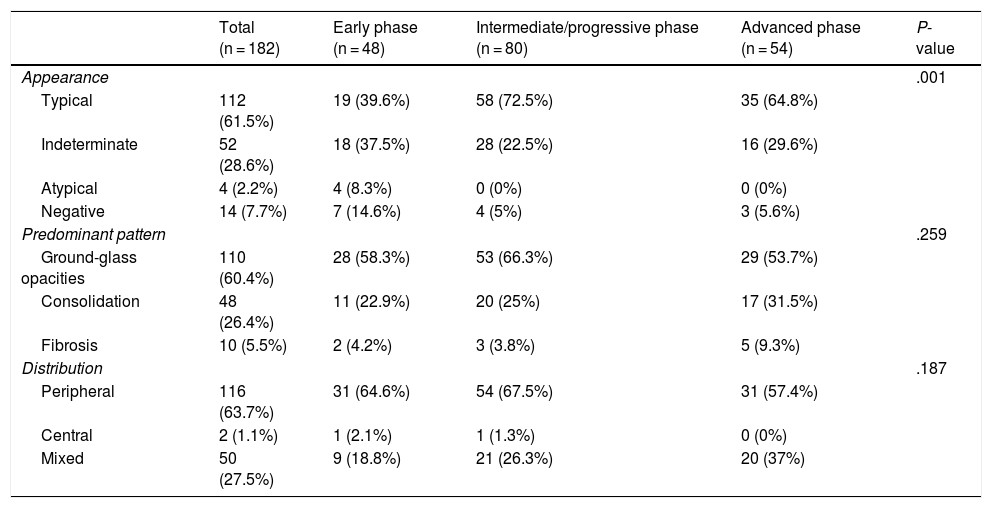
The chest CT scans were performed a mean of 2.38 ± 1.25 days (2.01–2.74) after onset of symptoms in the early phase group, 7.08 ± 1.17 days (6.82–7.33) in the intermediate/progressive phase group and 12.04 ± 2.39 days (11.38–12.69) in the advanced phase group. Overall, the predominant pattern was ground-glass opacities (n = 110, 60.4%), the most frequent distribution was peripheral (n = 116, 63.7%), and the most common appearance was typical (n = 112, 61.5%). Most of the patients had bilateral lung involvement (n = 153, 84.1%). Fourteen patients (7.7%) with a positive RT-PCR test had a normal chest CT (Table 2).
Appearance, pattern and predominant distribution of tomographic findings in patients with COVID-19, according to the course of the infection.
| Total (n = 182) | Early phase (n = 48) | Intermediate/progressive phase (n = 80) | Advanced phase (n = 54) | P-value | |
|---|---|---|---|---|---|
| Appearance | .001 | ||||
| Typical | 112 (61.5%) | 19 (39.6%) | 58 (72.5%) | 35 (64.8%) | |
| Indeterminate | 52 (28.6%) | 18 (37.5%) | 28 (22.5%) | 16 (29.6%) | |
| Atypical | 4 (2.2%) | 4 (8.3%) | 0 (0%) | 0 (0%) | |
| Negative | 14 (7.7%) | 7 (14.6%) | 4 (5%) | 3 (5.6%) | |
| Predominant pattern | .259 | ||||
| Ground-glass opacities | 110 (60.4%) | 28 (58.3%) | 53 (66.3%) | 29 (53.7%) | |
| Consolidation | 48 (26.4%) | 11 (22.9%) | 20 (25%) | 17 (31.5%) | |
| Fibrosis | 10 (5.5%) | 2 (4.2%) | 3 (3.8%) | 5 (9.3%) | |
| Distribution | .187 | ||||
| Peripheral | 116 (63.7%) | 31 (64.6%) | 54 (67.5%) | 31 (57.4%) | |
| Central | 2 (1.1%) | 1 (2.1%) | 1 (1.3%) | 0 (0%) | |
| Mixed | 50 (27.5%) | 9 (18.8%) | 21 (26.3%) | 20 (37%) |
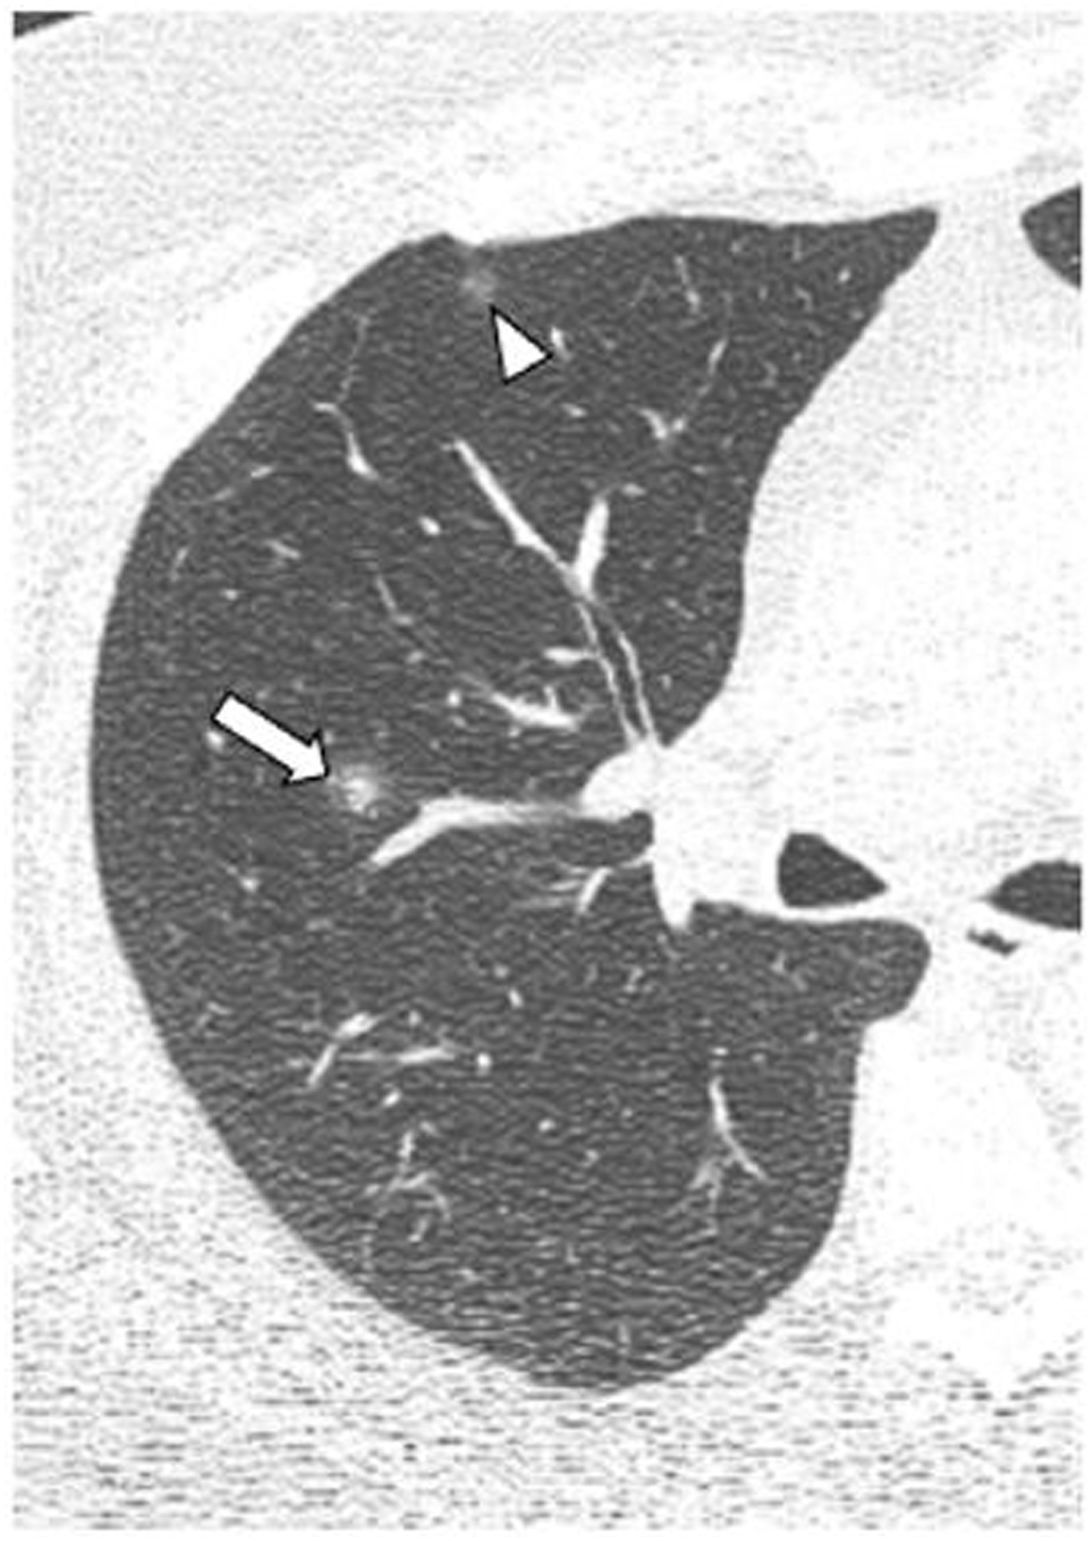
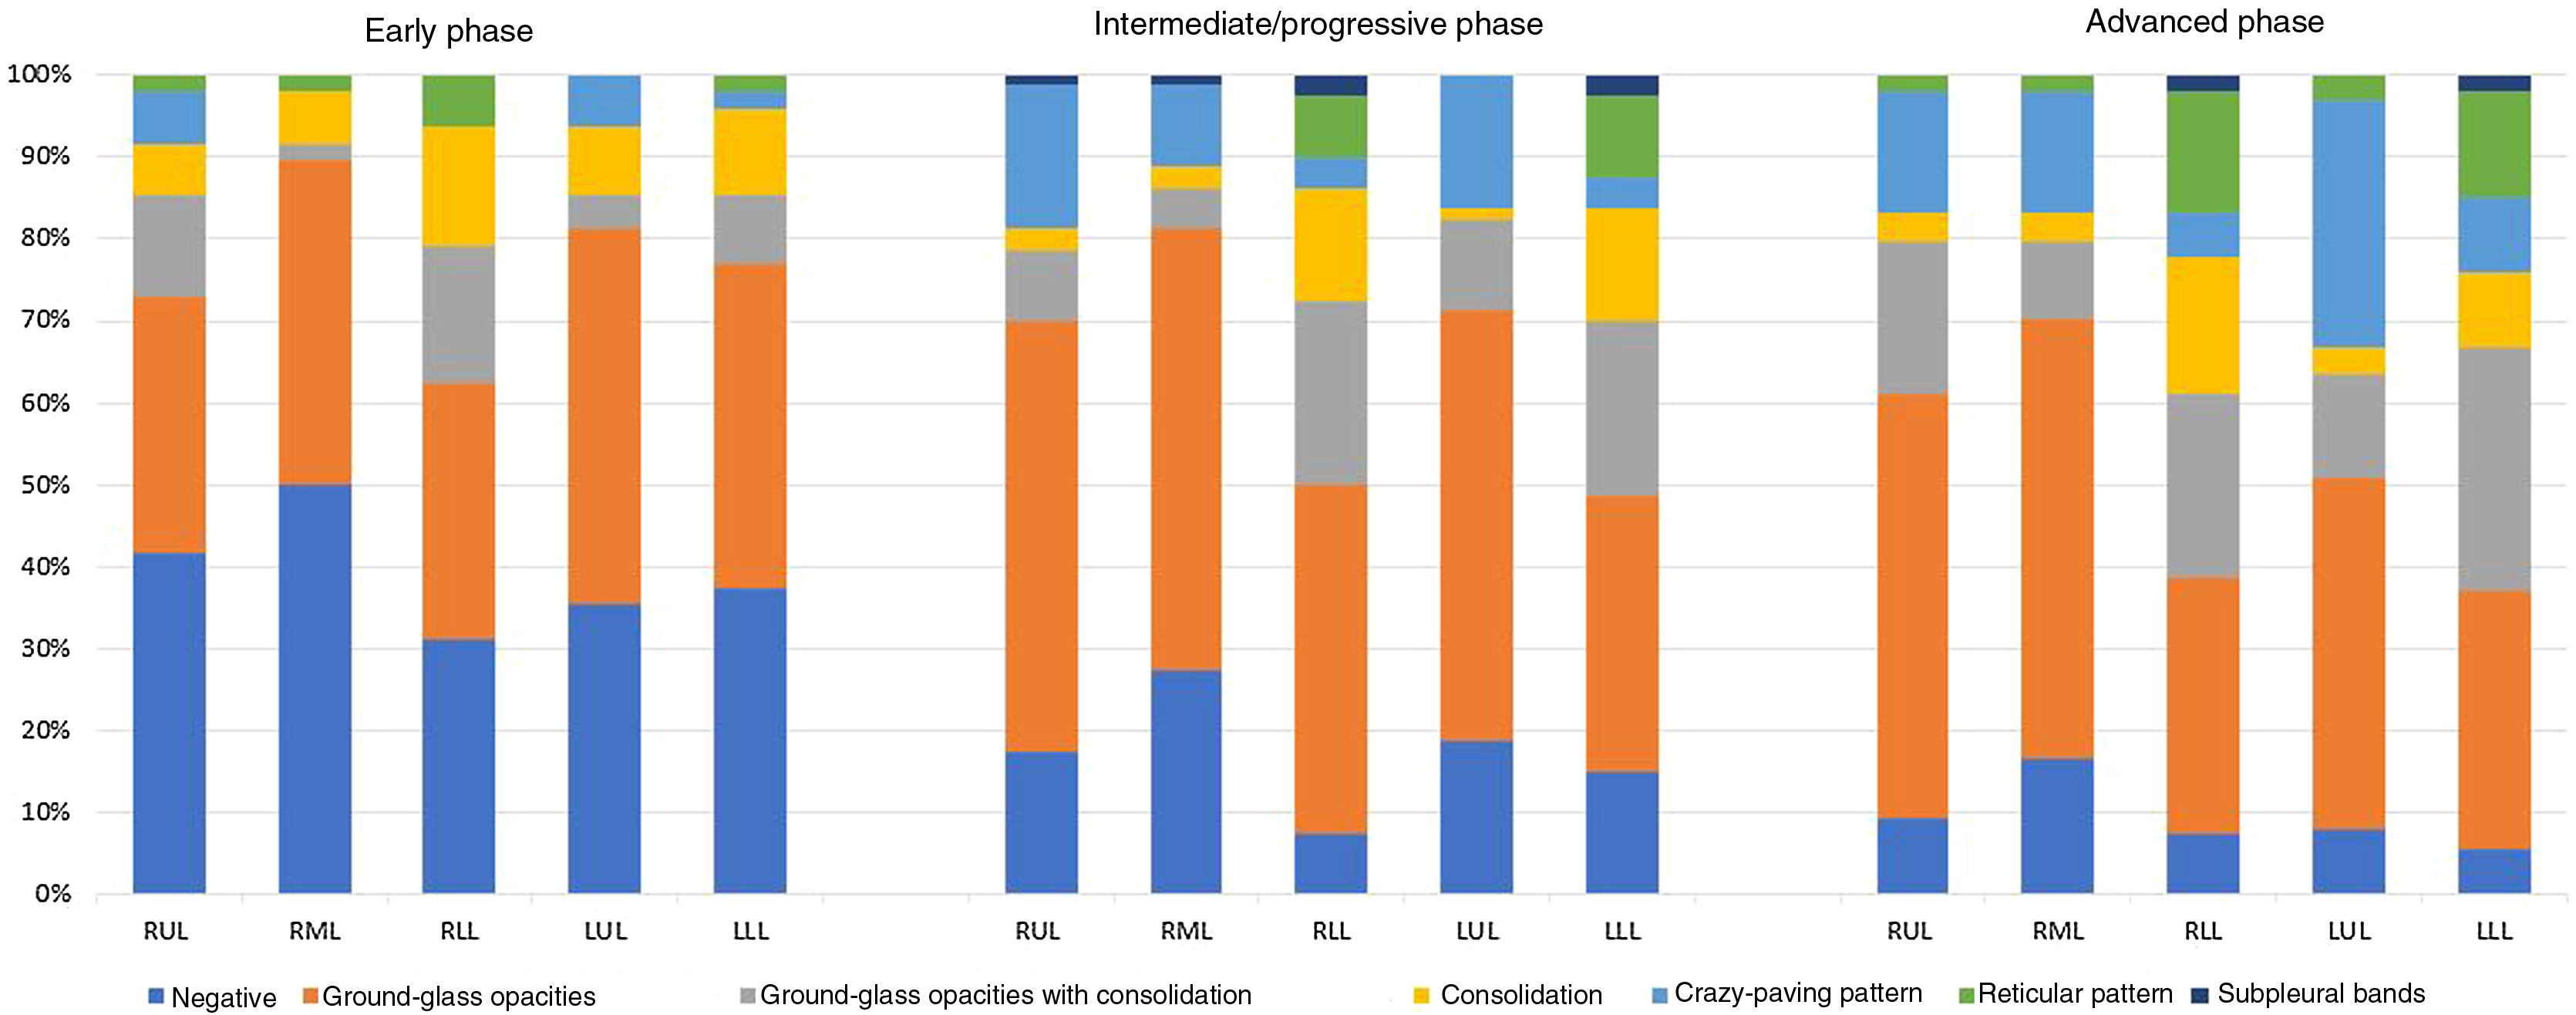
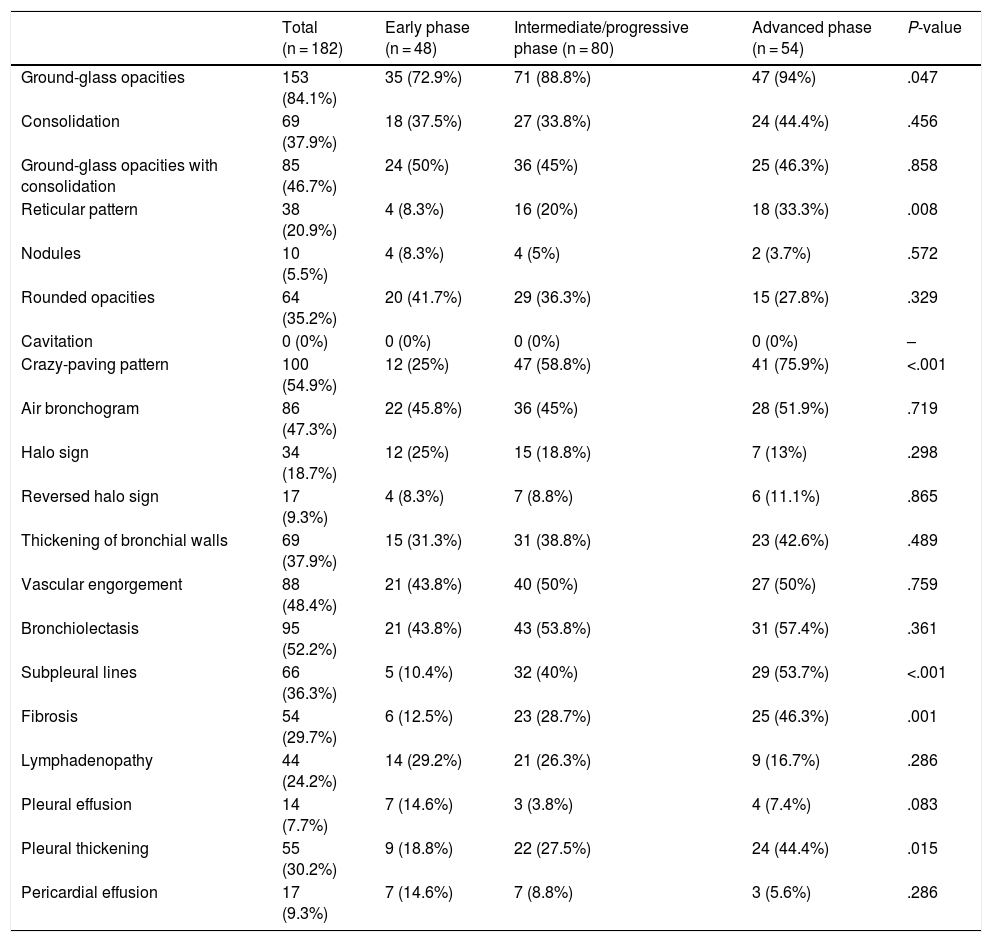
A summary of the CT findings of all the patients analysed is provided in Table 3. The most common finding was ground-glass opacities (n = 153, 84.1%), followed by crazy-paving pattern (n = 100, 54.9%), bronchiolectasis (n = 95, 52.2%) and vascular engorgement (n = 88, 48.4%). The “halo” sign was detected more frequently in the early phase than in the intermediate/progressive or advanced phases (25% vs 18.8% vs 13% respectively) (Fig. 2). Ground-glass opacities, reticular pattern, crazy-paving pattern, subpleural lines, pleural thickening and fibrosis were found more frequently in the intermediate/progressive phase (Fig. 3) and, above all, in the advanced phase (Fig. 4). No statistically significant differences were found between groups in thirteen of the findings analysed, including consolidation, round/pseudonodular opacities, air bronchogram, “halo” sign, vascular engorgement and presence of bronchiolectasis. Rarer findings, such as lymphadenopathy, pleural effusion and pericardial effusion, were identified in 24.2%, 7.7%, and 9.3% of patients, respectively. The different predominant patterns on CT according to the stage of infection are shown in Fig. 5.
Chest CT findings in patients with COVID-19 in the early, intermediate/progressive and advanced stages of the disease.
| Total (n = 182) | Early phase (n = 48) | Intermediate/progressive phase (n = 80) | Advanced phase (n = 54) | P-value | |
|---|---|---|---|---|---|
| Ground-glass opacities | 153 (84.1%) | 35 (72.9%) | 71 (88.8%) | 47 (94%) | .047 |
| Consolidation | 69 (37.9%) | 18 (37.5%) | 27 (33.8%) | 24 (44.4%) | .456 |
| Ground-glass opacities with consolidation | 85 (46.7%) | 24 (50%) | 36 (45%) | 25 (46.3%) | .858 |
| Reticular pattern | 38 (20.9%) | 4 (8.3%) | 16 (20%) | 18 (33.3%) | .008 |
| Nodules | 10 (5.5%) | 4 (8.3%) | 4 (5%) | 2 (3.7%) | .572 |
| Rounded opacities | 64 (35.2%) | 20 (41.7%) | 29 (36.3%) | 15 (27.8%) | .329 |
| Cavitation | 0 (0%) | 0 (0%) | 0 (0%) | 0 (0%) | – |
| Crazy-paving pattern | 100 (54.9%) | 12 (25%) | 47 (58.8%) | 41 (75.9%) | <.001 |
| Air bronchogram | 86 (47.3%) | 22 (45.8%) | 36 (45%) | 28 (51.9%) | .719 |
| Halo sign | 34 (18.7%) | 12 (25%) | 15 (18.8%) | 7 (13%) | .298 |
| Reversed halo sign | 17 (9.3%) | 4 (8.3%) | 7 (8.8%) | 6 (11.1%) | .865 |
| Thickening of bronchial walls | 69 (37.9%) | 15 (31.3%) | 31 (38.8%) | 23 (42.6%) | .489 |
| Vascular engorgement | 88 (48.4%) | 21 (43.8%) | 40 (50%) | 27 (50%) | .759 |
| Bronchiolectasis | 95 (52.2%) | 21 (43.8%) | 43 (53.8%) | 31 (57.4%) | .361 |
| Subpleural lines | 66 (36.3%) | 5 (10.4%) | 32 (40%) | 29 (53.7%) | <.001 |
| Fibrosis | 54 (29.7%) | 6 (12.5%) | 23 (28.7%) | 25 (46.3%) | .001 |
| Lymphadenopathy | 44 (24.2%) | 14 (29.2%) | 21 (26.3%) | 9 (16.7%) | .286 |
| Pleural effusion | 14 (7.7%) | 7 (14.6%) | 3 (3.8%) | 4 (7.4%) | .083 |
| Pleural thickening | 55 (30.2%) | 9 (18.8%) | 22 (27.5%) | 24 (44.4%) | .015 |
| Pericardial effusion | 17 (9.3%) | 7 (14.6%) | 7 (8.8%) | 3 (5.6%) | .286 |
. A more anterior ground-glass opacity (arrowhead) is also identified.")
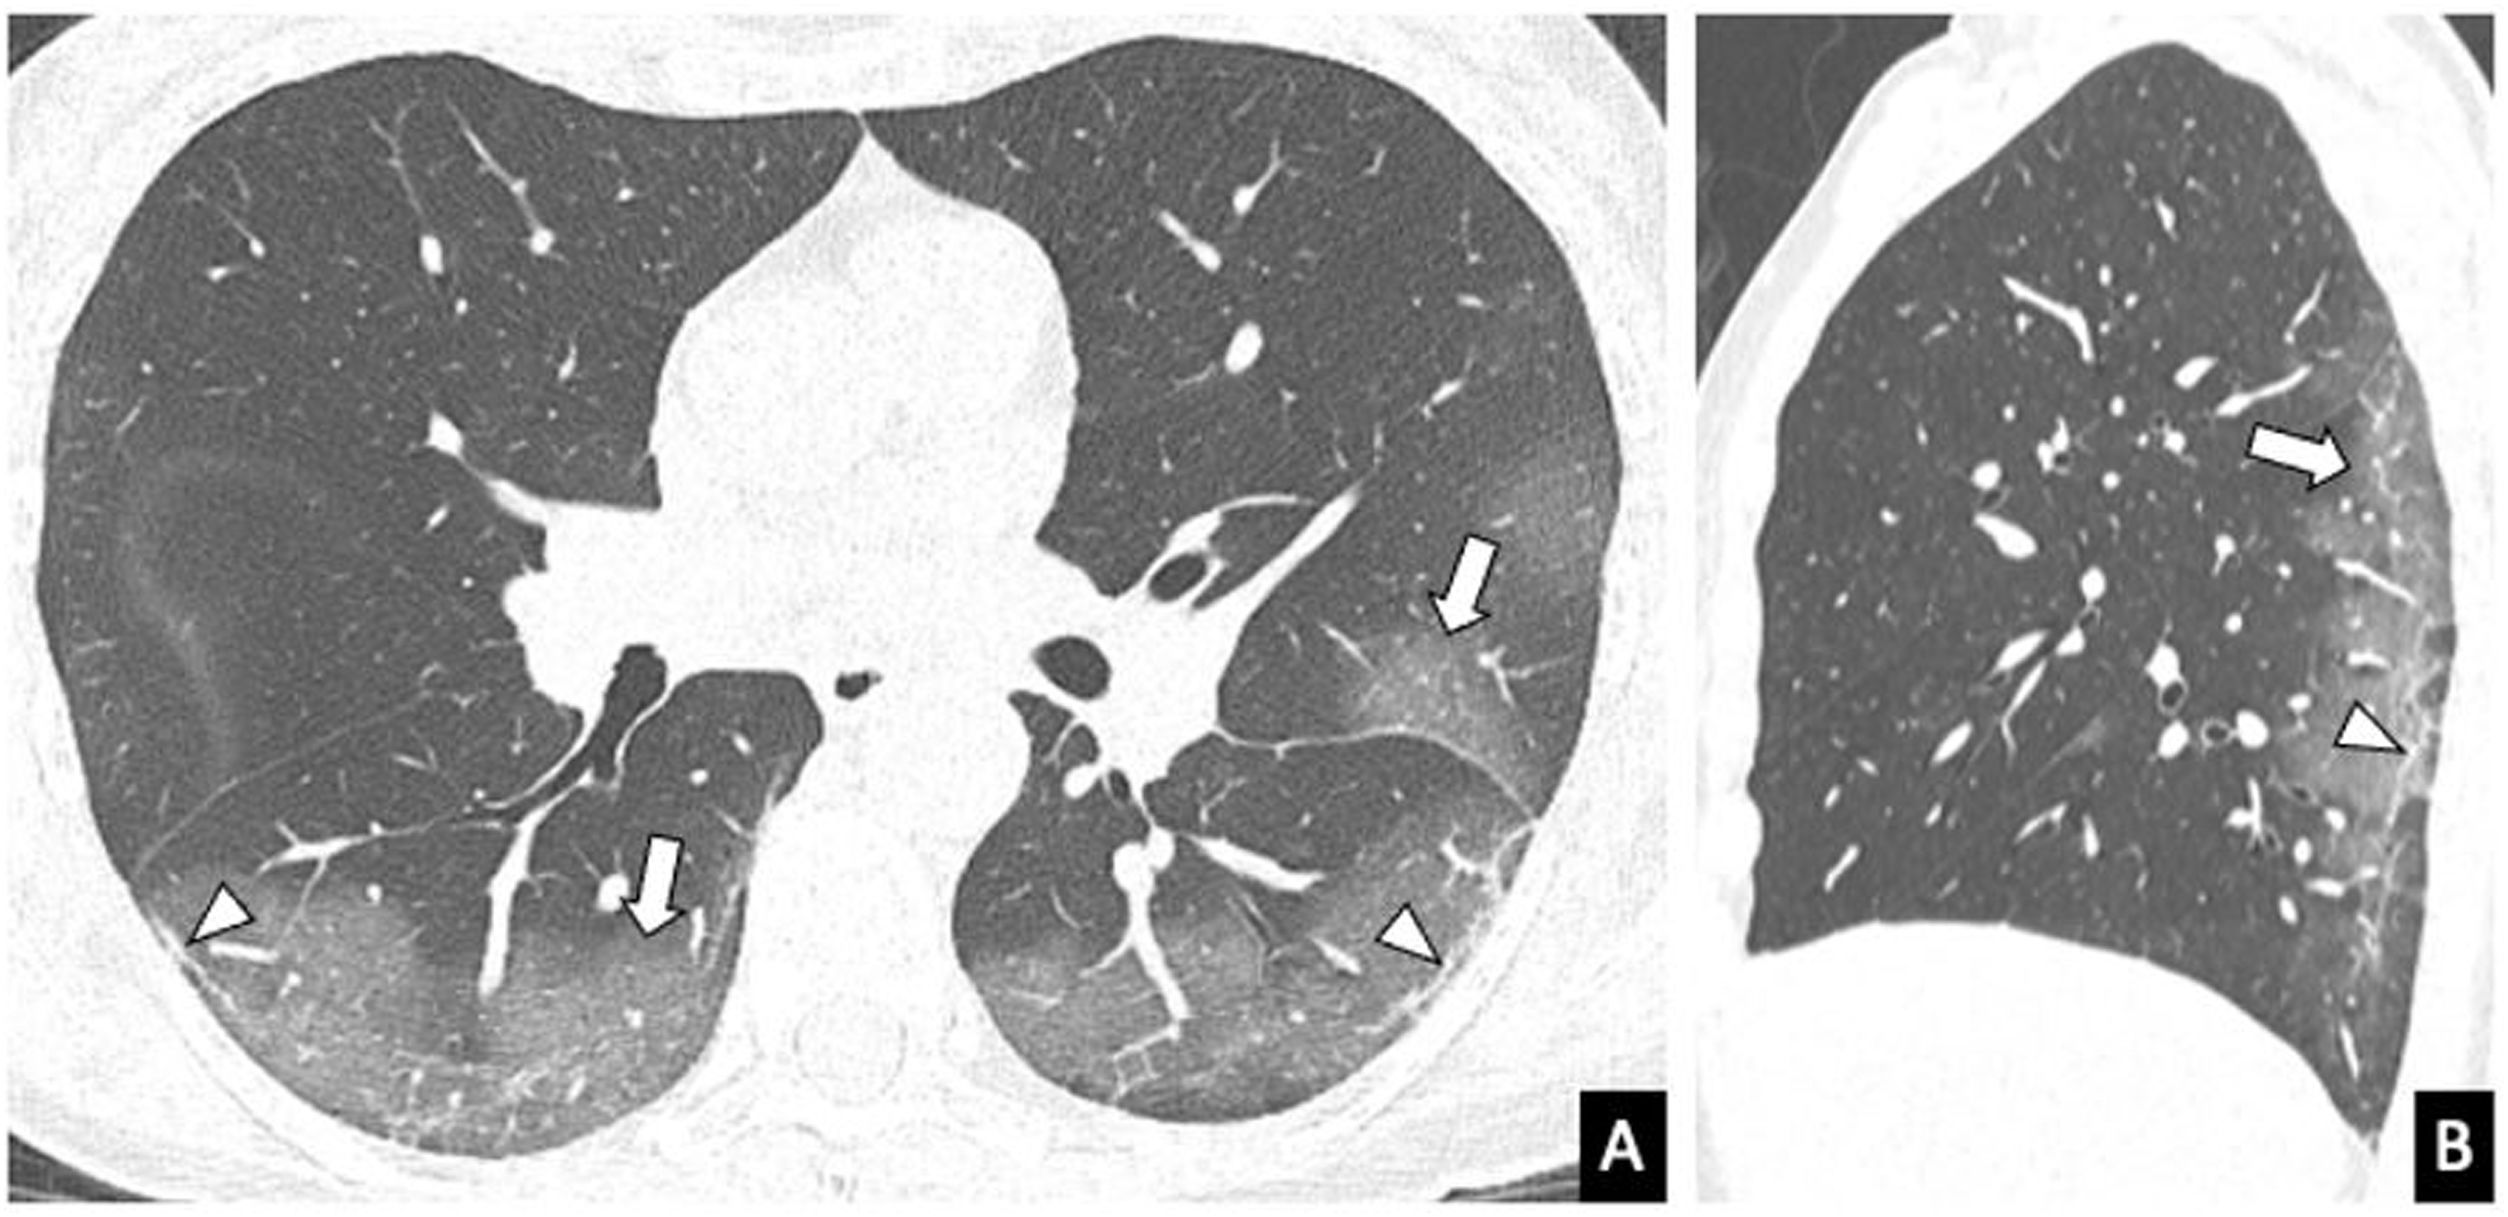
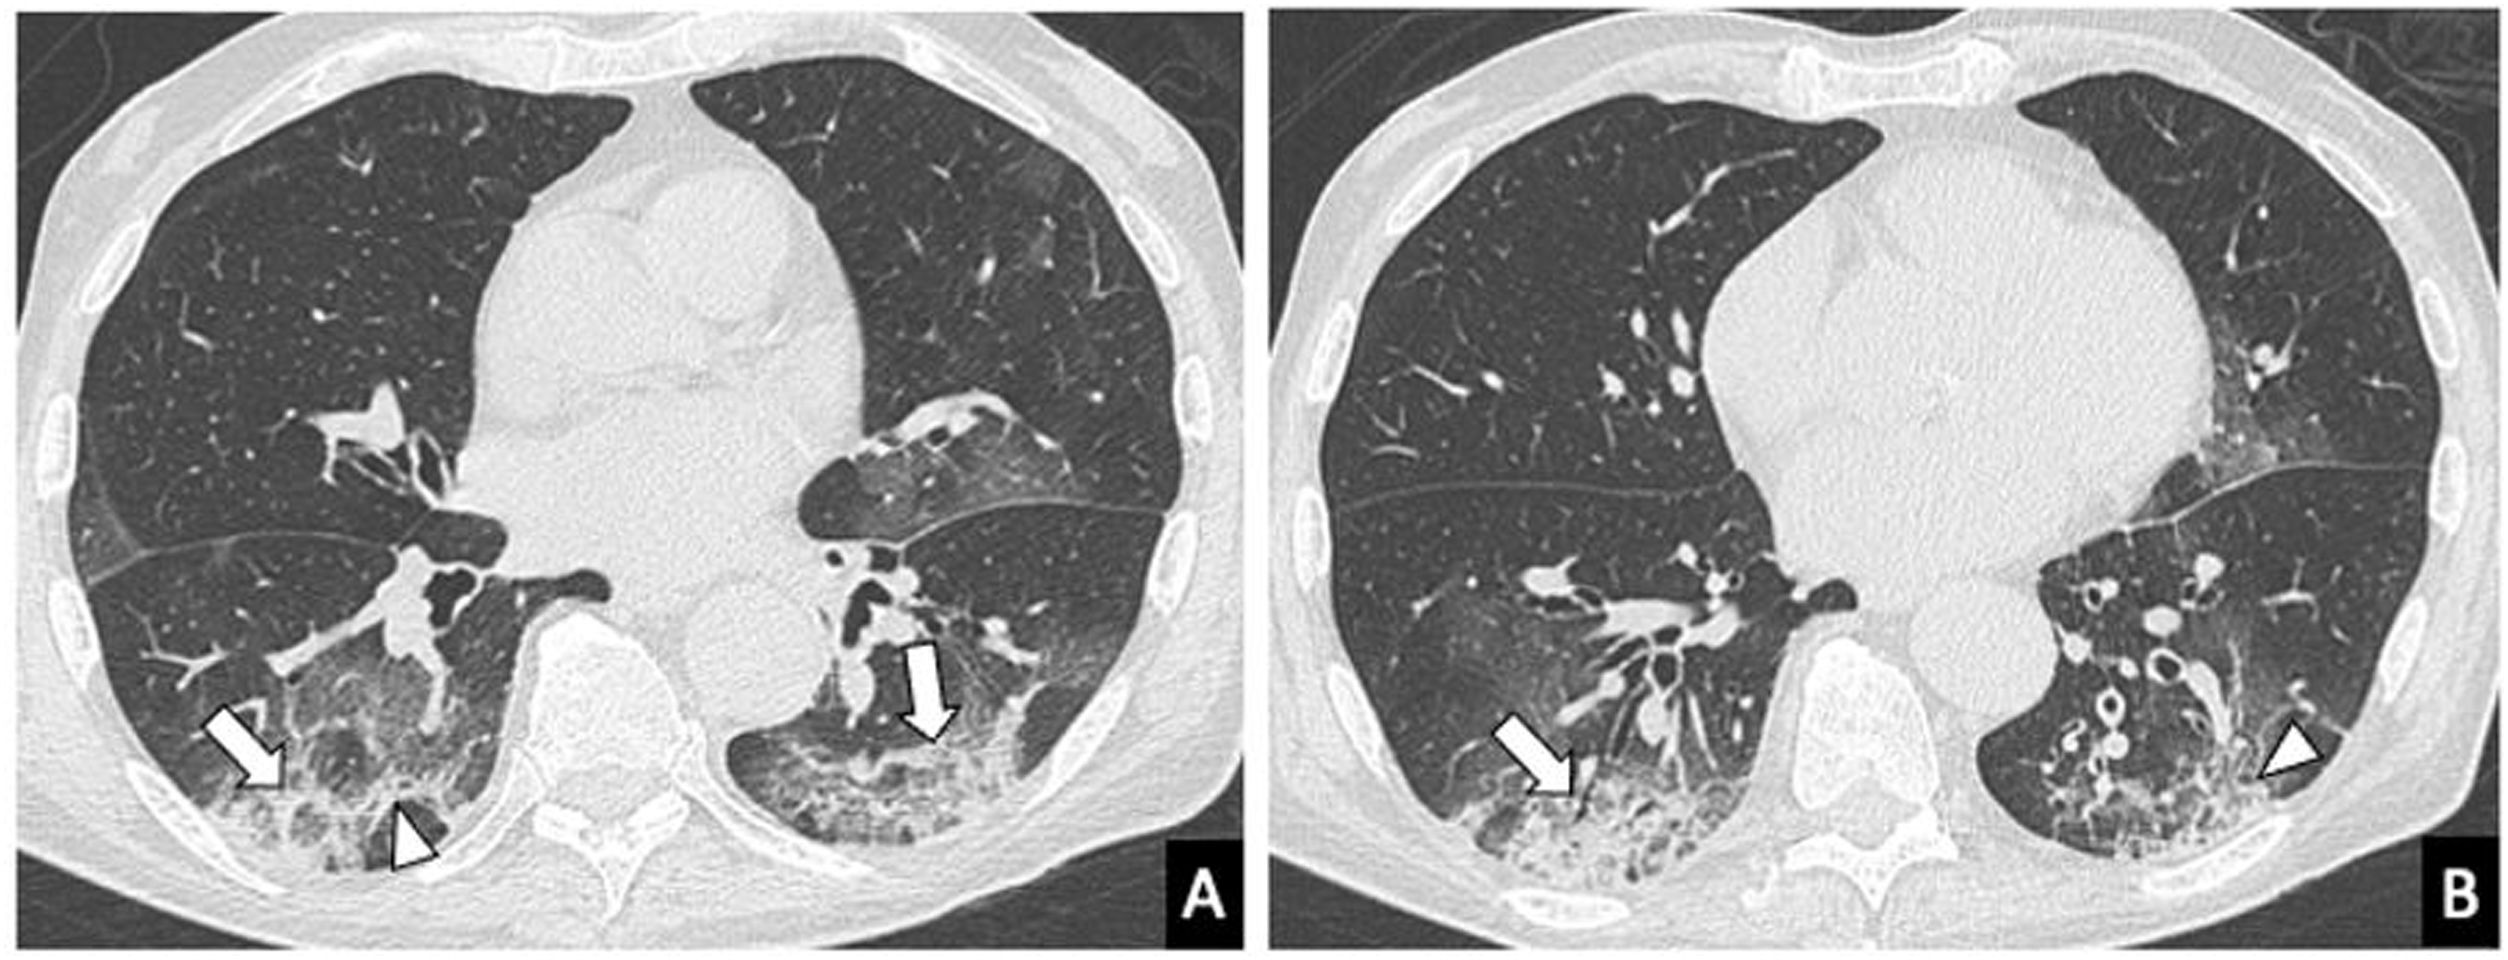
 of a 57-year-old woman with COVID-19 performed 8 days after the onset of symptoms (intermediate/progressive phase of the disease). A) Axial reconstruction. B) Sagittal reconstruction. Peripheral ground-glass opacities, predominantly in posterior segments of the lower lobes and left upper lobe (arrows), vascular engorgement (star) and subpleural lines (arrow heads).")
Chest computed tomography (parenchyma window) of a 57-year-old woman with COVID-19 performed 8 days after the onset of symptoms (intermediate/progressive phase of the disease). A) Axial reconstruction. B) Sagittal reconstruction. Peripheral ground-glass opacities, predominantly in posterior segments of the lower lobes and left upper lobe (arrows), vascular engorgement (star) and subpleural lines (arrow heads).
. A and B) Axial images showing consolidation (arrows) and ground-glass opacities and a reticular pattern with thickening of the interlobular septa (arrow heads) with peripheral distribution.")
Chest computed tomography in an 83-year-old male with COVID-19 and with symptoms for 2 weeks (advanced stage of the disease). A and B) Axial images showing consolidation (arrows) and ground-glass opacities and a reticular pattern with thickening of the interlobular septa (arrow heads) with peripheral distribution.

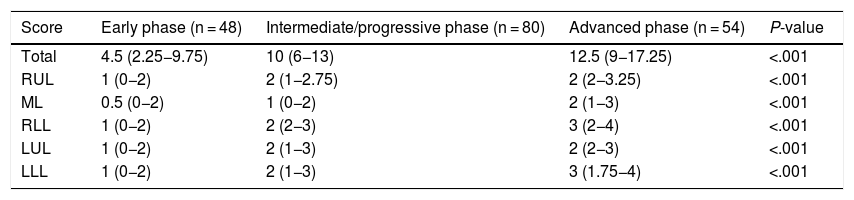
The median (IQR) severity score for total lung volume was 10 (5–13). The following median scores (IQR) were obtained for each lobe: RUL 2 (1−3), ML 1 (0−2), RLL 2 (2−3), LUL 2 (1−3), LLL 2 (1−3). Patients in the early phase of the disease had a significantly lower severity score (4.5 [2.25−9.75]) than individuals in the intermediate/progressive phase (10 [6–13]) or advanced phase (12.5 [9−17.25]) (P < .001). In the independent analysis of each lobe, the highest severity scores were obtained in the most advanced stages of the disease (Table 4).
Total visual severity score and score for each lobe in the early, intermediate/progressive and advanced stages of the disease.
| Score | Early phase (n = 48) | Intermediate/progressive phase (n = 80) | Advanced phase (n = 54) | P-value |
|---|---|---|---|---|
| Total | 4.5 (2.25−9.75) | 10 (6−13) | 12.5 (9−17.25) | <.001 |
| RUL | 1 (0−2) | 2 (1−2.75) | 2 (2−3.25) | <.001 |
| ML | 0.5 (0−2) | 1 (0−2) | 2 (1−3) | <.001 |
| RLL | 1 (0−2) | 2 (2−3) | 3 (2−4) | <.001 |
| LUL | 1 (0−2) | 2 (1−3) | 2 (2−3) | <.001 |
| LLL | 1 (0−2) | 2 (1−3) | 3 (1.75−4) | <.001 |
LLL: left lower lobe; LUL: left upper lobe; ML: middle lobe; RLL: right lower lobe; RUL: right upper lobe.
Interobserver agreement (k) for the predominant appearance, distribution and pattern was 0.92, 0.84 and 0.70, respectively. For the extent of lung involvement, the interobserver agreement was excellent for the total score (k = 0.89), and the score for each lobe (RUL, k = 0.9; ML, k = 0.89; RLL, k = 0.87; LUL, k = 0.88; LLL, k = 0.83).
DiscussionThis observational study describes the main tomography findings in patients with suspected or diagnosed COVID-19 pneumonia based on time since onset of symptoms. Overall, the predominant radiological pattern was ground-glass involvement; the area most frequently affected was the periphery of the lungs; and the appearance most detected was that classed as “typical”. However, in a considerable number of cases (30.8%), the radiological presentation of the infection was considered as “indeterminate” or “atypical”, especially in the early stages of the disease.
Nevertheless, particularly at times when the evolution of the pandemic places limitations on diagnosis by RT-PCR (availability of kits, time needed to process biological samples, or high rates of false positives), chest CT is an extremely useful complementary tool that not only contributes to the early diagnosis of COVID-19 pneumonia, but also provides added prognostic value to clinical and analytical parameters. A meta-analysis showed sensitivity of 94% and 89% for chest CT and RT-PCR, respectively, while the negative predictive value ranged from 95.4% to 99.8% for chest CT, and 96.8% to 99.9% for RT-PCR.26 Taking these results into account, the National Health Commission of the People’s Republic of China promoted the diagnosis of SARS-CoV-2 infection, with a high degree of certainty, based solely on the clinical data and chest CT findings.27,28 However, in our study, 14 patients (7.7%) with positive RT-PCR did not have chest CT abnormalities, which suggests that the imaging test has a lower negative predictive value in the initial stages of the disease. Caruso et al.29 also had two negative chest CT scans in patients with positive RT-PCR (3.3%) in their study. As in previous studies,11,30 ground-glass opacity was the main finding in our cohort (84.1% of the patients). The opacity was most often bilateral (84.1%) and peripheral (63.7%). Similarly, Bernheim et al. described bilateral lung involvement in 28% of the patients in the early phase of the disease, 76% in the intermediate/progressive phase, and 88% in the advanced phase.10 Moreover, ground-glass opacity was frequently associated with other patterns, such as the crazy-paving pattern or consolidation, both of which are more common in the intermediate/progressive and advanced stages of the disease.10,12 However, although bilateral, multilobar, peripheral lung involvement manifesting as ground-glass opacities, with or without associated consolidation, is considered a typical CT characteristic of COVID-19 pneumonia, this pattern is not specific and thus not exclusive to SARS-CoV-2 infection, and can be found in other viral pneumonias. Some authors have therefore suggested that chest CT should only be used as a screening tool in high prevalence regions, to avoid a high proportion of false positives.30
In our cohort, we also frequently identified other CT findings, such as crazy-paving pattern, vascular engorgement and bronchiolectasis. In contrast, solid nodules, the “inverted halo” sign, cavitation and pleural or pericardial effusion were unusual findings.6–11 The presence of a greater number or greater extension of consolidated areas and signs of fibrosis (such as the reticular pattern, subpleural lines or pleural thickening) were more prevalent in patients who were in the advanced phase of the disease. In view of the dynamic nature of the tomography findings in COVID-19 pneumonia, imaging may play an important role in monitoring the progress of the infection, and in assessing the response to treatment.31
Additionally, quantifying the extent of lung involvement may be one of the cornerstones of the use of CT in the initial assessment of patients with COVID-19. In the absence of sophisticated post-processing software (e.g. self-study programs), visual assessment of the extent of inflammatory lung involvement can provide useful clinical information. In our study, the degree of severity of the pneumonia, measured with the visual score described, was greater in patients who were at a later stage of the infection. Patients in the early phase of the disease had a lower score (4.5 [2.25−9.75]) than individuals in the intermediate/progressive phase (10 [6–13]) or advanced phase (12.5 [9−17.25]). Zhou et al.6 obtained higher severity scores on chest CT scans in patients in the intermediate/progressive phase than in those in the early phase. The excellent interobserver agreement in our study also shows that the suggested tomography score is an accessible and reproducible tool for estimating the severity of lung involvement in COVID-19 pneumonia, even when used by radiologists with less experience.
Our study has a number of limitations. Firstly, we only analysed a small number of COVID-19 patients and only included chest CT scans of patients with a positive RT-PCR test. The inclusion of patients with a negative RT-PCR or with infections caused by other pathogens could be of interest to compare radiological findings. A secondary analysis of the tomography findings of patients with subclinical infection (asymptomatic) could also be of interest. Some studies32 have shown the presence of abnormalities on CT scans of asymptomatic patients, prior to the onset of symptoms. Secondly, visual CT scores have not been correlated with clinical severity scores. Recently, Xiong Y et al. found that some clinical or laboratory values, such as RT-PCR, erythrocyte sedimentation rate and lactate dehydrogenase (LDH), correlated with the severity of pneumonia assessed on the initial CT scan.33 Lastly, we did not analyse the relationship between clinical comorbidities and CT findings. It would be interesting in future studies to include a greater number of patients with COVID-19 pneumonia and study the prognostic value that imaging tests add to clinical and analytical parameters.
In conclusion, our study suggests that chest CT is a useful imaging technique for assessing lung involvement in COVID-19 patients. Although the tomographic diagnosis of typical COVID-19 pneumonia is based on the presence of bilateral and peripheral ground-glass opacities, it is common to find other manifestations on chest CT, which also vary according to the time since onset of the symptoms. Recognising imaging patterns is crucial to understanding the natural history of the disease. The semiquantitative visual score used in this study is an easy, useful and reproducible tool for assessing the severity of lung involvement in COVID-19. Further research is needed to validate this score and its correlation with clinical and analytical findings.
Authorship- 1
Responsible for study integrity: ISA.
- 2
Study conception: ISA and GBA.
- 3
Study design: ISA and GBA.
- 4
Data acquisition: ISA, AEC, FMF, AIR, APN, JPV and GBA.
- 5
Data analysis and interpretation: ISA, AEC, APN and GBA.
- 6
Statistical processing: ISA, AEC, APN and GBA.
- 7
Literature search: ISA and GBA.
- 8
Drafting of the article: ISA and GBA.
- 9
Critical review of the manuscript with intellectually relevant contributions: ISA, AEC, APN and GBA.
- 10
Approval of the final version: ISA and GBA.
The authors declare that they have no conflicts of interest.
Please cite this article as: Soriano Aguadero I, Ezponda Casajús A, Mendoza Ferradas F, Igual Rouilleault A, Paternain Nuin A, Pueyo Villoslada J, et al. Hallazgos en la tomografía computarizada de tórax en las fases evolutivas de la infección por SARS-CoV-2. Radiología. 2021;63:218–227.

