


Neuroinflammation is involved in the pathophysiology of various neurological disorders, in particular Alzheimer disease (AD) and Parkinson’s disease (PD). Alterations in the blood-brain barrier may allow peripheral blood lymphocytes to enter the central nervous system; these may participate in disease pathogenesis.
ObjectiveTo evaluate the peripheral blood lymphocyte profiles of patients with AD and PD and their association with the disease and its progression.
MethodsThe study included 20 patients with AD, 20 with PD, and a group of healthy individuals. Ten of the patients with AD and 12 of those with PD were evaluated a second time 17 to 27 months after the start of the study. Lymphocyte subpopulations and their activation status were determined by flow cytometry. All patients underwent neurological examinations using internationally validated scales.
ResultsCompared to healthy individuals, patients with AD and PD showed significantly higher levels of activated lymphocytes, lymphocytes susceptible to apoptosis, central memory T cells, and regulatory T and B cells. As the diseases progressed, there was a significant decrease in activated cells (CD4+ CD38+ and CD8+ CD38+ in PD and AD, CD4+ CD69+ and CD8+ CD69+ in PD), T cells susceptible to apoptosis, and some regulatory populations (CD19+ CD5+ IL10+ in PD and AD, CD19+ CD5+ IL10+ FoxP3+, CD4+ FoxP3+ CD25+ CD45RO+ in PD). In patients with AD, disease progression was associated with lower percentages of CD4+ CD38+ cells and higher percentages of effector CD4 cells at the beginning of the study. Significant differences were observed between both diseases.
ConclusionsThis study provides evidence of changes in peripheral blood lymphocyte phenotypes associated with AD and PD and their severity. Considering effective blood-brain communication, our results open new avenues of research into immunomodulation therapies to treat these diseases.
Introducción. La neuroinflamación está involucrada en la fisiopatología de diferentes trastornos neurológicos, en particular la enfermedad de Alzheimer (EA) y la enfermedad de Parkinson (EP). Las alteraciones en la barrera hematoencefálica pueden permitir la entrada al sistema nervioso central de linfocitos periféricos, los cuales pueden participar a la patología de las enfermedades. Objetivo. Evaluar el perfil de linfocitos periféricos en pacientes con EA y EP y su asociación con la enfermedad y su progresión. Métodos. Se incluyeron 20 pacientes con EA, 20 pacientes con EP y un grupo de individuos sanos. Diez de los pacientes con EA y 12 de los pacientes con EP fueron evaluados una segunda vez 17 a 27 meses después del inicio del estudio. Las subpoblaciones de linfocitos y su estado de activación se determinaron mediante citometría de flujo. Todos los pacientes fueron evaluados neurológicamente utilizando escalas validadas internacionalmente. Resultados. Los pacientes con EA y EP mostraron un aumento significativo en los niveles de linfocitos activados, linfocitos susceptibles a la apoptosis, células T de memoria central y células T y B reguladores con respecto a los sujetos sanos. A medida que las enfermedades progresaron, se observó una disminución significativa de las células activadas (CD4+ CD38+ y CD8+ CD38+ en EP y EA; CD4+ CD69+ y CD8+ CD69+ en EP), de las células T susceptibles a la apoptosis y de algunas poblaciones reguladoras (CD19+ CD5+ IL10+ en EP y EA; CD19+ CD5+ IL10+ FoxP3+, CD4+ FoxP3+ CD25+ CD45RO+ en EP). En pacientes con EA, la progresión de la enfermedad se asoció con porcentajes más bajos de CD4+ CD38 + y mayores porcentajes de células CD4 efectoras al comienzo del estudio. Se observaron diferencias significativas entre ambas enfermedades. Conclusiones. Este estudio proporciona evidencia de cambios en los fenotipos de linfocitos periféricos asociados a EA y EP y a su gravedad. Teniendo en cuenta la comunicación efectiva sangre-cerebro, nuestros resultados abren nuevas vías para explorar terapias de inmunomodulación para tratar estas enfermedades.
The prevalence of neurodegenerative diseases is continuously increasing, mainly due to higher survival rates.1,2 Although the most obvious risk factor is advanced age, other factors also participate.3–5 Alzheimer disease (AD) and Parkinson’s disease (PD) are the most frequent neurodegenerative diseases.6,7 AD is clinically characterised by memory loss and cognitive impairment. While PD does present with non-motor symptoms, the characteristic symptoms include tremor, bradykinesia, and muscle rigidity.8 Both disorders are caused by progressive neuronal loss, which mainly involves the cerebral cortex, hippocampus, and amygdala in AD and is largely limited to the dopaminergic neurons of the substantia nigra pars compacta in PD.9 Furthermore, there are differences in the pathological hallmarks of both conditions. Extracellular amyloid plaques and intracellular neurofibrillary tangles are the main findings in AD,10 whereas intracellular inclusions formed by aggregation of misfolded alpha-synuclein, known as Lewy bodies, are the main characteristic in PD.11,12
A neuroinflammatory response is clearly present in both diseases. Microglial and astrocytic activation, the presence of proinflammatory cytokines, and alterations to the blood-brain barrier enable the infiltration of peripheral cells into the central nervous system, which has been demonstrated in both diseases.13,14 Although the role of neuroinflammation in the pathogenesis of these conditions is yet to be fully understood, it is generally considered to be a detrimental phenomenon that is involved in the neurodegenerative process.15,16 Therefore, the study of peripheral blood lymphocyte profiles in patients with these conditions is relevant for several reasons.17 Firstly, they may be used as biomarkers in screening tests, facilitating early diagnosis.14,18 Furthermore, considering that peripheral immune cells can reach the central nervous system, they may play different roles in modulating disease progression, depending on their phenotype.19
Several studies have analysed the distribution of peripheral blood lymphocyte phenotypes in patients with AD and PD.20 Although results have been contradictory, most studies assessing patients with AD and comparing them with controls showed a decrease in the percentage and absolute number of CD3+ and CD19+ lymphocytes21,22 and an increase in the percentage and absolute number of activated CD4+ and CD8+ T cells.22,23 Furthermore, a decreased percentage of naïve CD4+ cells (CD45RA+ /CCR7+) was reported, whereas the percentage of effector memory CD4+ cells (CD45RA−/CCR7−) and differentiated effector memory cells (CD45RA+/CCR7−) was significantly increased.24 Differences in the distribution of peripheral blood lymphocytes have also been observed in patients with PD. Specifically, the percentage of CD4+ T cells was decreased with respect to controls, as was the percentage of CD4+/CD45RA+ and CD4+/CD31+ cells, whereas the percentage of CD4+/CD45RO+ and CD4+/Fas+ cells was increased.25 These changes were more pronounced in more severe cases.25 One study reported an increase in the Th1/Th2 and Th17/Treg cell ratios in patients with PD; the increase in the Th1/Th2 ratio was associated with increased motor dysfunction.26
Considering these findings, we designed a study to further analyse the changes in peripheral blood lymphocyte subpopulations in patients with AD and PD and to identify alterations that may assist in predicting disease progression.
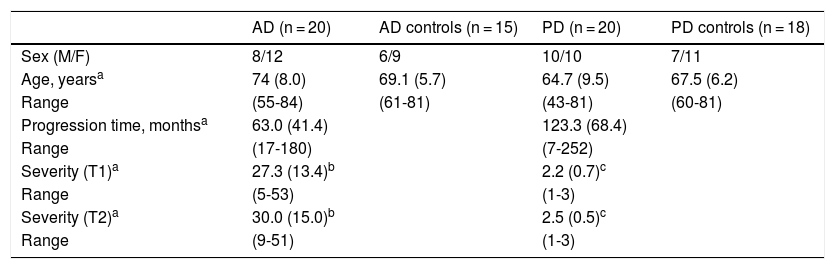
Material and methodsPatientsWe conducted a longitudinal study including 20 patients with AD and 20 with PD. Twelve patients with PD and 10 with AD were followed up for approximately 2 years (17 to 27 months). Follow-up could not be completed for all the initially assessed patients, as many of them opted not to attend the scheduled consultations. We also included a control group of healthy individuals who were matched with patients for age and sex (Table 1). We only included patients who met the NINCDS-ADRDA criteria27 for clinical diagnosis of AD and the UK Parkinson’s Disease Society Brain Bank criteria28 for PD. All patients presented sporadic AD or PD; age of onset was over 40 years for patients with PD and over 55 for patients with AD.
Demographic characteristics of patients and controls.
| AD (n = 20) | AD controls (n = 15) | PD (n = 20) | PD controls (n = 18) | |
|---|---|---|---|---|
| Sex (M/F) | 8/12 | 6/9 | 10/10 | 7/11 |
| Age, yearsa | 74 (8.0) | 69.1 (5.7) | 64.7 (9.5) | 67.5 (6.2) |
| Range | (55-84) | (61-81) | (43-81) | (60-81) |
| Progression time, monthsa | 63.0 (41.4) | 123.3 (68.4) | ||
| Range | (17-180) | (7-252) | ||
| Severity (T1)a | 27.3 (13.4)b | 2.2 (0.7)c | ||
| Range | (5-53) | (1-3) | ||
| Severity (T2)a | 30.0 (15.0)b | 2.5 (0.5)c | ||
| Range | (9-51) | (1-3) |
AD: Alzheimer disease; F: female; M: male; PD: Parkinson’s disease.
Exclusion criteria for both patients and controls were: absence of infection, inflammatory diseases, cancer, and/or metabolic disorders; and not having taken anti-inflammatory treatment in the 3 months prior to inclusion.
At the time of inclusion and at the end of the follow-up period, expert neurologists clinically assessed patients using the Hoehn and Yahr scale (patients with PD) or the Dementia Severity Rating Scale (patients with AD).29,30 Differences in scores between assessments were used to assess disease progression.
MethodsIsolation of peripheral blood mononuclear cellsWe collected 24 mL blood samples in tubes coated with ethylenediaminetetraacetic acid (BD Vacutainer). Samples were kept at room temperature and processed within 2 hours. Peripheral blood mononuclear cells were isolated using a Ficoll-Hypaque gradient.
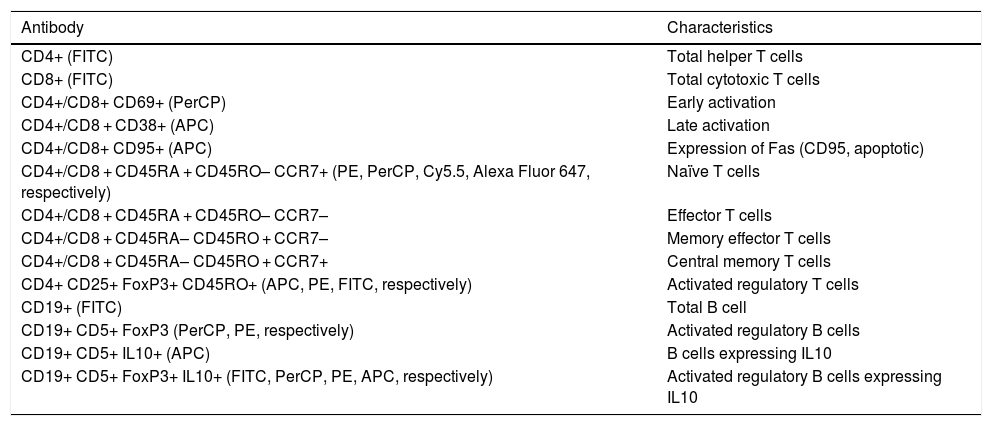
Lymphocyte phenotypingTable 2 includes the human monoclonal antibodies used for leukocyte phenotyping by flow cytometry. Prior to use, all antibodies were titrated for optimal detection of positive populations, according to the concentrations recommended by the manufacturer (BioLegend, San Diego, USA). Combinations of antibodies were used to identify different populations of lymphocytes (Table 2). We used the appropriate isotype controls.
Combinations of antibodies used in cytometry.
| Antibody | Characteristics |
|---|---|
| CD4+ (FITC) | Total helper T cells |
| CD8+ (FITC) | Total cytotoxic T cells |
| CD4+/CD8+ CD69+ (PerCP) | Early activation |
| CD4+/CD8 + CD38+ (APC) | Late activation |
| CD4+/CD8+ CD95+ (APC) | Expression of Fas (CD95, apoptotic) |
| CD4+/CD8 + CD45RA + CD45RO– CCR7+ (PE, PerCP, Cy5.5, Alexa Fluor 647, respectively) | Naïve T cells |
| CD4+/CD8 + CD45RA + CD45RO– CCR7– | Effector T cells |
| CD4+/CD8 + CD45RA– CD45RO + CCR7– | Memory effector T cells |
| CD4+/CD8 + CD45RA– CD45RO + CCR7+ | Central memory T cells |
| CD4+ CD25+ FoxP3+ CD45RO+ (APC, PE, FITC, respectively) | Activated regulatory T cells |
| CD19+ (FITC) | Total B cell |
| CD19+ CD5+ FoxP3 (PerCP, PE, respectively) | Activated regulatory B cells |
| CD19+ CD5+ IL10+ (APC) | B cells expressing IL10 |
| CD19+ CD5+ FoxP3+ IL10+ (FITC, PerCP, PE, APC, respectively) | Activated regulatory B cells expressing IL10 |
APC: allophycocyanin; FITC: fluorescein isothiocyanate; PE: phycoerythrin; PerCP: peridinin-chlorophyll-protein.
Approximately 106 peripheral blood mononuclear cells were incubated for 30 minutes at 4 °C with the corresponding mixture of antibodies. After washing, cells marked with surface antibodies were fixed with 2% paraformaldehyde in PBS. Cells that required intracellular staining were suspended in a fixation/permeabilisation solution (Invitrogen, eBioscienceTM, San Diego, USA) and incubated for 16-18 hours at 4 °C. Cells were then centrifuged and treated for 1 hour at 4 °C with 20 μL of normal rat serum diluted to 10% in permeabilisation solution (Invitrogen), and subsequently incubated with the corresponding intracellular antibody (FoxP3-PE for CD4/CD25/CD45RO T cells and FoxP3-PE and IL10-APC for CD19/CD25 B cells). After washing, cells were fixed with 2% paraformaldehyde in PBS.
Data on marked cells were acquired with a FACS Calibur cytometer. Data were analysed using the FCS Express 4 Plus Research Edition software.
Statistical analysisData were collected and organised in an Excel spreadsheet (Microsoft, Redmond, USA) and analysed using the SPSS (version 15.0; SSPS Inc., Chicago, USA) and Graphpad programs. We used parametric and non-parametric tests to statistically compare variables, according to data distribution. We compared measurements using the t test (paired samples t test when required) or the Mann-Whitney U test. The correlation between numerical variables was assessed using the Pearson or Spearman correlation coefficients, according to whether or not data was normally distributed.
Ethics declarationThis study was conducted in accordance with the Declaration of Helsinki and was approved by the Ethics Committee at the Mexican National Institute of Neurology and Neurosurgery (Mexico City, Mexico; protocol no.: 134/10). We obtained written informed consent from all participants or their close relatives.
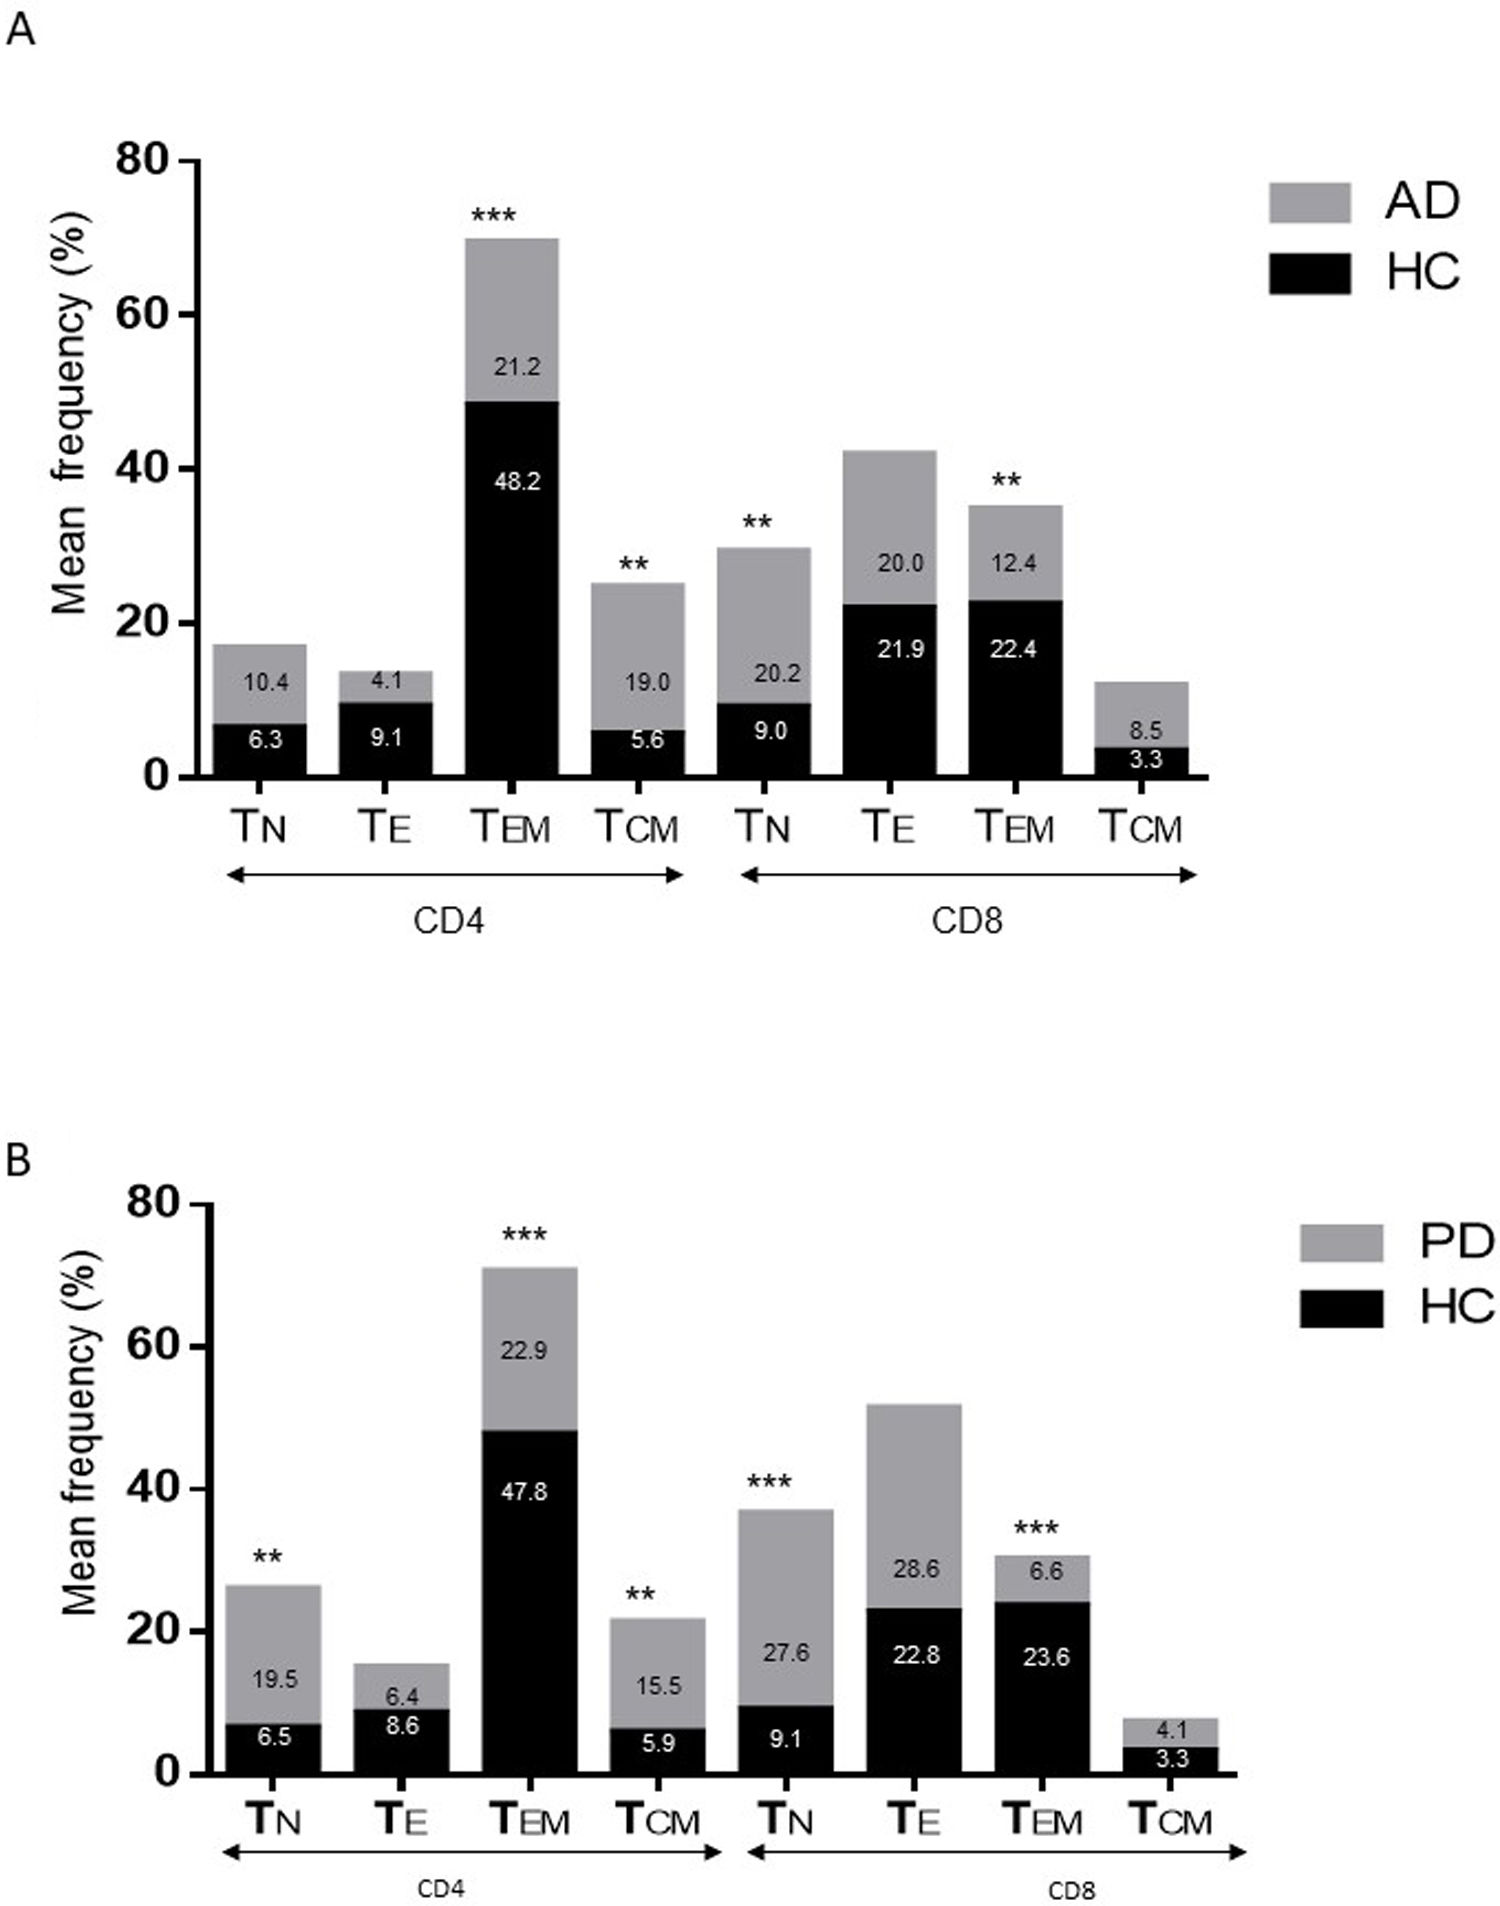
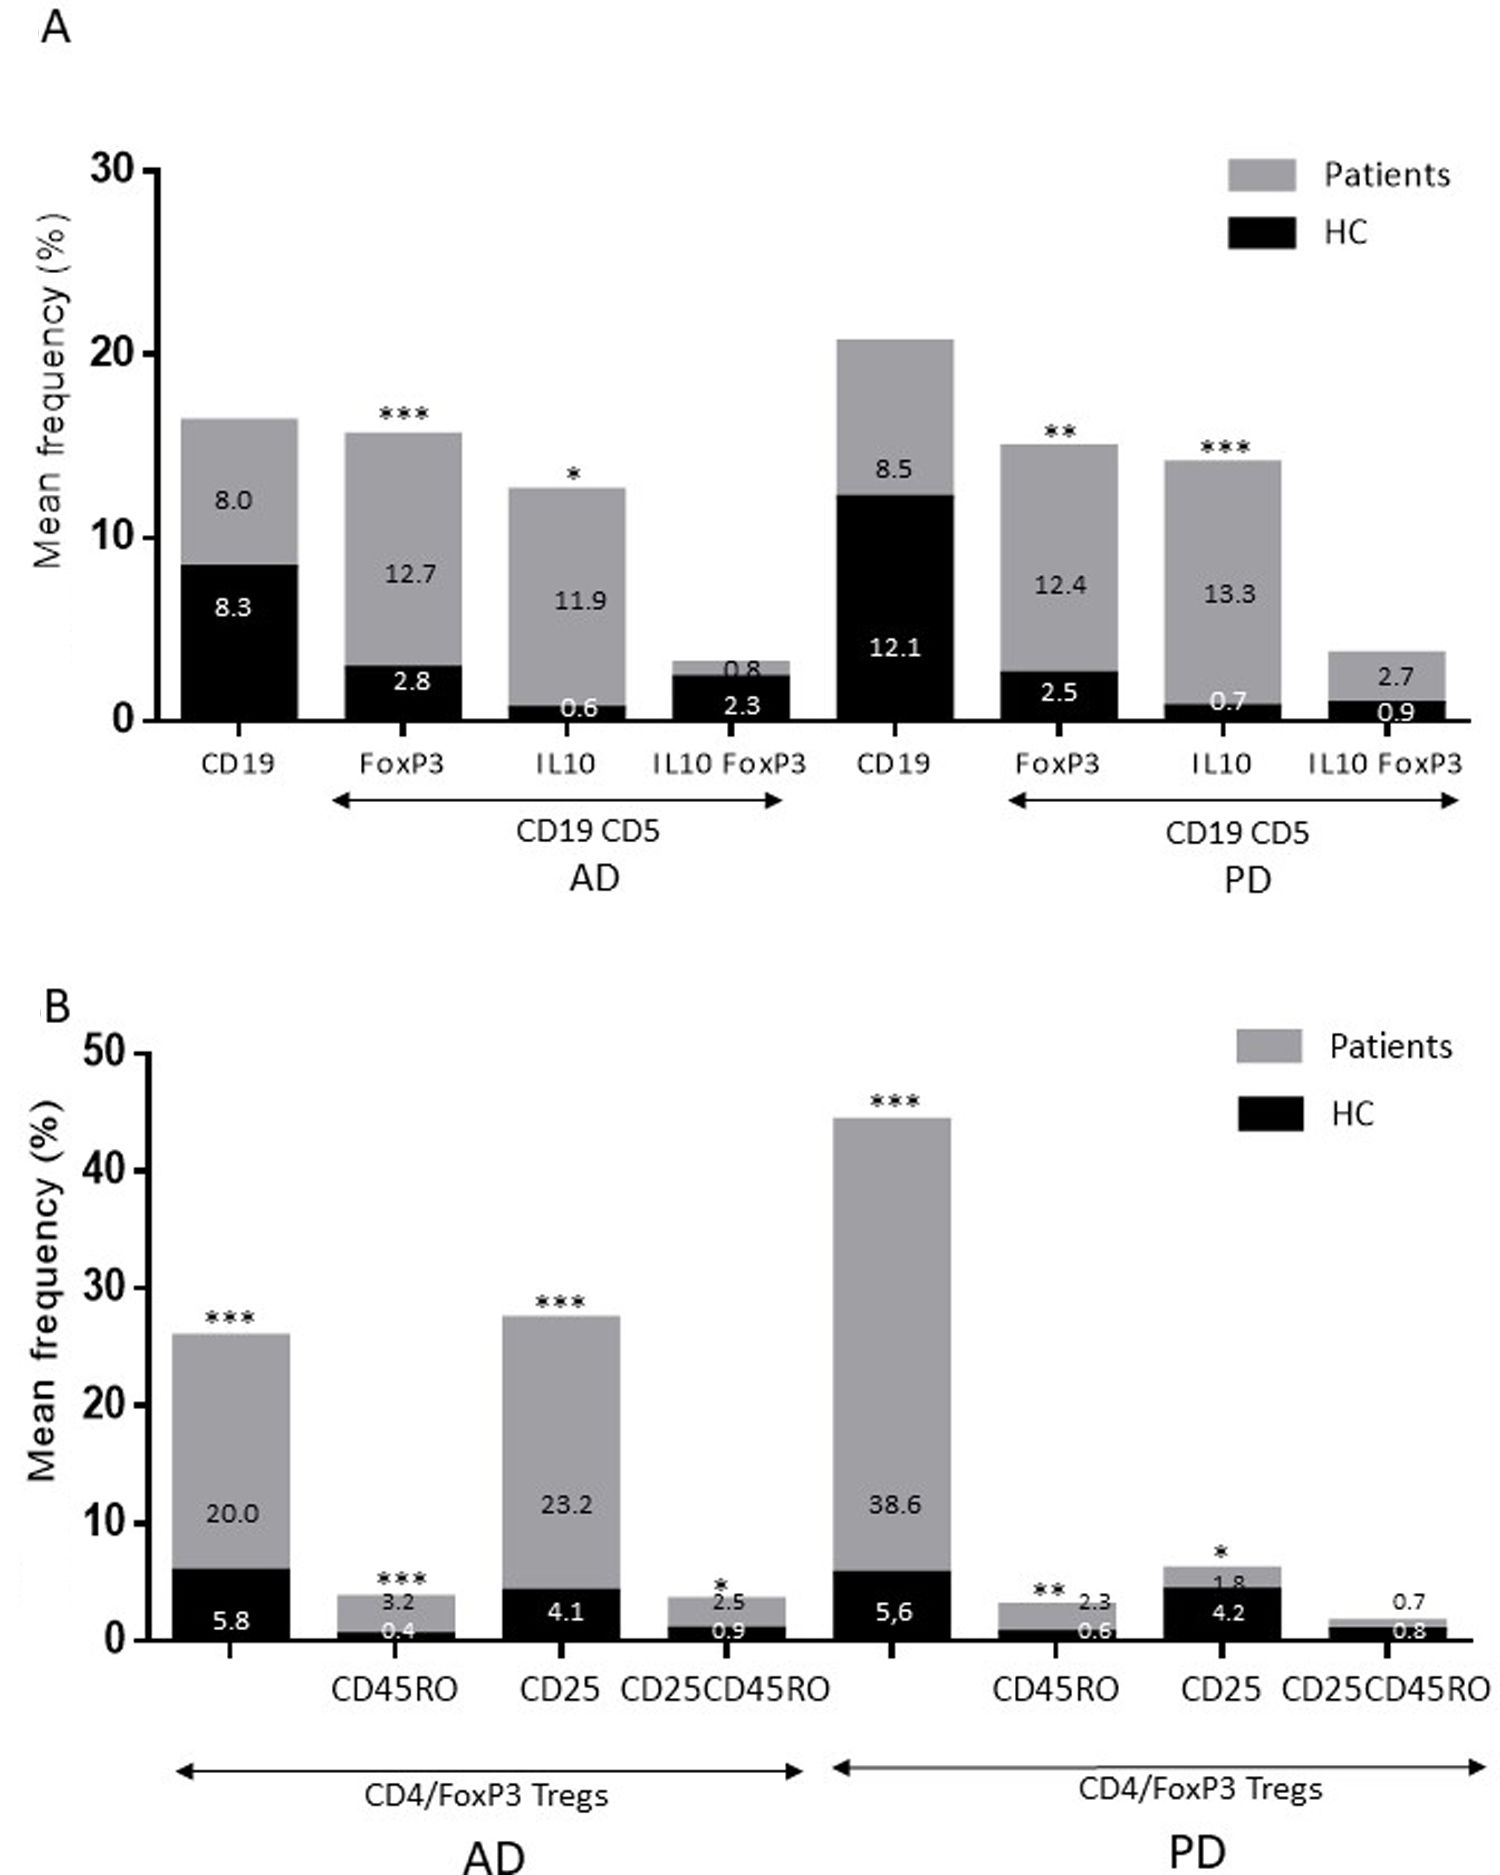
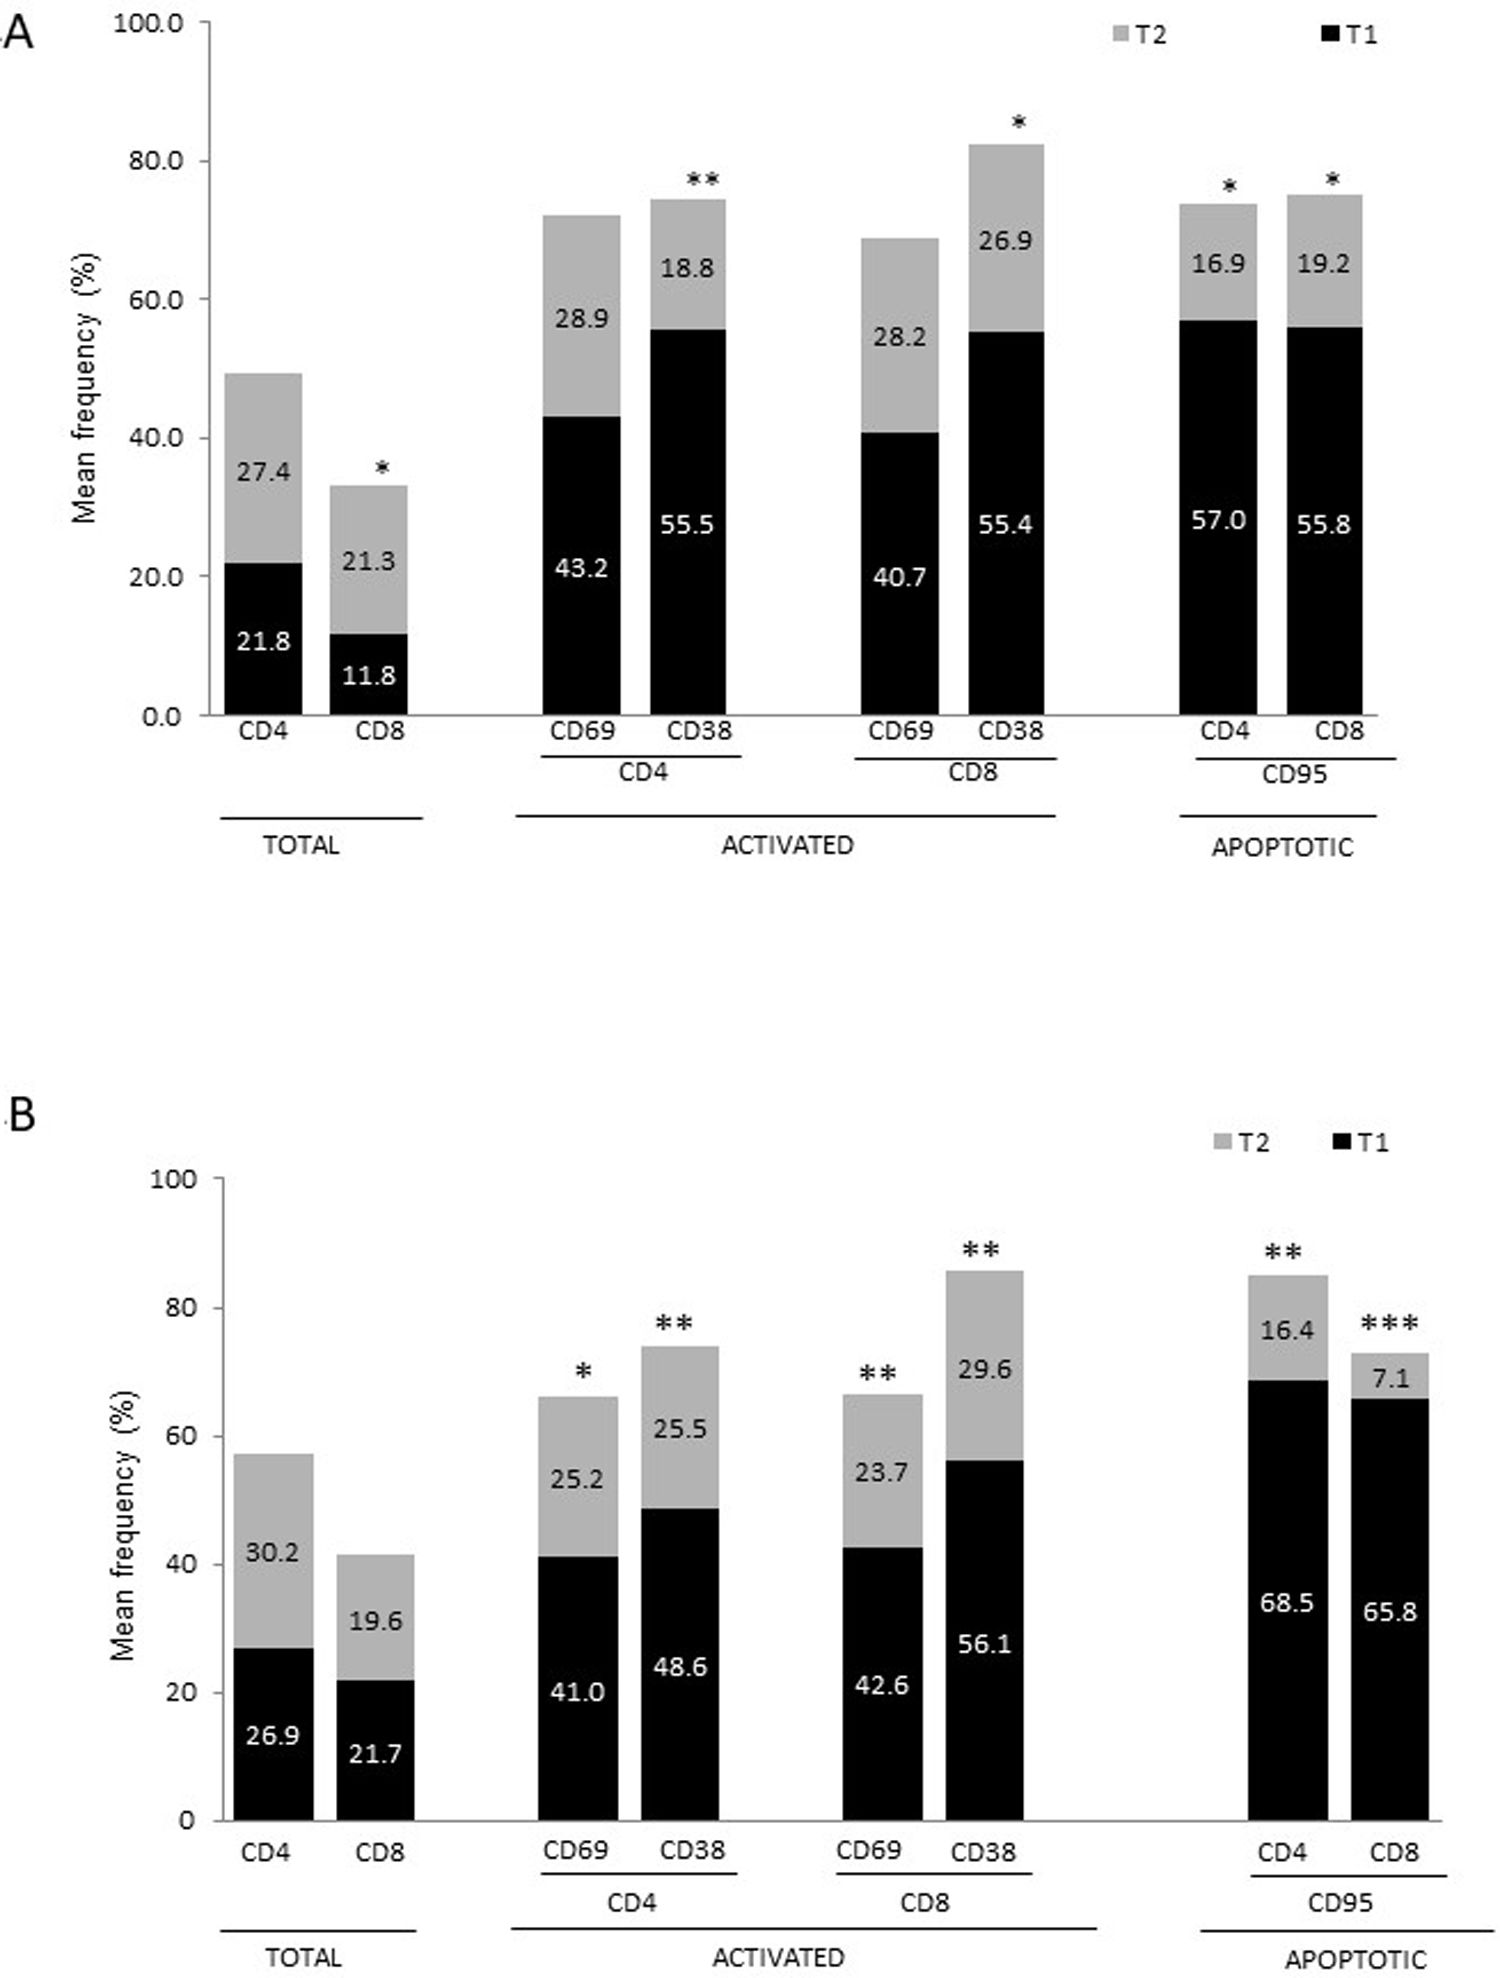
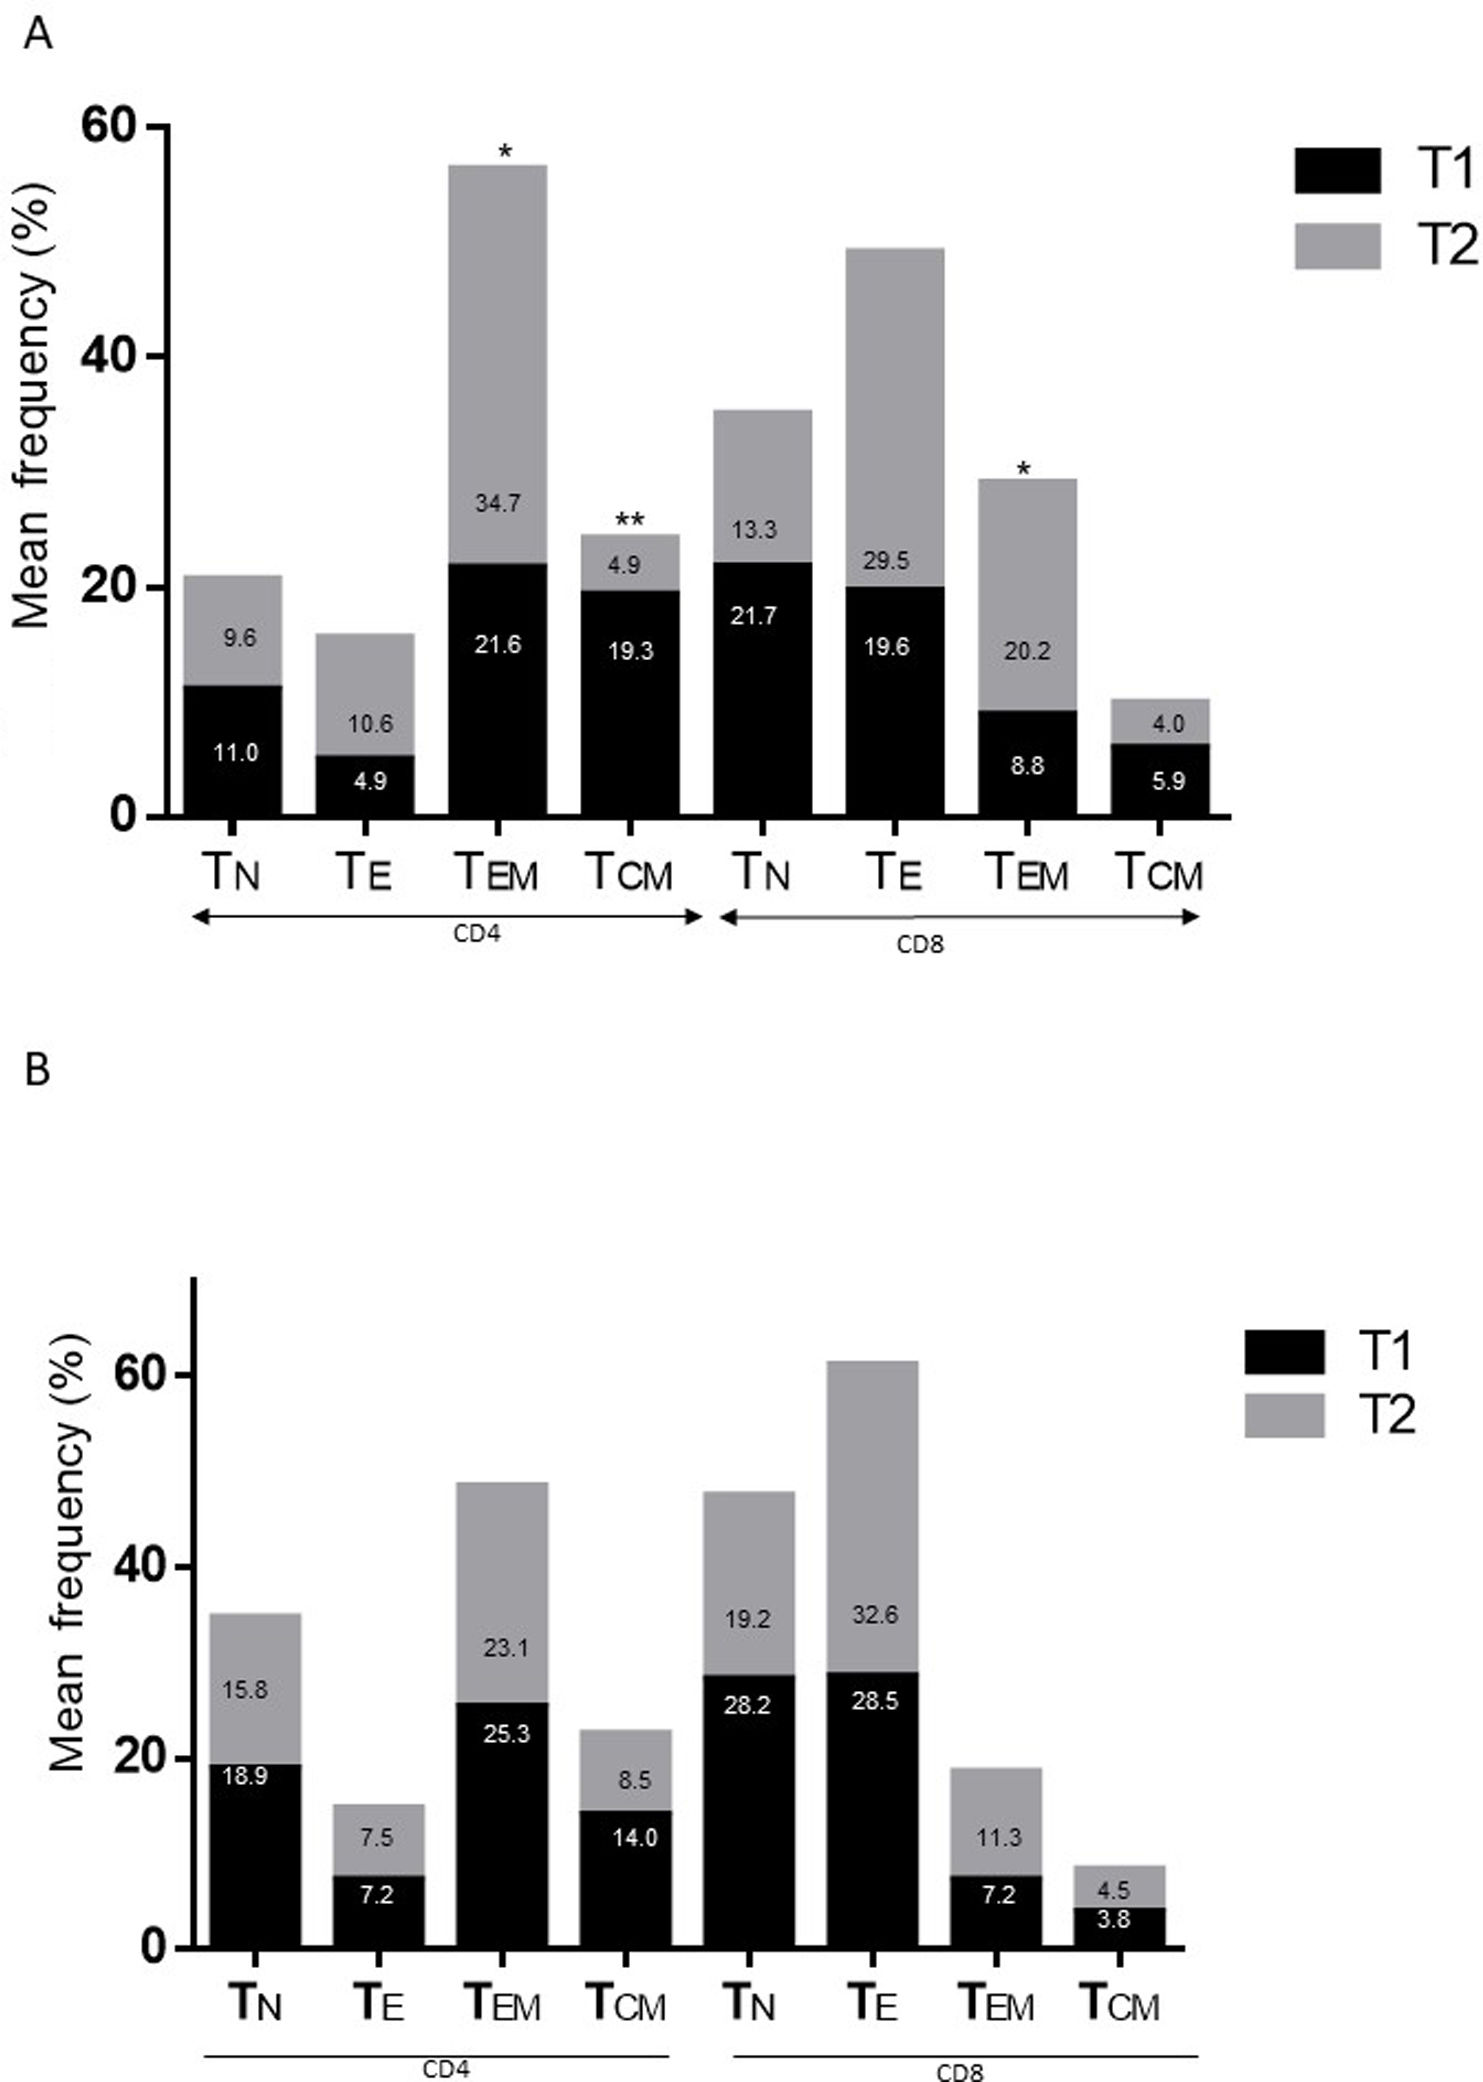
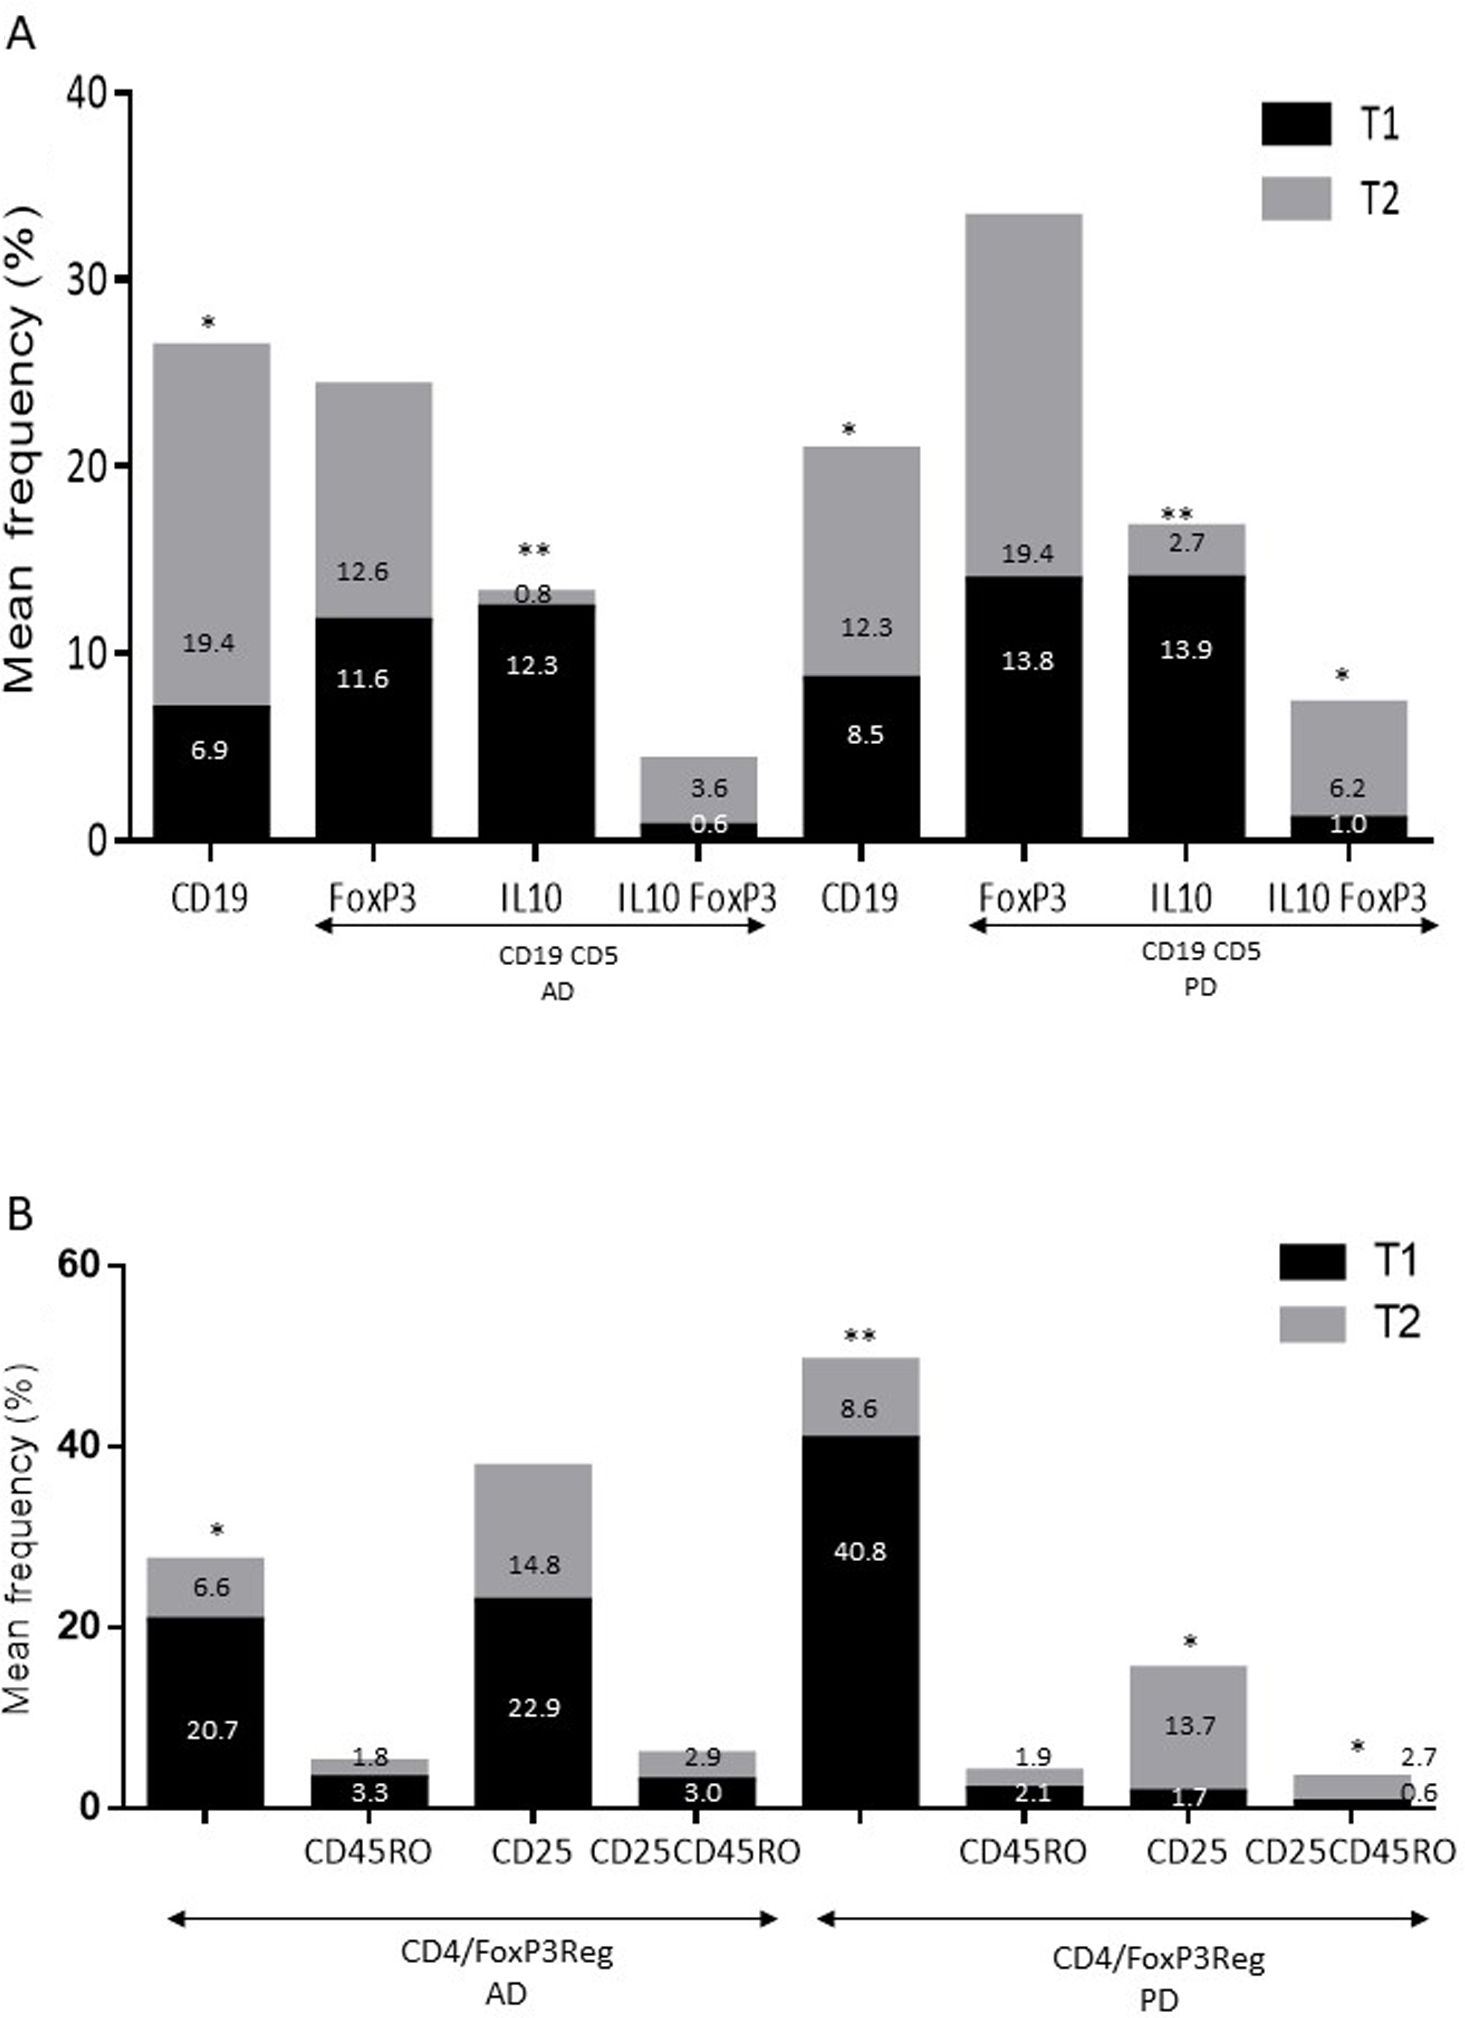
ResultsAlzheimer diseaseDifferences in lymphocyte phenotypes between patients with AD and controlsWe observed no differences between patients with AD and controls in the percentage of lymphocytes, CD4, CD8, or CD19 cells (Figs. 1A and 2A). However, we identified statistically significant differences in several lymphocyte phenotypes. We observed a significant increase in the percentage of early (CD69+) and late (CD38+) CD4 and CD8 T cells and lymphocytes expressing the apoptotic susceptibility maker CD95 (Fig. 1A). We also observed an increase in the percentage of CD8 TN and CD4 TCM cells and a decrease in the percentage of CD4 and CD8 TEM cells (Fig. 3A). The TE/TN and TEM/TCM ratios, both for CD4 (0.4 and 1.1, respectively) and for CD8 T cells (0.99 and 1.45, respectively), were significantly lower in patients than in controls (1.4 and 8.6 for CD4 and 2.4 and 6.8 for CD8, respectively). Patients with AD showed a significant increase in the percentage of regulatory B cells (CD19+ CD5+ FoxP3+ and CD19+ CD5+ IL10+) (Fig. 2A) and in all regulatory T cell phenotypes (Fig. 2B).
 and patients with Parkinson’s disease (B), compared to healthy controls (HC). * P-value between .01 and .05. ** P-value between .0001 and .01. *** P-value < .0001.")
 and patients with Parkinson’s disease (B), compared to healthy controls (HC). * P-value between .01 and .05. ** P-value between .0001 and .01. *** P-value < .0001.")
 and Treg (B) cells in patients with Alzheimer disease and patients with Parkinson’s disease, compared to healthy controls (HC). ** P-value between .0001 and .01. *** P-value < .0001.")
At the time of inclusion, patients with more severe clinical symptoms according to the Dementia Severity Rating Scale showed a significantly higher percentage of CD95+ CD4+ lymphocytes (R = 0.48; P = .03) and regulatory B cells expressing IL10 (CD19+ CD5+ FoxP3+ IL10+, R = 0.50; P = .02).
Differences in lymphocyte phenotypes between baseline and follow-upWe observed significant differences in the proportion of different phenotypes between the 2 time points (Figs. 4–6). Specifically, the percentage of CD8 cells increased (P = .03), whereas the percentage of CD4 and CD8 cells expressing the late activation marker CD38 decreased (P = .001 and P = .01, respectively), as did those expressing the CD95 marker (P = .01 and P = .04, respectively) (Fig. 4). We also observed an increase in CD4 and CD8 TEM cells (P = .03 and P = .01, respectively), together with a decrease in CD4 TCM cells (Fig. 5A) and an increase in the TE/TN and TEM/TCM ratios, both in CD4 T cells (1.1 vs 0.4, and 7.1 vs 1.1, respectively) and CD8 T cells (2.2 vs 0.9, and 5.0 vs 1.5, respectively). We identified an increase in B cells (P = .05) and a decrease in B cells expressing IL10 (P = .005) (Fig. 6A) and CD4 FoxP3 T cells (Fig. 6B).
 and patients with Parkinson’s disease (B) between baseline and follow-up. * P-value between .01 and .05. ** P-value between .0001 and .01. *** P-value < .0001.")
 and patients with Parkinson’s disease (B) between baseline and follow-up. * P-value between .01 and .05. ** P-value between .0001 and .01.")
 and Treg (B) cells in patients with Alzheimer disease and patients with Parkinson’s disease between baseline and follow-up. * P-value between .01 and .05. ** P-value between .0001 and .01.")
At the time of inclusion, patients with a lower percentage of CD38+ CD4+ lymphocytes showed higher disease progression rates (R = –0.62; P = .01); patients with a lower percentage of CD38+ CD8+ lymphocytes showed a similar trend, although this association was on the verge of significance (R = –0.61; P = .059). Furthermore, we found a positive correlation between the percentage of CD4 TE cells and disease progression rate (R = 0.93; P < .001).
Parkinson’s diseaseDifferences in lymphocyte phenotypes between patients with PD and controlsWe observed clear differences between patients with PD and healthy controls. We identified a significant decrease in the percentage of T and B cells (27.9 ± 2.2 vs 39.6 ± 3.6, P = .008) and a significant increase in the percentage of CD8+ T cells in patients with PD with regard to healthy controls (Fig. 1B). The percentage of early- and late-activation T cell markers and apoptotic lymphocytes was significantly higher in patients than in controls, for both CD4 and CD8 cells (Fig. 1B). Significantly higher proportions of regulatory TN (CD4 and CD8), TCM (CD4), T (CD4+ FoxP3+), B (CD19+ CD5+ IL10+ and CD19+ CD5+ FoxP3+), and T (CD4+ FoxP3+ CD45RO+) cells were detected in patients with PD than in controls (Fig. 2A and B, Fig. 3). In healthy controls, we also observed a significant decrease in the proportion of TEM cells (CD4 and CD8) (Fig. 3A), as well as a decrease in the TE/TN and TEM/TCM ratios in CD4 (0.32 vs 1.3 and 1.4 vs 8.1, respectively) and CD8 lymphocytes (1.0 vs 2.5, and 1.6 vs 7.1, respectively).
Lymphocyte phenotypes associated with baseline severityAt the time of inclusion, patients with more severe clinical signs according to the Hoehn and Yahr scale showed a significantly lower proportion of regulatory B cells expressing IL10 (R = –0.47; P = .05).
Differences in lymphocyte phenotypes between baseline and follow-upWe observed significant differences in the proportions of the different phenotypes between the 2 time points analysed. Specifically, the percentage of total lymphocytes increased (P = .02), whereas the levels of early- and late-activated CD4 and CD8 lymphocytes decreased, as did the population of apoptotic CD4 and CD8 lymphocytes (Fig. 4B). Although we did not observe significant changes in the frequencies of TN, TCM, TEM, or TE cells (Fig. 5B), a slight increase in the TE/TN and TEM/TCM ratios, both in CD4 (0.47 vs 0.38, and 2.7 vs 1.8, respectively) and CD8 T cells (1.7 vs 1.0, and 2.5 vs 1.9, respectively) was observed in the second time point assessed. We also observed a decrease in the percentage of regulatory B cells (CD19+ CD5+ IL10+) (Fig. 6A) and T cells (CD4+ FoxP3+) (Fig. 6B), whereas the proportion of B cells (CD19+) and regulatory T cells (CD4+ FoxP3+ CD25+ and CD4+ FoxP3+ CD25+ CD45RO+) increased (Fig. 6A and B).
Lymphocyte phenotypes associated with higher rates of disease progressionWe detected no significant association between disease progression rates and the proportions of different lymphocyte populations at the initial assessment. However, we observed 2 trends: higher rates of progression were associated with decreases in the percentages of CD4+ CD38+ cells (R = –0.55; P = .06) and CD8+ CD95+ (R = –0.63; P = .07) at the initial assessment.
Differences between patients with Alzheimer disease and Parkinson’s diseaseWe observed significant differences between patients with AD and those with PD for some phenotypes. Specifically, the percentage of lymphocytes was higher in patients with AD than in those with PD (45.2 [18.9] vs 27.9 [9.7]; P = .0001, whereas the proportion of CD8 cells was higher in patients with PD than in patients with AD (24.7 [7.5] vs 12.5 [7.8]; P < .0001). Furthermore, the percentage of CD4/CD8 TE and TN cells was significantly higher in patients with PD than in those with AD (P = .01 for both TE populations; P = .005 and P = 0009, respectively, for TN populations) (Fig. 3 A and B). In addition, the proportion of CD8 TEM cells was higher in patients with AD than in patients with PD (P = .007).
DiscussionIt is now evident that the brain’s “immunological advantage” with regard to systemic events is not absolute.31,32 In particular, peripheral inflammatory processes have been shown to play a significant role in the development of neurodegenerative diseases.33 Furthermore, brain antigens can cross the blood-brain barrier and reach the peripheral nervous system, which may trigger adaptive immunity against central antigens participating in the progression of several neurological diseases.34 Peripheral cells, mainly lymphocytes, have been found in the brain tissue of patients with AD and PD.14,35,36 These cells participate in the neurodegenerative process, and knowing their phenotypes in peripheral blood may enable us to better understand the associated degenerative changes.
In this study, we found an increase in the proportion of activated CD4+/CD8+ lymphocytes and apoptotic lymphocytes, an increase in the percentage of CD4 TCM cells, a decrease in the percentage of TEM lymphocytes, and an increase in regulatory B and T cells in patients with both neurodegenerative diseases. These findings are consistent with some previous reports,22,23,37 although they contradict others, particularly with regard to the TN/TEM/TCM populations.18,24 The high levels of activated and apoptotic T cells in both disorders suggest that an adaptive immunity component may be involved in the pathophysiology of these conditions. Although the we do not know the nature of the antigen triggering these responses (PAMPs or DAMPs), these observations suggest that patients are more prone to react to exogenous antigens (for example, infections) or even to their own proteins, linking these diseases to autoimmune disorders, as has previously been reported.38 The changes in peripheral memory T cell subpopulations are interesting: in both conditions, we observe a considerable decrease in the percentage of TEM cells, with a concomitant expansion of CD4/CD8 TN and CD4 TCM cells. Considering that once naïve T cells make contact with the antigen they are activated and acquire effector functions, creating memory populations (TEM and TCM), and the increase observed in activated and CD95 + T cells in both AD and PD, these changes are likely to reflect an active dynamic flow: TN → TACT → TE → (TEM and TCM) → TE → (apoptosis or memory); this could be modulated in each condition by new antigenic challenges or by the response to a memory antigen.
Increased percentages of most of the T and B cell phenotypes with possible regulatory functions were observed in patients with both conditions with regard to controls; the purpose of this change is probably to counteract the resulting inflammation. It is therefore important to underscore that although we observed an increase in the CD4+ FoxP3+ T cells in both conditions, expression of the CD4+ FoxP3+ CD25+ subpopulation was high in patients with AD and low in patients with PD. This noteworthy difference may imply the existence of different regulatory mechanisms in both disorders; particularly, consumption of IL2 may be more relevant for the regulatory functions of these cells in AD than in PD.39 Further studies are needed to confirm the functionality of these Treg subpopulations. Some observations suggest a dichotomous role of Treg cells, which may be beneficial or harmful in different neurological diseases, depending on the context of the disease.40 On the one hand, some studies have found that their action in these conditions is positive for the patient. For example, in a murine model of AD, expansion of Treg cells was associated with an increase in the number of microglia associated with amyloid plaques and with improvement of cognitive functions, whereas depletion of Treg cells accelerated the development of cognitive deficits.41 Furthermore, in the MPTP murine model of PD, Treg cells may attenuate microgliosis and protect against dopaminergic neuronal death in the substantia nigra and striatum.42,43 Treg cells may interact with other immune cells, including microglial cells, favouring the change from the neurotoxic M1 phenotype to the neurotrophic M2 phenotype.42,44,45 On the other hand, a transient reduction in peripheral levels of Treg cells or their activity has been shown to affect the choroid plexus, promoting the recruitment of immunoregulatory cells to the central nervous system; this enables clearance of β-amyloid plaques, which reduces neuroinflammation and reverts cognitive impairment.46 Likewise, we observed a significant increase in regulatory B cell subpopulations (CD19+ CD5+ FoxP3+ and CD19+ CD5+ IL10+) in patients with both conditions (Fig. 3A). These Breg cell phenotypes have been described as critical in maintaining immune homeostasis,47 and may suppress the local immune response.
Regarding the changes between the 2 time points assessed, we observed decreases in the percentages of activated CD4 and CD8 cells, apoptotic T cells, and some regulatory populations in both conditions. In patients with AD, we also observed a decrease in CD4 central memory cells and an increase in the effector memory lymphocytes associated with disease progression. It is currently difficult to propose a clear explanation for the changes observed in the context of these neurodegenerative diseases. It has been postulated that after transitioning out of the memory state, TEM and TCM cells are prone to produce Th1 and Th2 cytokines; however, TCM cells show better proliferative responses, which explains their greater persistence in vivo.48 This finding, together with the fact that TEM cells are converted into TCM cells after elimination of the antigen,48 suggests that disease progression is associated with persistence of the antigens that triggered the adaptive immunity. The positive correlation observed between CD4 TE cells and disease progression rates in patients with AD may be associated with this observation.
Despite the clear similarities between both diseases, some differences were evident. In particular, the percentage of CD4/CD8 TN and TE lymphocytes was higher in patients with PD, whereas the proportion of CD8 TEM cells was higher in patients with AD. These findings may reflect a more specific relationship between chronic immunological stimulation and disease in AD than in PD.
Our study presents some limitations: firstly, we did not assess the Th1/Th2 response associated with the lymphocyte populations studied. It is known that cytokines regulate T cell differentiation and that different lymphocyte populations can produce either pro-inflammatory or anti-inflammatory cytokines, depending on several factors. Secondly, we did not assess plasma levels of amyloid peptides. Several studies have shown that patients with AD present higher levels of these proteins than controls.49 Furthermore, stimulation of peripheral blood mononuclear cells with these peptides generates more proinflammatory cytokines in patients with AD than in healthy controls.49 Further research into these markers (cytokines, amyloid peptides) and their relationship with lymphocyte populations would give a better overall understanding of the inflammatory phenomenon.
ConclusionThis study presents clear differences in the lymphocytic profile between patients with AD/PD and controls. In particular, we clearly demonstrate the peripheral activation of the immune response in affected patients, as well as the presence of a regulatory response. These findings, whose mechanisms must be clearly established, may favour the use of immunomodulatory agents as a therapeutic strategy to modify progression of these diseases.
FundingThis study was partially funded by the Support Programme for Research and Technological Innovation (PAPIIT, DGAPA, UNAM; project number: IB201812) and by the Clinical Pfizer Research Fund Award 2012, granted by Pfizer Scientific Institute.
Conflicts of interestThe authors have no conflicts of interest to declare.
We would like to thank Juan Francisco Rodríguez for his help with the English-language version of the abstract.
Please cite this article as: Garfias S, Tamaya Domínguez B, Toledo Rojas A, Arroyo M, Rodríguez U, Boll C, et al. Fenotipos de linfocitos periféricos en las enfermedades de Alzheimer y Parkinson. Neurología. 2022;37:110–121.
