


This study aims to evaluate the prognostic value of emergency blood test results in patients with acute ischaemic stroke.
MethodsWe evaluated 592 prospectively patients with neuroimaging-confirmed ischaemic stroke admitted to our stroke unit between 2015 and 2018. We gathered emergency blood test results and calculated the neutrophil-to-lymphocyte ratio and the neutrophil-to-platelet ratio (neutrophils × 1.000/platelets). The association between blood test results and functional prognosis (as measured with the modified Rankin Scale) and such complications as haemorrhagic transformation was evaluated by logistic regression analysis. The additional predictive value of blood test parameters was assessed with receiver operating characteristic curves and the net reclassification index.
ResultsAn neutrophil-to-lymphocyte ratio ≥ 3 at admission was associated with a two-fold increase in the risk of functional dependence at 3 months (OR: 2.24; 95% CI: 1.35-3.71) and haemorrhagic transformation (OR: 2.11; 95% CI: 1.09-4.05), while an neutrophil-to-lymphocyte ratio ≥ 3.86 resulted in an increase of 2.4 times in the risk of mortality at 3 months (OR: 2.41; 95% CI: 1.37-4.26) after adjusting for the traditional predictors of poor outcomes. Patients with neutrophil-to-platelet ratio ≥ 32 presented 3 times more risk of haemorrhagic transformation (OR: 3.17; 95% CI: 1.70-5.92) and mortality at 3 months (OR: 3.07; 95% CI: 1.69-5.57). Adding these laboratory parameters to standard clinical-radiological models significantly improved discrimination and prognostic accuracy.
ConclusionsBasic blood test parameters provide important prognostic information for stroke patients and should therefore be analysed in combination with standard clinical and radiological parameters to optimise ischaemic stroke management.
Este estudio busca identificar el potencial pronóstico de los parámetros de la analítica urgente en pacientes con ictus isquémico.
MétodoSe recogió prospectivamente a 592 pacientes con evento isquémico cerebral confirmado por neuroimagen, atendidos en una unidad de ictus entre 2015 y 2018. Se registraron los parámetros extraídos de la analítica urgente y se calculó la ratio neutrófilos/linfocitos y la ratio neutrófilos/plaquetas (neutrófilos × 1.000/plaquetas). Se evaluó mediante modelos de regresión logística su asociación con el pronóstico funcional, evaluado mediante la escala Rankin modificada, y con el desarrollo de complicaciones como transformación hemorrágica. El valor predictivo adicional de estas variables respecto a los modelos habituales se evaluó mediante comparación de curvas ROC e índices de reclasificación.
ResultadosLos niveles de ratio neutrófilos/linfocitos ≥ 3 al ingreso asociaron 2 veces más riesgo de dependencia funcional a los 3 meses (OR: 2,24; IC 95%: 1,35−3,71) y transformación hemorrágica (OR: 2,11; IC 95%: 1,09−4,05); mientras que cifras ≥3,86 conllevaron 2,4 veces más frecuencia de mortalidad a los 3 meses (OR: 2,41; IC %: 1,37−4,26), tras ajuste por los factores tradicionales de mal pronóstico. Aquellos pacientes con ratio neutrófilos/plaquetas ≥32 presentaban hasta 3 veces más riesgo de desarrollar transformación hemorrágica (OR: 3,17; IC 95%: 1,70−5,92) y de haber fallecido a los 3 meses (OR: 3,07; IC 95%: 1,69−5,57). La adición de estos parámetros analíticos supuso una mejora significativa de la capacidad de discriminación y precisión en la predicción pronóstica sobre los modelos clínico-radiológicos habituales.
ConclusionesAlgunos parámetros básicos de la analítica urgente, muchas veces olvidados, proporcionan información pronóstica importante y podrían considerarse junto con parámetros clínicos y radiológicos para optimizar el manejo del ictus isquémico.
At most centres, any patient with suspected ischaemic stroke undergoes an emergency blood test upon admission. However, little attention is paid to the parameters measured in these tests once we rule out contraindications for revascularisation therapy1 or findings suggestive of other diseases that present with stroke-like symptoms.2
Some laboratory parameters commonly determined in emergency blood tests have been identified as predictors of complications of ischaemic stroke3,4 or its treatment,5,6 as well as stroke prognosis in the medium and long term.7 The first trials of fibrinolytic therapy found an association between glucose level at admission and prognosis of ischaemic stroke.8 Subsequent studies have reported an association between neutrophil count and stroke prognosis9,10 and between lymphocytopaenia and such complications as haemorrhagic transformation (HT) at the site of infarct.11 C-reactive protein (CRP) has been shown to be a good predictor of infection within 24-48 hours of stroke12; in a recent meta-analysis, this laboratory parameter also showed an association with all-cause mortality at 3 months after ischaemic stroke.13 Furthermore, high fibrinogen levels at admission have been associated with increased in-hospital mortality rates in patients with ischaemic stroke.14
Prognostic stratification in ischaemic stroke enables the adaptation of diagnostic and treatment efforts to each individual case and ensures rational use of the available resources. Identifying patients likely to present longer rehabilitation times or at greater risk of functional dependence after stroke enables optimal resource allocation for home care services and medium- to long-stay centres. Such factors as stroke severity, patient age, and stroke complications (eg, infections, HT, deep vein thrombosis) are considered in the acute phase to predict functional prognosis. However, predictive models including emergency blood test parameters are still underused.
In this study, we evaluated the parameters most commonly included in emergency blood tests and their association with ischaemic stroke prognosis and complications, with a view to highlighting the usefulness of this undervalued resource.
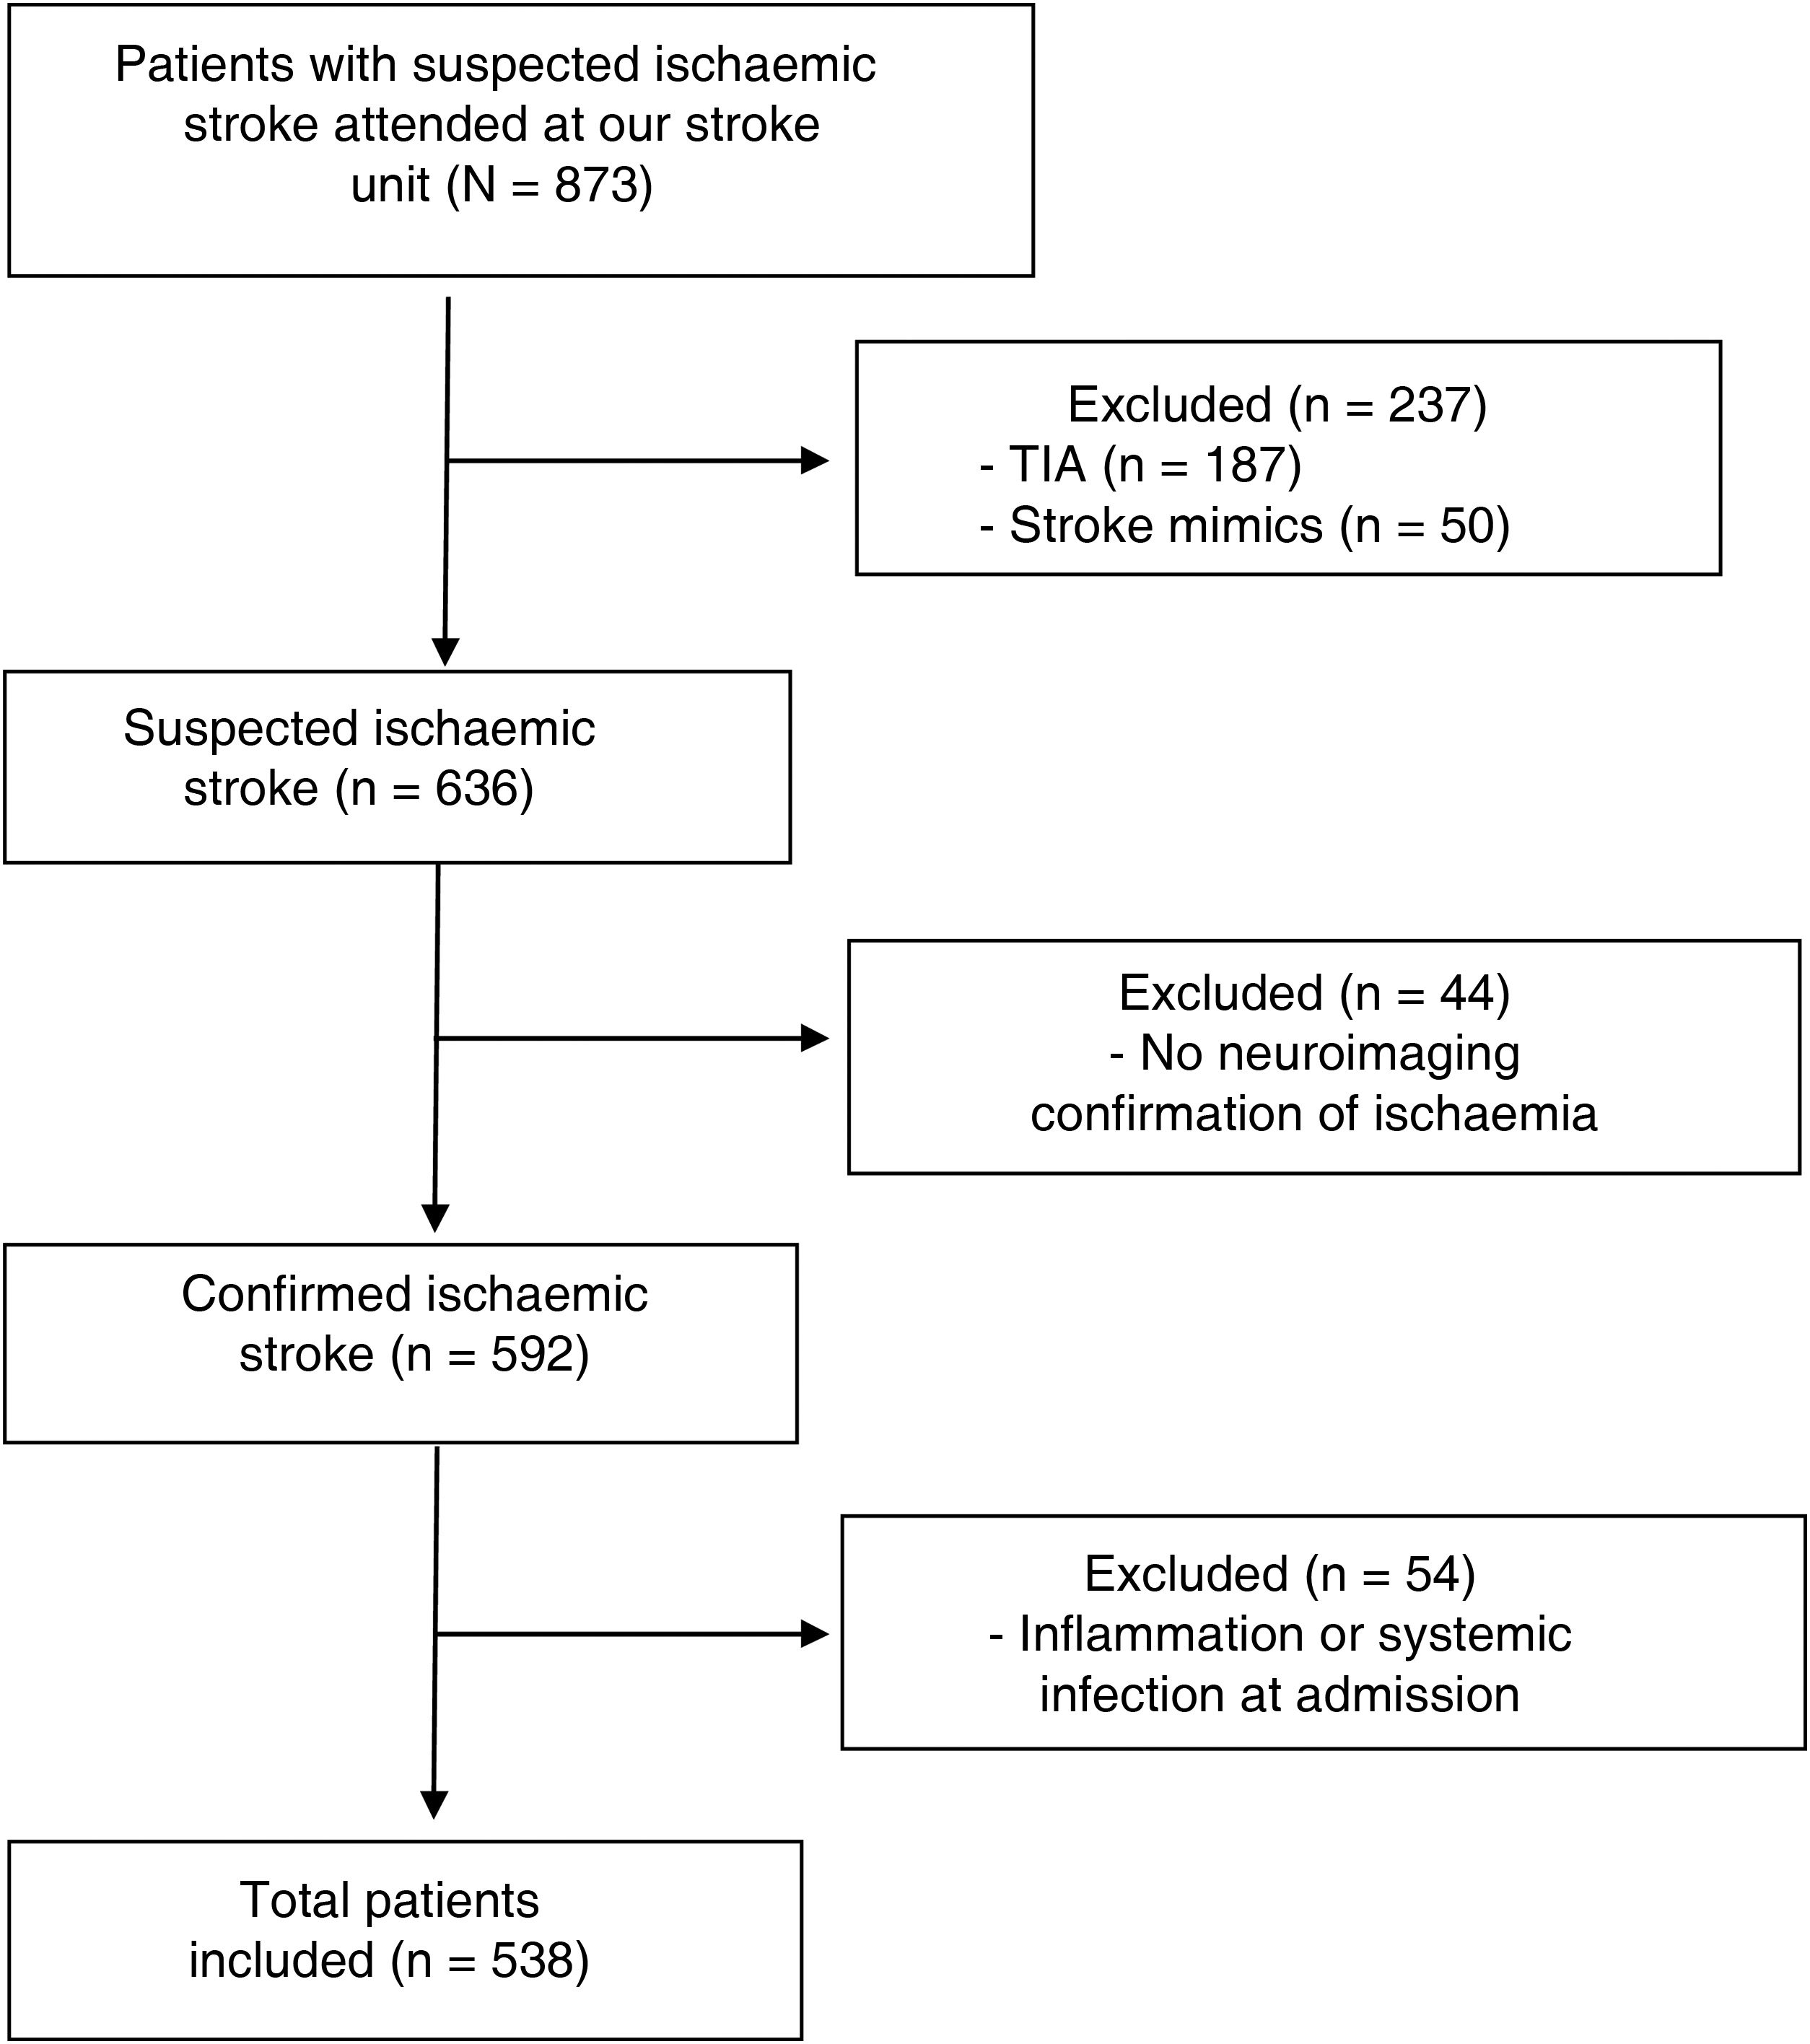
Material and methodsWe conducted a prospective study of patients with neuroimaging-confirmed ischaemic stroke attended at the stroke unit of Complejo Hospitalario de Navarra, in Spain, between November 2015 and June 2018 (Fig. 1). This study was approved by our centre’s Clinical Research Ethics Committee (project code 84/2018). All participants or their legal representatives signed informed consent forms.

We excluded 54 patients presenting infection or systemic inflammation (systemic inflammatory diseases, active cancer, etc) at admission, as these factors may interfere with the parameters under study. Patients excluded due to infection at admission presented either positive microbiological culture results or strong suspicion of a condition requiring antibiotic therapy.
Clinical, demographic, and laboratory variablesAll patients underwent an emergency blood test upon arrival at the hospital, before revascularisation therapy was indicated; testing determined the total number of leukocytes, neutrophils, lymphocytes, and levels of platelets, and fibrinogen, CRP, and glucose. We calculated the neutrophil-to-lymphocyte ratio (NLR) and the neutrophil-to-platelet ratio (NPR; neutrophils × 1000/platelets), and gathered data on demographic variables, vascular risk factors, history of cardiovascular disease, and clinical variables, including stroke severity as measured with the National Institutes of Health Stroke Scale (NIHSS) and treatment (fibrinolytic therapy with recombinant tissue plasminogen activator or endovascular treatment with mechanical thrombectomy). In accordance with the TOAST criteria,15 ischaemic stroke was classified into the following aetiological subtypes: cardioembolism, atherosclerosis, small-vessel occlusion, stroke of other determined aetiology, and stroke of undetermined aetiology.
Two independent radiologists quantified early ischaemic changes in emergency head CT images using the Alberta Stroke Program Early CT Score (ASPECTS). In all cases, a 1.5 T brain MRI scan (or delayed head CT when MRI was contraindicated) was performed within one week of the event to confirm ischaemic stroke and to assess the likelihood of HT.
Prognostic variablesWe evaluated patients’ functional status at 90 days with the modified Rankin Scale (mRS) at an in-person interview.16 The main variables analysed were mortality and functional dependence at 3 months (defined as an mRS score > 2 at 90 days). Other outcome measures were: 1) respiratory infection at 3 days of the event (positive microbiological study results or strong clinical suspicion of infection leading to antibiotic therapy) and 2) HT according to the ECASS III classification.17
Statistical analysisThe Shapiro-Wilk test was used to check all variables for normal distribution. Non–normally distributed continuous quantitative data were analysed with log transformation. Continuous variables were compared with the t test or the Mann-Whitney U test, depending on whether data were normally distributed. Categorical variables were analysed with the chi-square test.
Stroke aetiology was determined with the TOAST classification. Three levels of stroke severity were established according to NIHSS score (0-7, 8-14, and > 14); ANOVA was used for trend analysis.
When evaluating the association between different parameters and functional dependence at 3 months, we excluded 57 patients whose mRS scores at admission indicated functional dependence (mRS > 2).
Multivariate logistic regression models were created to evaluate the associations between laboratory parameters and outcome variables. The variables included in multivariate models were those considered traditional factors of poor prognosis in previous studies1,17: stroke severity as measured with the NIHSS, age, glucose level, history of arterial hypertension, and baseline mRS score. Results are expressed as odds ratios (OR) with 95% confidence intervals (95% CI).
ROC curve analysis was performed to evaluate each parameter, creating dichotomous variables with cut-off points for use in predictive models. We performed an analysis of classification capacity to select the smallest possible number of cut-off points for each laboratory parameter, with a view to optimising their use for predicting outcome variables. The added value of laboratory variables for each outcome variable was evaluated by comparing ROC curves and calculating the integrated discrimination improvement (IDI).
Statistical significance was set at P < .05. Analyses were conducted with STATA, version 16 (StataCorp LLC; Texas, USA).
ResultsWe finally included 592 patients with ischaemic stroke. Median age (Q1-Q3) in our sample was 76 years (67.4-83.5); 43% of patients were women. We observed a mortality rate of 22%; 46% of survivors presented functional dependence at 3 months. After adjusting for traditional factors of poor prognosis, infection and systemic inflammation at admission (n = 54) were found to be associated with higher rates of mortality (OR: 4.07; 95% CI, 1.69-9.78; P = .002) and functional dependence at 3 months (OR: 3.27; 95% CI, 1.46-7.34; P = .004). Given the potential for infection and systemic inflammation to interfere with laboratory analysis results, these patients were excluded from the analysis at this point (Fig. 1).
Table 1 presents the demographic and clinical characteristics of the remaining patients, broken down by functional prognosis.
Demographic and clinical characteristics of the patients included in the study and logistic regression analysis results, by prognosis.
| Three-month functional dependence | Three-month mortality | |||||||
|---|---|---|---|---|---|---|---|---|
| Intergroup differences | Univariate logistic regression | Intergroup differences | Univariate logistic regression | |||||
| No (n = 266) | Yes (n = 171) | OR (95% CI) | P | No (n = 391) | Yes (n = 99) | OR (95% CI) | P | |
| Age (years) | 72.4 (63.4-80.3) | 78.7 (71.4-85.4) | 1.75 (1.41-2.18)a | < .001 | 74.9 (66.3-81.9) | 83.4 (74.6-89.0) | 1.69 (1.36-2.10)a | < .001 |
| Women, n (%) | 101 (38.0) | 78 (45.6) | 1.37 (0.93-2.02) | .113 | 159 (40.7) | 52 (52.5) | 1.61 (1.04-2.51) | .034 |
| Hypertension, n (%) | 174 (65.4) | 125 (73.1) | 1.44 (0.94-2.19) | .092 | 263 (67.3) | 84 (84.8) | 2.73 (1.51-4.91) | .001 |
| Type 2 diabetes, n (%) | 63 (23.7) | 46 (26.9) | 1.19 (0.76-1.84) | .448 | 105 (26.9) | 21 (21.2) | 0.73 (0.43-1.25) | .252 |
| Dyslipidaemia, n (%) | 134 (50.4) | 95 (55.6) | 1.23 (0.84-1.81) | .290 | 203 (51.9) | 44 (44.4) | 0.74 (0.48-1.15) | .185 |
| SBP at admission (mm Hg) | 153.0 (27.3) | 151.0 (23.3) | 1.00 (0.99-1.00) | .432 | 151.8 (26.7) | 155.3 (24.0) | 1.01 (0.99-1.01) | .237 |
| DBP at admission (mm Hg) | 82.4 (16.8) | 82.6 (16.3) | 1.00 (0.99-1.01) | .940 | 82.4 (16.5) | 86.2 (19.9) | 1.01 (0.99-1.03) | .054 |
| Glucose level at admission (mg/dL) | 109 (97-131) | 124 (104-153) | 3.82 (1.93-7.53)b | < .001 | 111 (98-138) | 132 (106-154) | 2.65 (1.32-5.33)b | .006 |
| Leukocyte count (×109/L) | 8.1 (6.7-9.5) | 8.7 (7.1-11.2) | 2.30 (1.16-4.56)b | .017 | 8.2 (6.8-9.8) | 9.3 (7.1-12.1) | 2.95 (1.31-6.64)b | .009 |
| Neutrophil count (×109/L) | 4.9 (3.9-6.4) | 6.2 (4.4-8.8) | 3.82 (2.27-6.41)b | < .001 | 5.1 (4.1-6.6) | 6.5 (4.5-9.5) | 4.92 (2.72-8.90)b | < .001 |
| Lymphocyte count (×109/L) | 1.9 (1.4-2.8) | 1.5 (1.1-2.1) | 0.33 (0.22-0.50)b | < .001 | 1.8 (1.4-2.6) | 1.5 (1.1-2.1) | 0.40 (0.26-0.63)b | < .001 |
| Neutrophil-to-lymphocyte ratio | 2.50 (1.57-3.62) | 4.17 (2.48-6.50) | 2.86 (2.09-3.92)b | < .001 | 2.63 (1.73-4.2) | 4.78 (2.71−-7.14) | 2.64 (1.90-3.67)b | < .001 |
| Platelet count (×109/L) | 192 (162-237) | 199 (164-237) | 1.02 (0.55-1.88)b | .957 | 195 (164-238) | 194 (152-237) | 0.71 (0.34-1.47)b | .356 |
| Neutrophil-to-platelet ratio | 25.8 (19.0-33.8) | 30.6 (22.7-44.7) | 2.80 (1.80-4.35)b | < .001 | 26.3 (19.5-34.6) | 35.8 (24.4−46.9) | 4.23 (2.44−7.32)b | < .001 |
| CRP (mg/L) | 2.9 (1.6-6.2) | 5.3 (2.0-11.3) | 1.41 (1.07-1.86)b | .016 | 2.9 (1.6-7.7) | 6.6 (2-12.2) | 1.42 (1.05-1.92)b | .022 |
| Fibrinogen (mg/dL) | 435.6 (104.6) | 439.0 (121.6) | 1.00 (0.99-1.00) | .822 | 432.0 (110.5) | 467.6 (99.5) | 1.00 (1.00-1.01) | .034 |
| NIHSS score, n (%) | ||||||||
| 0-7 | 180 (67.7) | 35 (20.5) | 1.00 (ref) | 221 (56.5) | 13 (13.1) | 1.00 (ref) | ||
| 8-14 | 31 (11.7) | 33 (19.3) | 5.47 (2.98-10.07) | < .001 | 61 (15.6) | 15 (15.2) | 4.18 (1.89-9.26) | < .001 |
| > 14 | 55 (20.7) | 99 (57.9) | 9.3 (5.67-15.11) | < .001 | 109 (27.9) | 65 (65.7) | 10.14 (5.36-19.19) | < .001 |
| ASPECTS | 9.67 (0.78) | 8.96 (1.50) | 0.57 (0.47-0.70) | < .001 | 9.53 (1.0) | 8.59 (1.9) | 0.63 (0.53-0.74) | < .001 |
| Baseline mRS score, n (%) | ||||||||
| 0 | 150 (56.4) | 58 (28.2) | 1.00 (ref) | 182 (46.5) | 26 (26.3) | 1.00 (ref) | ||
| 1 | 78 (29.3) | 64 (31.1) | 2.12 (1.36-3.32) | .001 | 121 (30.9) | 21 (21.2) | 1.21 (0.65-2.23) | .538 |
| 2 | 38 (14.3) | 49 (23.8) | 3.33 (1.98-5.61) | < .001 | 65 (16.6) | 22 (22.2) | 2.37 (1.26-4.47) | .008 |
| 3 | c | c | c | 13 (3.3) | 21 (21.2) | 11.31 (5.06-25.28) | < .001 | |
| 4 | c | c | c | 10 (2.6) | 8 (8.1) | 5.6 (2.03-15.47) | .001 | |
| Stroke subtype (TOAST), n (%) | ||||||||
| Atherothrombotic | 38 (14.3) | 23 (13.5) | 0.94 (0.54-1.64) | .824 | 51 (13.0) | 11 (11.1) | 0.84 (0.42-1.69)d | .629 |
| Cardioembolic | 102 (38.3) | 85 (49.7) | 1.61 (1.09-2.37) | .017 | 162 (41.4) | 54 (54.5) | 1.73 (1.11-2.71)d | .015 |
| Undetermined aetiology | 42 (15.8) | 10 (5.8) | 1.02 (0.67-1.56) | .917 | 56 (14.3) | 2 (2.0) | 1.07 (0.66-1.74)d | .777 |
| Lacunar | 77 (28.9) | 50 (29.2) | 0.33 (0.16-0.68) | .003 | 114 (29.2) | 30 (30.3) | 0.12 (0.03-0.52)d | .004 |
| Other determined aetiology | 7 (2.6) | 2 (1.2) | 0.44 (0.09-2.15) | .310 | 8 (2.0) | 1 (1.0) | 0.49 (0.06-3.99)d | .508 |
| Intravenous thrombolysis, n (%) | 98 (36.8) | 88 (51.5) | 1.82 (1.23-2.68) | .003 | 152 (38.9) | 54 (54.5) | 1.89 (1.21-2.94) | .005 |
| Endovascular treatment, n (%) | 72 (27.1) | 84 (49.1) | 2.60 (1.74-3.90) | < .001 | 115 (29.4) | 46 (46.5) | 2.08 (1.33-3.27) | .001 |
| Haemorrhagic transformation, n (%) | 17 (6.4) | 53 (31.0) | 6.69 (3.71-12.06) | < .001 | 49 (12.5) | 29 (29.3) | 2.98 (1.76-5.05) | < .001 |
| Respiratory infection at 3 days, n (%) | 10 (3.8) | 54 (31.6) | 12.21 (6.0-24.86) | < .001 | 30 (7.7) | 47 (47.5) | 10.75 (6.24-18.53) | < .001 |
Continuous variables are expressed as mean (standard deviation); those presenting an asymmetrical distribution are expressed as median (Q1-Q3).
ASPECTS: Alberta Stroke Program Early CT Score; CI: confidence interval; CRP: C-reactive protein; DBP: diastolic blood pressure; mRS: modified Rankin Scale; NIHSS: National Institutes of Health Stroke Scale; OR: odds ratio; Q1-Q3: quartiles 1 and 3; SBP: systolic blood pressure; TOAST: Trial of ORG 10172 in Acute Stroke Treatment classification.
We evaluated the association between inflammatory markers and prognosis of ischaemic stroke. Total leukocyte count was higher in patients with poorer clinical progression (Table 1). Counts above 9.3 × 10⁹ leukocytes/L at admission were associated with a twofold increase in the risk of functional dependence and 2.5 times greater risk of mortality at 3 months (Table 2).
Multivariate logistic regression analysis of 3-month functional dependence, mortality, and haemorrhagic transformation for the laboratory parameters analysed in our study.
| Three-month functional dependencea | Three-month mortalitya | Haemorrhagic transformationb | |||||||
|---|---|---|---|---|---|---|---|---|---|
| Variable | Cut-off point | OR (95% CI) | P | Cut-off point | OR (95% CI) | P | Cut-off point | OR (95% CI) | P |
| Leukocyte count (×109/L) | ≥ 9.3 | 2.00 (1.15-3.48) | .014 | ≥ 9.3 | 2.47 (1.37-4.45) | .003 | ≥ 9.3 | 1.90 (0.98-3.72) | .059 |
| Neutrophil count (×109/L) | ≥ 6.2 | 2.72 (1.60-4.62) | < .001 | ≥ 6.2 | 2.27 (1.27-4.04) | .005 | ≥ 6.2 | 1.36 (0.71-2.58) | .351 |
| Lymphocyte count (×109/L) | ≤ 1.7 | 1.83 (1.09-3.05) | .021 | ≤ 1.7 | 1.61 (0.90-2.88) | .107 | ≤ 1.7 | 1.51 (0.80-2.83) | .203 |
| NLR | ≥ 3 | 2.24 (1.35-3.71) | .002 | ≥ 3.86 | 2.41 (1.37-4.26) | .002 | ≥ 3 | 2.11 (1.09-4.05) | .026 |
| CRP (mg/L) | ≥ 3.4 | 1.69 (0.76-3.76) | .197 | ≥ 5.4 | 2.70 (1.33-5.52) | .006 | ≥ 3.4 | 2.90 (0.90-9.37) | .075 |
| Glucose level (mg/dL) | ≥ 120 | 4.27 (2.50-7.29) | < .001 | ≥ 120 | 3.07 (1.73-5.44) | < .001 | ≥ 120 | 2.39 (1.24-4.64) | .010 |
| Platelet count (×109/L) | ≤ 194 | 0.64 (0.38-1.06) | .085 | ≤ 194 | 0.85 (0.48-1.51) | .580 | ≤ 173 | 2.17 (1.18-4.01) | .013 |
| NPR | ≥ 32 | 1.38 (0.82-2.30) | .225 | ≥ 32 | 3.07 (1.69-5.57) | < .001 | ≥ 32 | 3.17 (1.70-5.92) | <.001 |
| Fibrinogen (mg/dL) | ≥ 452 | 0.80 (0.39-1.61) | .524 | ≥ 452 | 1.53 (0.73-3.18) | .260 | ≥ 504 | 1.81 (0.72-4.55) | .210 |
CI: confidence interval; CRP: C-reactive protein; mRS: modified Rankin Scale; NIHSS: National Institutes of Health Stroke Scale; NLR: neutrophil-to-lymphocyte ratio; NPR: neutrophil-to-platelet ratio; OR: odds ratio.
Neutrophil count (× 109/L) at admission (n = 527) increased in line with stroke severity (ANOVA; P < .01) and presented a positive correlation with glucose levels (Pearson coefficient = 0.18; P < .001). Furthermore, patients who had died or presented functional dependence at 3 months showed higher neutrophil counts (Table 1). Neutrophil count acted as an independent predictor of 3-month mortality and functional dependence. Thus, patients with counts ≥ 6.2 × 10⁹ neutrophils/L at admission (upper limit of normal at our laboratory: 7 × 10⁹ neutrophils/L) presented 3 times the risk of being functionally dependent after stroke and twice the risk of death, after adjusting for traditional factors of poor prognosis.
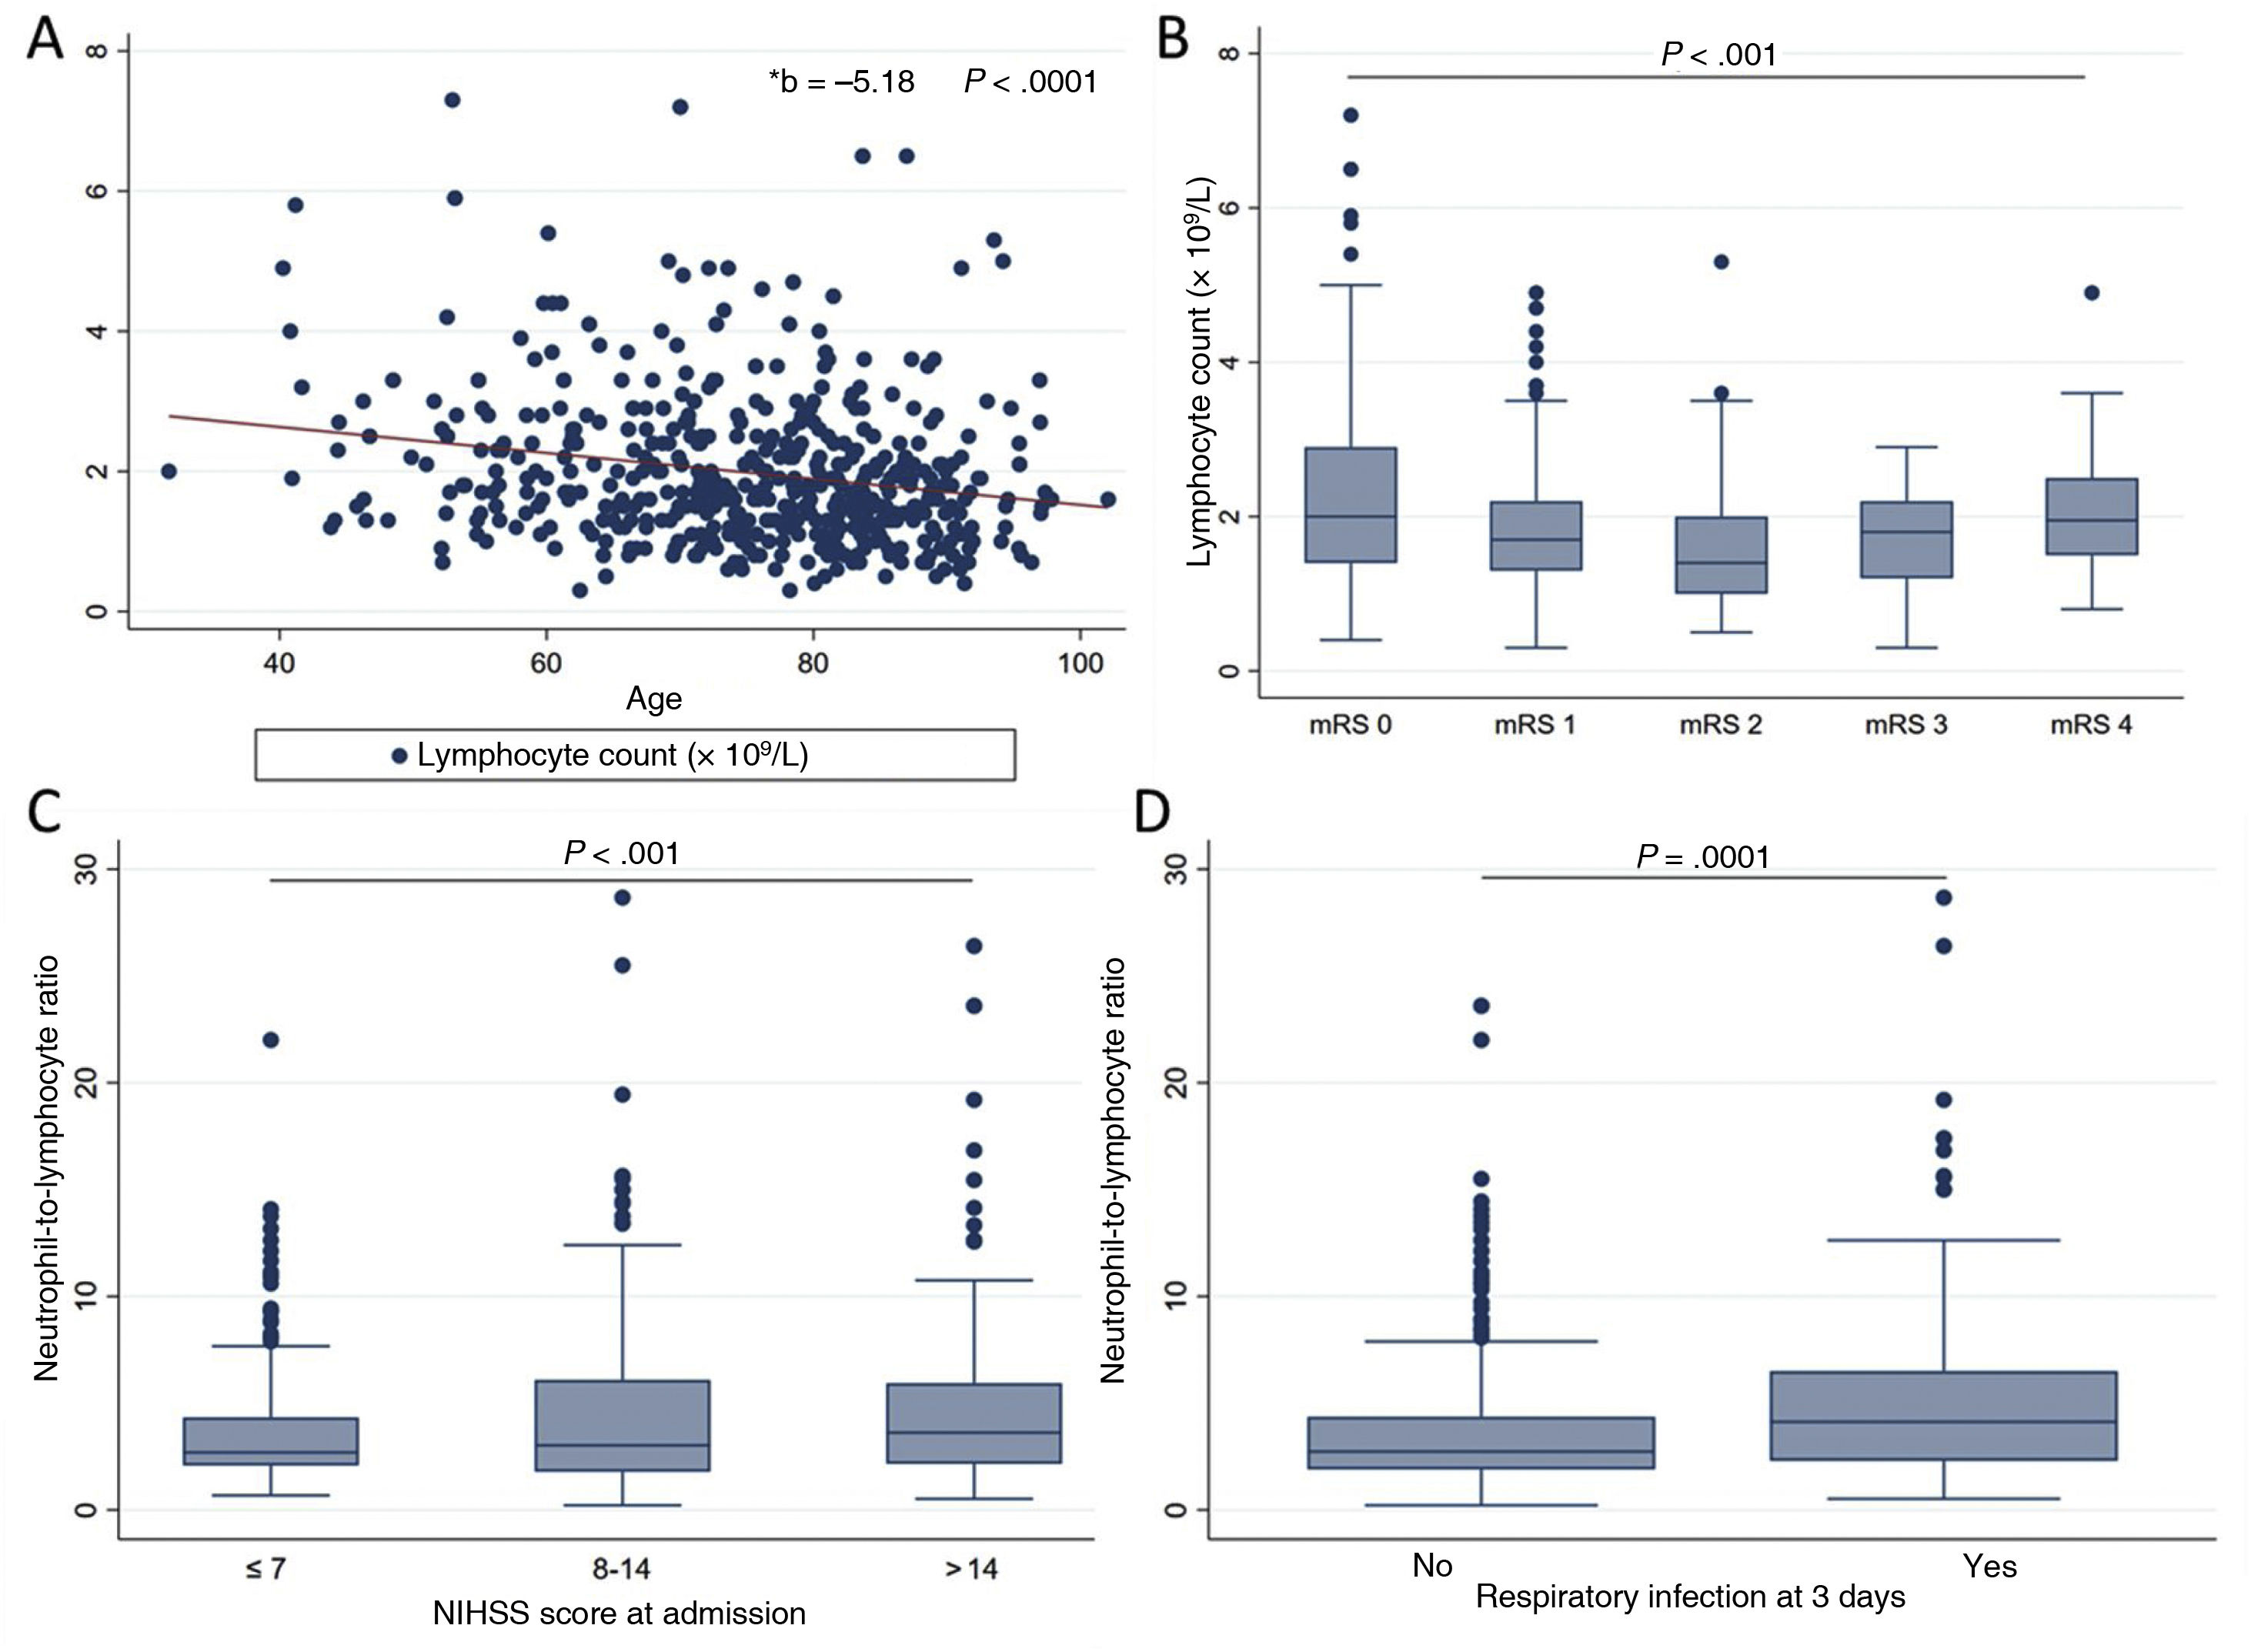
Lymphocyte count (n = 524) decreased with age (r = –0.21; P < .001), even after adjusting for stroke severity in the linear regression model (B = –5.18; 95% CI, –7.22 to –3.13; P < .01). Lower lymphocyte counts were observed in patients with moderate dependence, with counts increasing in patients with severe dependence (mRS of 4) (Fig. 2A and B). After adjusting for traditional factors of poor prognosis, patients with counts below 1.7 × 10⁹ lymphocytes/L presented twice the risk of functional dependence at 3 months (Table 2).
 Negative linear association between lymphocyte count and age (linear regression). B) Quadratic relationship between lymphocyte count and previous functional status as measured with the mRS (ANOVA with trend analysis). C) Positive linear association between neutrophil-to-lymphocyte ratio and stroke severity as measured with the NIHSS (ANOVA). D) Differences in the neutrophil-to-lymphocyte ratio between patients with and without respiratory infection at 3 days after stroke (Wilcoxon test). mRS: modified Rankin Scale; NIHSS: National Institutes of Health Stroke Scale.")
Associations between lymphocyte count and neutrophil-to-lymphocyte ratio at admission and several clinical and demographic parameters. A) Negative linear association between lymphocyte count and age (linear regression). B) Quadratic relationship between lymphocyte count and previous functional status as measured with the mRS (ANOVA with trend analysis). C) Positive linear association between neutrophil-to-lymphocyte ratio and stroke severity as measured with the NIHSS (ANOVA). D) Differences in the neutrophil-to-lymphocyte ratio between patients with and without respiratory infection at 3 days after stroke (Wilcoxon test).
mRS: modified Rankin Scale; NIHSS: National Institutes of Health Stroke Scale.
Lymphocytopaenia at admission was associated with greater risk of respiratory infection at 3 days (t test assuming equal variances; P < .001), with respiratory infection acting as an independent predictor of 3-month mortality and functional dependence (OR: 4.22; 95% CI, 1.81-9.83; P = .001; and OR: 6.32; 95% CI, 3.11-12.85; P = .001, respectively), after adjusting for traditional factors of poor prognosis.
The NLR, which reflects the relationship between these parameters, has been proposed as a marker of imbalance in the immune response to acute ischaemia. In our patients, the NLR increases in parallel with stroke severity (r = 0.14; P < .01) and acts as a predictor of respiratory infection within 3 days of stroke (OR: 1.62; 95% CI, 1.11-2.35; P = .012), after adjusting for traditional factors of poor prognosis (Fig. 2C and D).
An NLR > 3 at admission was found to be associated with a twofold increase in the risk of functional dependence at 3 months and HT, whereas NRL > 3.86 was associated with 2.4 times greater mortality risk at 3 months, after adjusting for traditional factors of poor prognosis (Table 2).
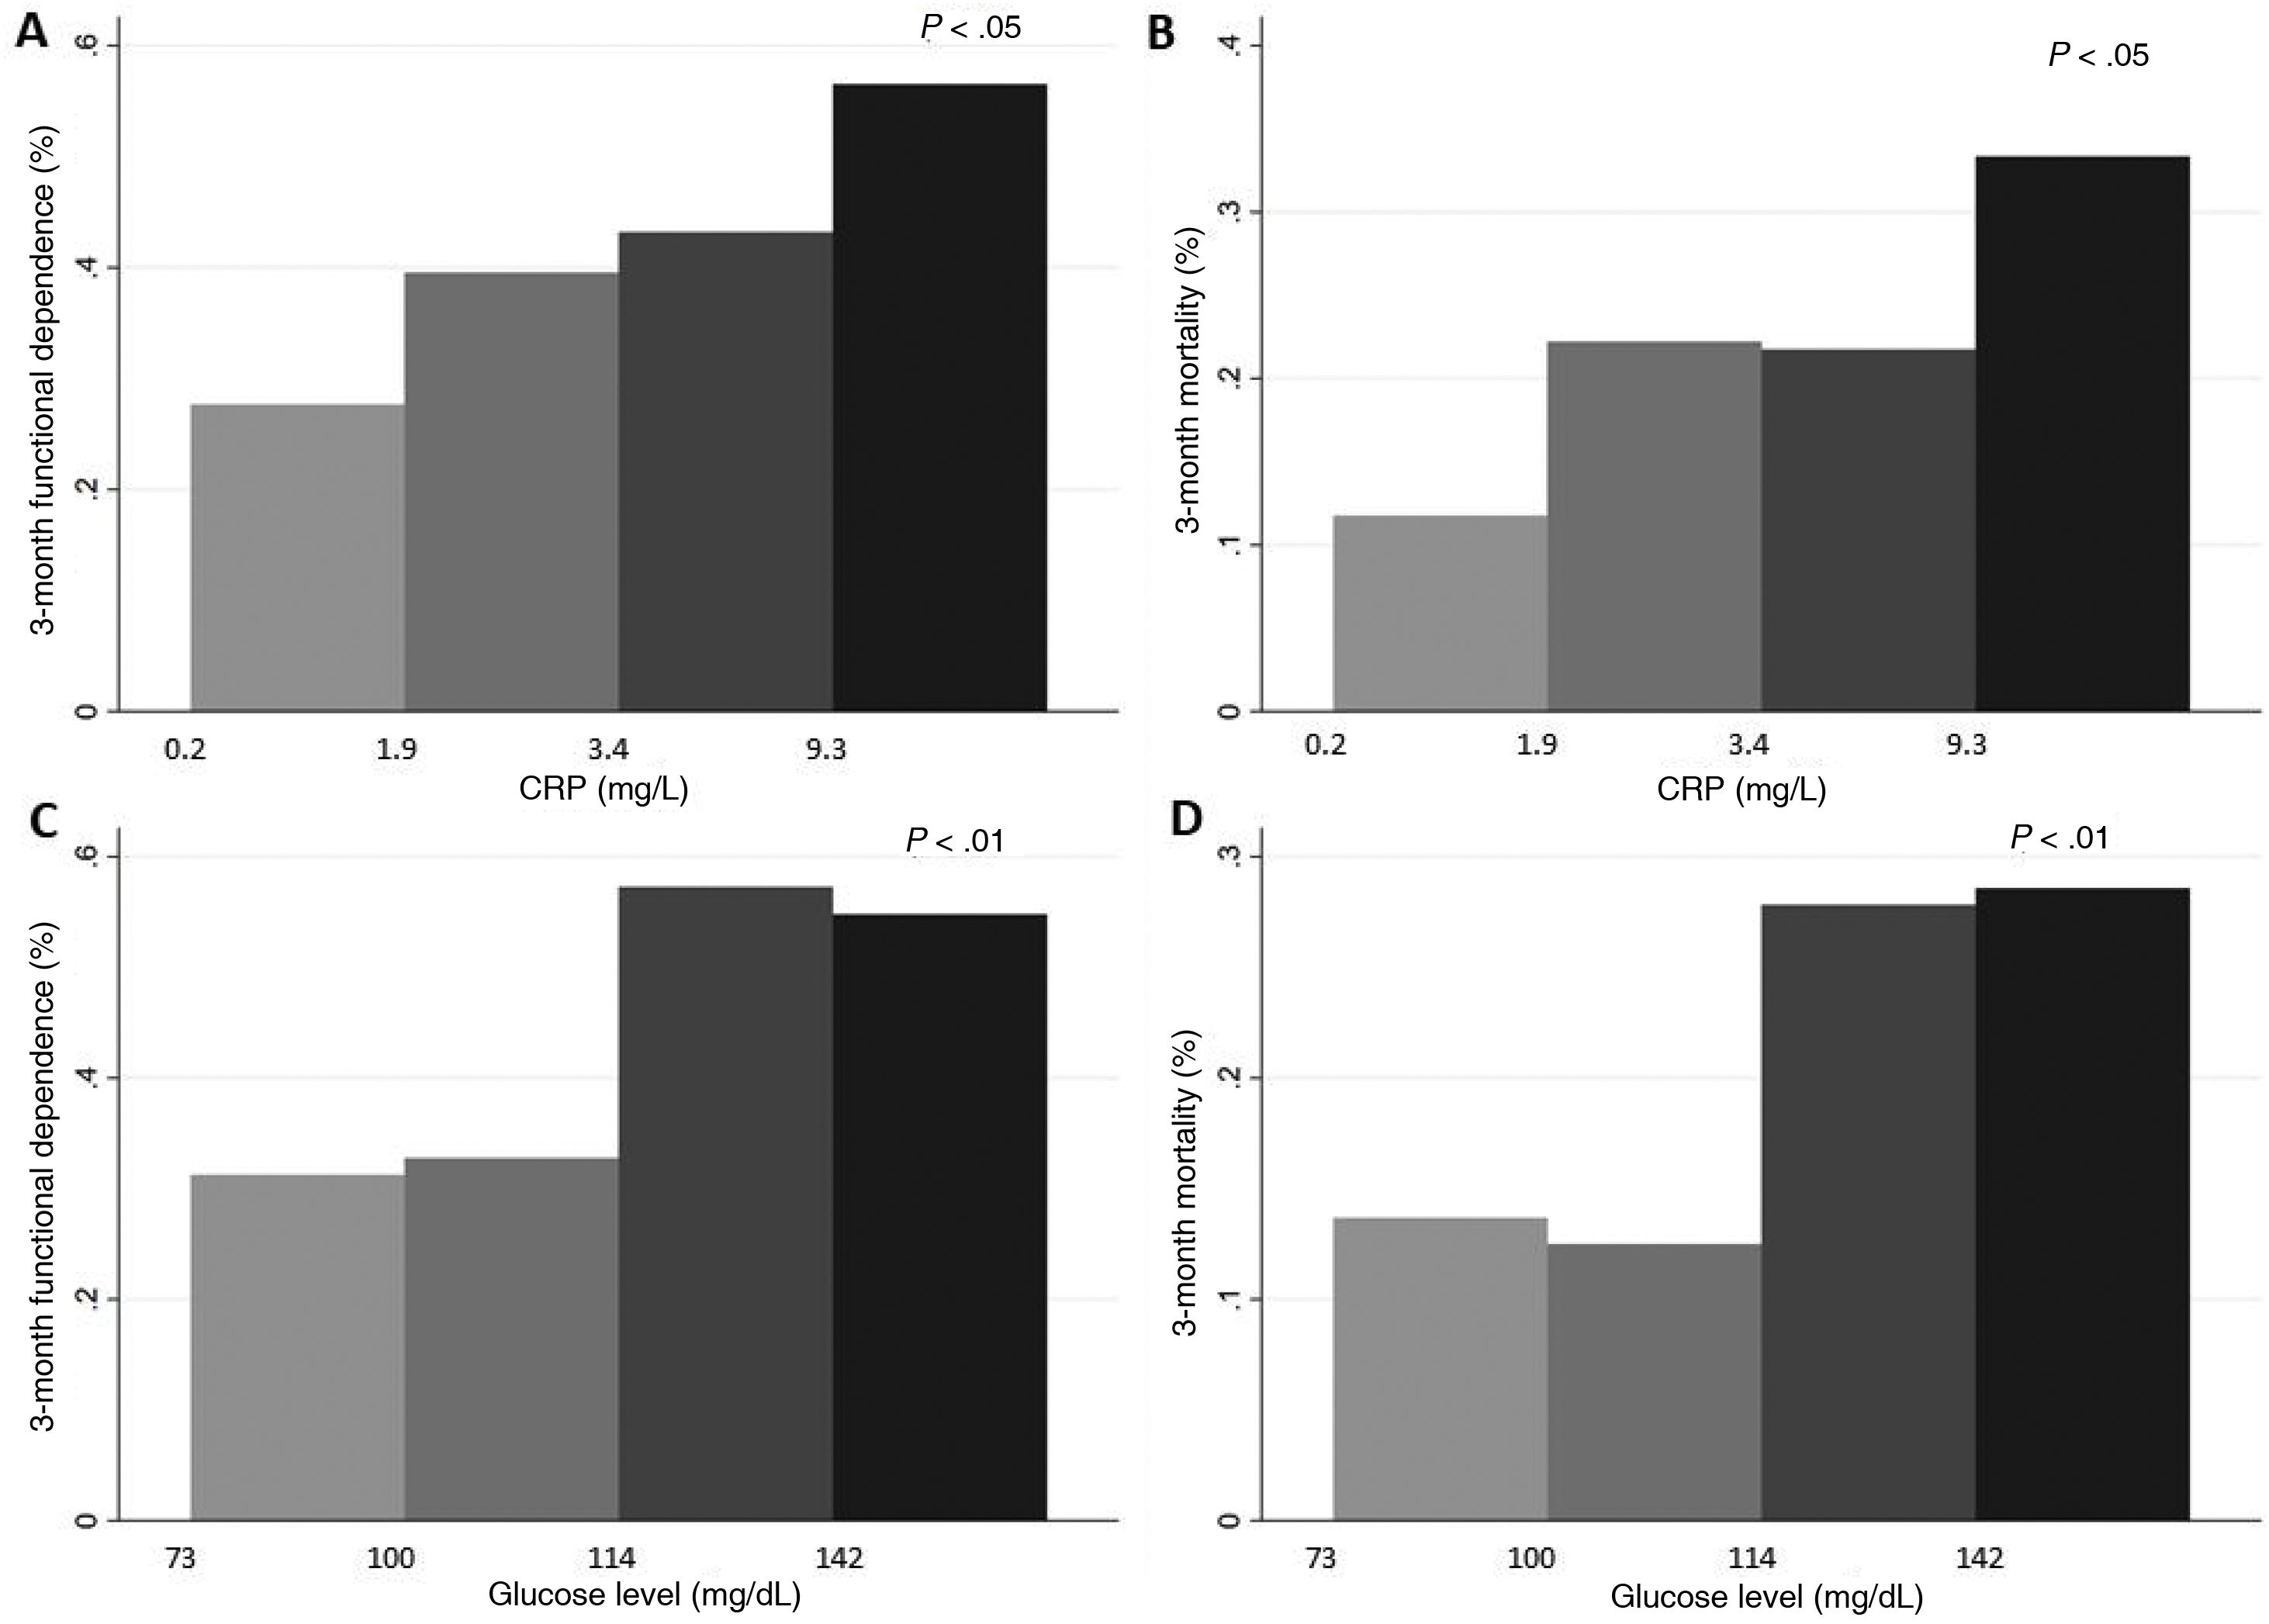
Lastly, CRP level was measured in only 210 patients. This inflammatory marker was correlated with neutrophil count (r = 0.26; P < .001) and glucose level (r = 0.14; P = .047). Higher CRP levels, evaluated by quartiles, were associated with functional dependence (Fig. 3). In multivariate models, CRP levels > 5.4 (upper limit of normal at our laboratory: 5) were associated with 2.7 times greater risk of 3-month mortality (Table 2).
 Differences in rates of 3-month functional dependence (A) and 3-month mortality (B), by quartiles of CRP level. C and D) Differences in the frequency of 3-month functional dependence (C) and 3-month mortality (D), by quartiles of glucose level. CRP: C-reactive protein.")
ANOVA. A and B) Differences in rates of 3-month functional dependence (A) and 3-month mortality (B), by quartiles of CRP level. C and D) Differences in the frequency of 3-month functional dependence (C) and 3-month mortality (D), by quartiles of glucose level.
CRP: C-reactive protein.
In our sample, the patients who died or were functionally dependent at 3 months presented higher glucose levels (Fig. 3); no association was found with stroke severity (ANOVA). Glucose levels > 120 mg/dL were associated with 2 times and 4 times greater risk of HT and functional dependence, respectively, as well as a threefold increase in 3-month mortality (Table 2).
Platelet countPlatelet count was positively correlated with neutrophil count (r = 0.22; P < .001) and negatively correlated with age (r = –0.19; P < .001). No significant differences in platelet count were found between patients with and without poor clinical progression (Table 1). Patients developing HT presented lower platelet counts than those without this complication (median: 174; Q1-Q3: 150-200 vs median: 199; Q1-Q3: 165-242.5; P < .001). The NPR was created to reflect the influence of both neutrophil count and platelet count on the risk of developing HT after stroke. This ratio acted as an independent predictor of haemorrhagic stroke: patients with NPR ≥ 32 presented up to 3 times greater risk of HT and 3-month mortality (Table 2).
Fibrinogen levelFibrinogen levels, measured at admission in 277 patients, were higher among patients who had died at 3 months and lower in those developing HT (median: 413; Q1-Q3: 341-524 vs median: 439.5; Q1-Q3: 364-502; P < .001); however, fibrinogen level did not act as an independent predictor of any prognostic variable in multivariate models (Table 2).
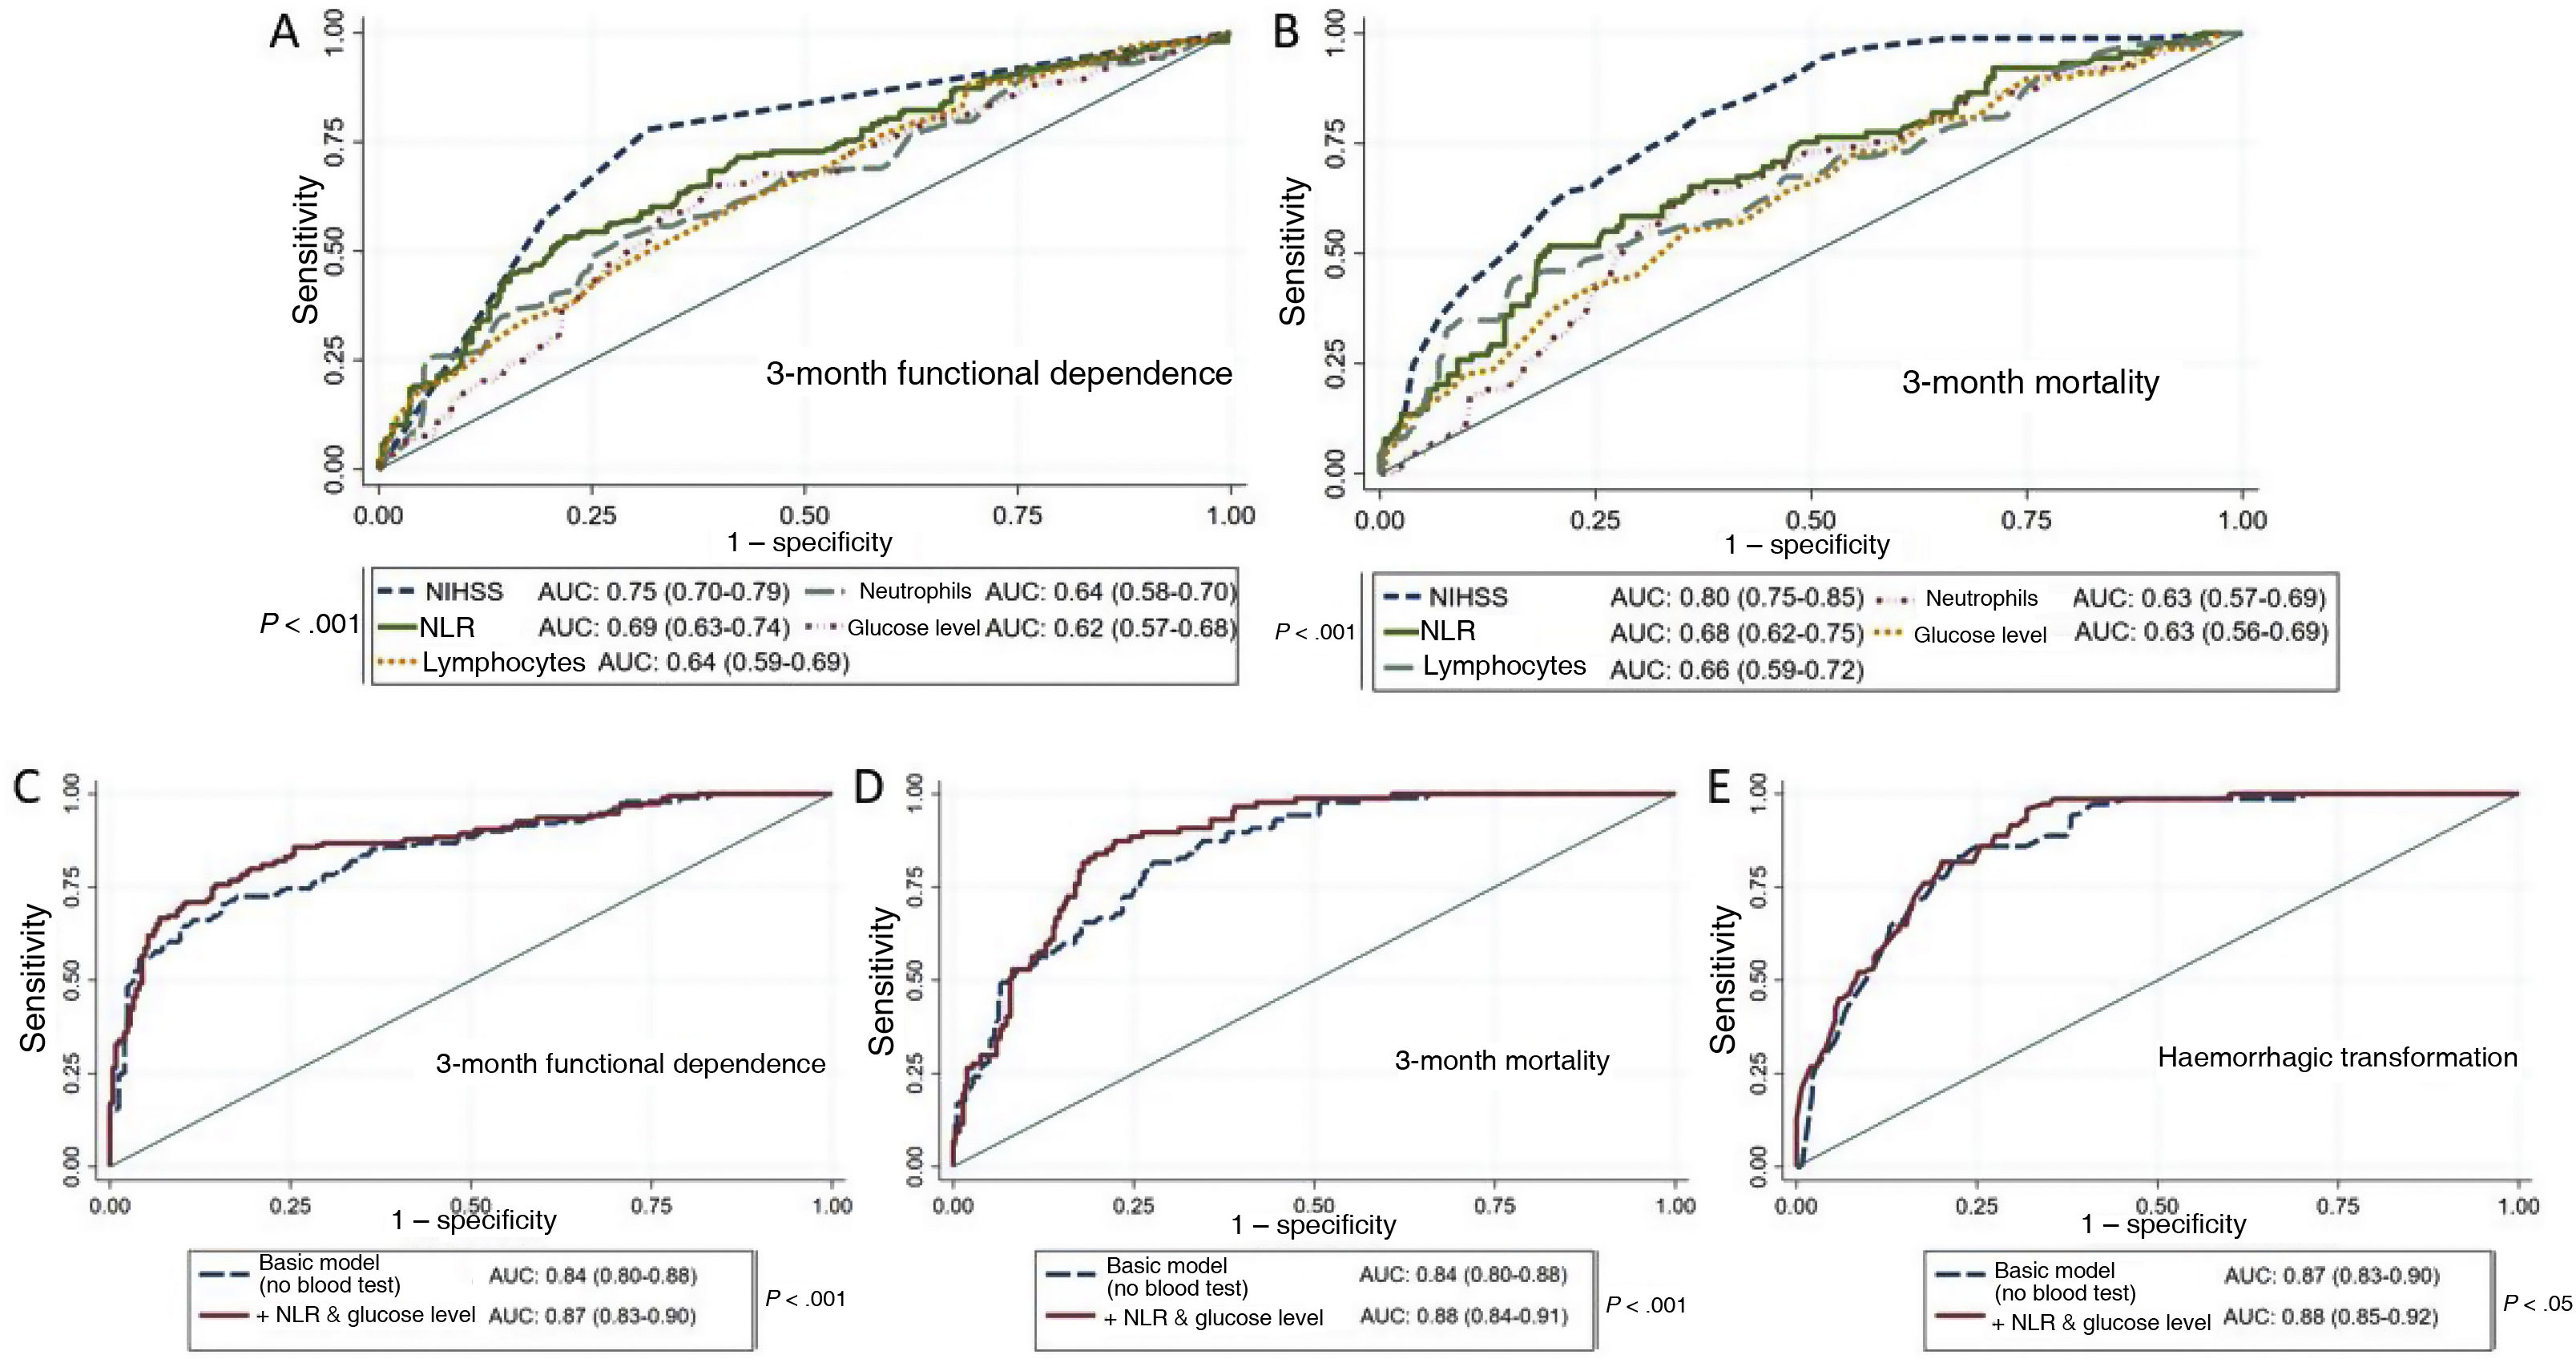
Prognostic modelsTo evaluate the prognostic value of the laboratory parameters obtained in emergency blood tests, we conducted ROC analyses for each prognostic variable. Stroke severity (NIHSS score) and NLR were the variables with the greatest predictive capacity for both functional dependence and mortality (Fig. 4A and B).
 ROC curves of the variables under study for prediction of 3-month functional dependence (A) and mortality (B). C and D) ROC curves for functional dependence (C) and mortality (D), comparing the predictive value of the basic model alone (adjusted for age, history of arterial hypertension, stroke severity according to the NIHSS, and baseline functional status according to the mRS) against that of the basic model combined with emergency laboratory parameters. E) ROC curves for prediction of HT with the basic model (adjusted for sex, previous use of antiplatelet or anticoagulant therapy, stroke severity according to the NIHSS, and fibrinolytic or endovascular therapy) and with the basic model combined with emergency laboratory parameters. AUC: area under the curve; HT: haemorrhagic transformation; mRS: modified Rankin Scale; NIHSS: National Institutes of Health Stroke Scale; NLR: neutrophil-to-lymphocyte ratio; NPR: neutrophil-to-platelet ratio.")
A and B) ROC curves of the variables under study for prediction of 3-month functional dependence (A) and mortality (B). C and D) ROC curves for functional dependence (C) and mortality (D), comparing the predictive value of the basic model alone (adjusted for age, history of arterial hypertension, stroke severity according to the NIHSS, and baseline functional status according to the mRS) against that of the basic model combined with emergency laboratory parameters. E) ROC curves for prediction of HT with the basic model (adjusted for sex, previous use of antiplatelet or anticoagulant therapy, stroke severity according to the NIHSS, and fibrinolytic or endovascular therapy) and with the basic model combined with emergency laboratory parameters.
AUC: area under the curve; HT: haemorrhagic transformation; mRS: modified Rankin Scale; NIHSS: National Institutes of Health Stroke Scale; NLR: neutrophil-to-lymphocyte ratio; NPR: neutrophil-to-platelet ratio.
We also built a basic model with demographic (age, history of arterial hypertension, baseline functional status) and clinical variables (stroke severity), and evaluated whether adding laboratory parameters improved its predictive capacity. We observed a significant increase in the area under the curve (AUC) for 3-month functional dependence and mortality after introducing the NLR and glucose level into the model (Fig. 4C and D), as well as an increase in discriminant ability (IDI: 0.08 [P < .01] and IDI: 0.05 [P < .01], respectively). The introduction of the NPR into the multivariate model for HT also significantly increased the AUC (Fig. 4E) and improved the discriminant ability of the model (IDI: 0.05; P < .01).
DiscussionOur study emphasises the usefulness of common laboratory parameters for early prediction of ischaemic stroke outcomes. The combination of clinical parameters and such common laboratory parameters as NLR and glucose level at admission improves the prognostic accuracy of predictive models from the time of arrival at the emergency department.
The use of blood biomarkers to predict stroke complications and sequelae has increased exponentially in recent years.18,19 However, these biomarkers are frequently difficult to determine, with results taking several days to arrive in some instances.20 Emergency management of patients with suspected ischaemic stroke involves the administration of a battery of tests, including determination of basic laboratory parameters enabling fast, comprehensive assessment aiming to identify possible comorbidities or conditions that may mimic, cause, or exacerbate ischaemia.1 Some of these commonly determined parameters in emergency blood tests have recently been shown to be of prognostic value, and may be used as biomarkers of stroke complications and prognosis.4,21–23
NLR, an easy-to-measure marker, has been shown to be a reliable prognostic marker in ischaemic stroke.7,9,24 We should mention the immunomodulatory imbalance reflected by the NLR, which involves a systemic inflammatory response in the form of neutrophilia and cytokine storm, as well as acquired immunodeficiency secondary to damage to the central nervous system.25 This imbalance has been linked to an increase in complications associated with high morbidity and mortality rates, such as pneumonia4,26 and symptomatic HT.6,27 In our study, NLR > 3 and > 3.86 were found to be strong independent predictors of functional dependence and mortality, respectively, with similar cut-off points to those reported in the literature.24,28 An association was also found between NLR > 3 and increased risk of HT, which highlights the usefulness of this biomarker in selecting candidates for revascularisation therapy and supports the hypothesis that neurophil overactivation may result in greater damage to the endothelium and blood-brain barrier.29
The NPR has been proposed as a fast, accessible biomarker of functional prognosis in the medium term in patients with stroke.23 One function of platelets is to stabilise areas of vascular injury; a high NPR is associated with greater blood-brain barrier disruption and, consequently, higher rates of HT.30 In our cohort, an NPR > 32 was associated with development of HT after stroke, improving the predictive capacity of the basic model of clinical and demographic variables.
The use of biomarkers for decision-making in ischaemic stroke is especially necessary for discriminating stroke mimics, selecting candidates for revascularisation therapy to decrease failure rates, adapting the available resources to each patient’s needs, and predicting potential complications that increase morbidity and mortality if detected late (eg, pneumonia, HT). The possibility of adding panels of the biomarkers presented in this study to traditional prediction models for use at the time of patient arrival at the emergency department may help in optimising resource allocation and improve ischaemic stroke management. The agreement between our findings and those of previous studies, and the positive effect on prediction, show that these currently underused tools may play a pivotal role in stroke management in the future. Further research is needed to adequately integrate these markers into the decision-making process.
This study presents the limitations inherent to observational studies, with the inability to rule out potential confounders. Furthermore, such parameters as CRP and fibrinogen levels were determined only in a small percentage of patients; therefore, we were unable to properly assess their association with outcome variables. Future studies should seek to validate our results in other cohorts with a view to understanding their applicability in other settings or populations.
ConclusionsSome laboratory parameters frequently determined in emergency blood tests have been found to act as independent predictors of mortality, functional dependence, and complications associated with high morbidity and mortality rates in patients with stroke. Emergency blood tests provide additional prognostic information that may help to optimise ischaemic stroke management protocols and resources.
FundingThis study was funded by the Instituto Carlos III Healthcare Research Fund (PI19/00065), the Biomedical Research Network for Cardiovascular Diseases (CIBERCV; CB16/11/00371), and the Network for Cooperative Research in Health Outcomes for Cerebrovascular Diseases (RICORS; RD21/0006/0008).
Conflicts of interestThe authors have no conflicts of interest to declare.
