


In recent decades, mortality rates for cerebrovascular diseases (CVD) have decreased significantly in many countries. This study analyses recent tendencies in CVD mortality rates in Andalusia (1980-2014) to identify any changes in previously observed sex and age trends.
Patients and methodsCVD mortality and population data were obtained from Spain's National Statistics Institute database. We calculated age-specific and age-standardised mortality rates using the direct method (European standard population). Joinpoint regression analysis was used to estimate the annual percentage change in rates and identify significant changes in mortality trends. We also estimated rate ratios between Andalusia and Spain.
ResultsStandardised rates for both males and females showed 3 periods in joinpoint regression analysis: an initial period of significant decline (1980-1997), a period of rate stabilisation (1997-2003), and another period of significant decline (2003-2014).
ConclusionsBetween 1997 and 2003, age-standardised rates stabilised in Andalusia but continued to decrease in Spain as a whole. This increased in the gap between CVD mortality rates in Andalusia and Spain for both sexes and most age groups.
En las últimas décadas las tasas de mortalidad por enfermedades cerebrovasculares (ECV) han descendido de forma importante en muchos países. En este estudio se analizan los cambios recientes en la evolución de la mortalidad por ECV en Andalucía (1980-2014) para verificar si las tendencias observadas previamente por sexo y grupos de edad continúan.
Pacientes y métodosLos datos de mortalidad por ECV y las poblaciones necesarias para el cálculo de los indicadores fueron facilitados por el Instituto Nacional de Estadística. Se calcularon las tasas específicas por grupos de edad y estandarizadas mediante el método directo (población estándar europea). Mediante análisis de regresión «joinpoint» estimamos el porcentaje de cambio anual de las tasas e identificamos puntos de cambio significativos en la tendencia. Además se han estimado las razones de tasas entre Andalucía y España.
ResultadosLas tasas estandarizadas en ambos sexos muestran en el análisis joinpoint 3 periodos: un periodo inicial de descenso significativo (1980-1997), un periodo de estabilización en las tasas (1997-2003) y un periodo de marcado descenso significativo (2003-2014).
ConclusionesEn el periodo 1997-2003 las tasas de Andalucía se estabilizaron, mientras que a nivel nacional las tasas continuaron descendiendo. Esto determinó un aumento en la brecha entre las tasas de Andalucía y España en ambos sexos y en la mayoría de los grupos de edad.
Although cerebrovascular disease (CVD) mortality rates have considerably decreased in many countries,1 CVDs still constitute the third greatest cause of death2 and the second leading cause of disability worldwide.3
Social inequalities in health are unjust, avoidable differences between population groups as defined in terms of social, economic, demographic, or geographical characteristics. These inequalities result from uneven access to healthcare opportunities and resources due to differences in social class, sex, geographical location, or ethnicity, which results in poorer health among socially disadvantaged populations.4
The incidence5 and mortality6 of CVDs are higher among socioeconomically disadvantaged people. Despite extensive evidence of social disparities in CVD survival, the causes are yet to be fully understood.7,8 According to a recent review article,9 CVDs disproportionately affect low- and middle-income countries; furthermore, differences between these and high-income countries have increased.10
Although CVD mortality has been observed to have decreased considerably in Spain over the 1980 to 2011 period,11 marked geographical differences are still observable (rates have remained constant or have decreased to a lesser extent in some areas of southern Spain).12
In a previous article, we analysed CVD mortality trends in Andalusia (1975-1999)13 and reported a marked decrease, regardless of sex. In this study, we provide updated information, analyse changes in CVD mortality in Andalusia, and determine CVD mortality trends by sex and age group for the period 1980 to 2014, and compare these data to data drawn from the population of Spain as a whole.
Patients and methodsData on the number of deaths, classified by year of death, sex, and age, were obtained from Spain's National Statistics Institute. Population data for Andalusia and Spain, by sex and age group, were also drawn from Spain's National Statistics Institute for each study year (1980-2014).
CVD deaths were identified with ICD-9 codes 430-438 and ICD-10 codes I60-I69 for the periods 1980 to 1998 and 1999 to 2014, respectively.
We also calculated age-specific crude mortality rates for each sex, which were adjusted for age (European standard population). Rates are expressed as number of deaths per 100000 person-years.
Trend analysis was performed with joinpoint regression models.14,15 These models have a double purpose: to identify time points associated with significant changes in trends, and to estimate the magnitude of trend changes in each time period. Results are expressed as the years (period) making up each trend and the annual percentage change (APC) for each trend. To estimate these models, we used standardised mortality rates (SMR) and their standard errors; in models using age-specific rates, we used deaths and populations applying the Poisson distribution. To reduce the likelihood of obtaining trends resulting from random fluctuations, we set a minimum number of 5 data points between 2 joinpoints. We established a maximum of 3 joinpoints for each regression model. The software searches for the simplest model that fits the data using the weighted least-squares technique and estimates statistical significance using the Monte Carlo Permutation method. A comparability test was performed to check whether trends in men and women or between geographical areas were parallel.16 Statistical significance was set at P=.05.
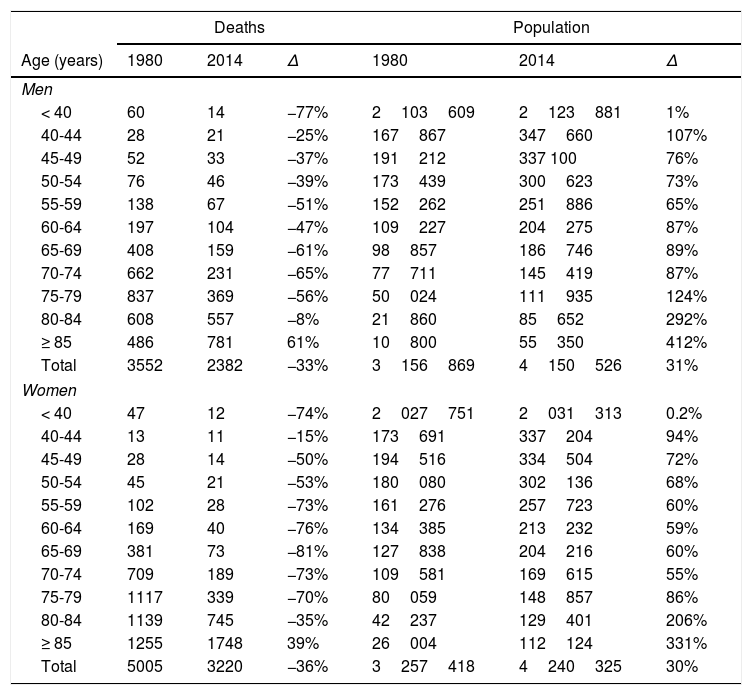
ResultsTable 1 shows the number of deaths and the population of Andalusia by sex and age group for the first and last years of the study period (1980 and 2014), and the percentage change between these 2 years. The number of deaths decreased both in men and in women for all age groups except for individuals aged 85 years or older (61% increase in men and 39% increase in women). Population increased both in men and in women for all age groups, although increases were much more marked among individuals aged 85 years and older (412% increase in men and 331% increase in women).
Number of deaths due to cerebrovascular disease and population size, broken down by age group and sex (Andalusia, 1980 and 2014).
| Deaths | Population | |||||
|---|---|---|---|---|---|---|
| Age (years) | 1980 | 2014 | Δ | 1980 | 2014 | Δ |
| Men | ||||||
| < 40 | 60 | 14 | −77% | 2103609 | 2123881 | 1% |
| 40-44 | 28 | 21 | −25% | 167867 | 347660 | 107% |
| 45-49 | 52 | 33 | −37% | 191212 | 337 100 | 76% |
| 50-54 | 76 | 46 | −39% | 173439 | 300623 | 73% |
| 55-59 | 138 | 67 | −51% | 152262 | 251886 | 65% |
| 60-64 | 197 | 104 | −47% | 109227 | 204275 | 87% |
| 65-69 | 408 | 159 | −61% | 98857 | 186746 | 89% |
| 70-74 | 662 | 231 | −65% | 77711 | 145419 | 87% |
| 75-79 | 837 | 369 | −56% | 50024 | 111935 | 124% |
| 80-84 | 608 | 557 | −8% | 21860 | 85652 | 292% |
| ≥ 85 | 486 | 781 | 61% | 10800 | 55350 | 412% |
| Total | 3552 | 2382 | −33% | 3156869 | 4150526 | 31% |
| Women | ||||||
| < 40 | 47 | 12 | −74% | 2027751 | 2031313 | 0.2% |
| 40-44 | 13 | 11 | −15% | 173691 | 337204 | 94% |
| 45-49 | 28 | 14 | −50% | 194516 | 334504 | 72% |
| 50-54 | 45 | 21 | −53% | 180080 | 302136 | 68% |
| 55-59 | 102 | 28 | −73% | 161276 | 257723 | 60% |
| 60-64 | 169 | 40 | −76% | 134385 | 213232 | 59% |
| 65-69 | 381 | 73 | −81% | 127838 | 204216 | 60% |
| 70-74 | 709 | 189 | −73% | 109581 | 169615 | 55% |
| 75-79 | 1117 | 339 | −70% | 80059 | 148857 | 86% |
| 80-84 | 1139 | 745 | −35% | 42237 | 129401 | 206% |
| ≥ 85 | 1255 | 1748 | 39% | 26004 | 112124 | 331% |
| Total | 5005 | 3220 | −36% | 3257418 | 4240325 | 30% |
Δ: percentage increase 1980 to 2014.
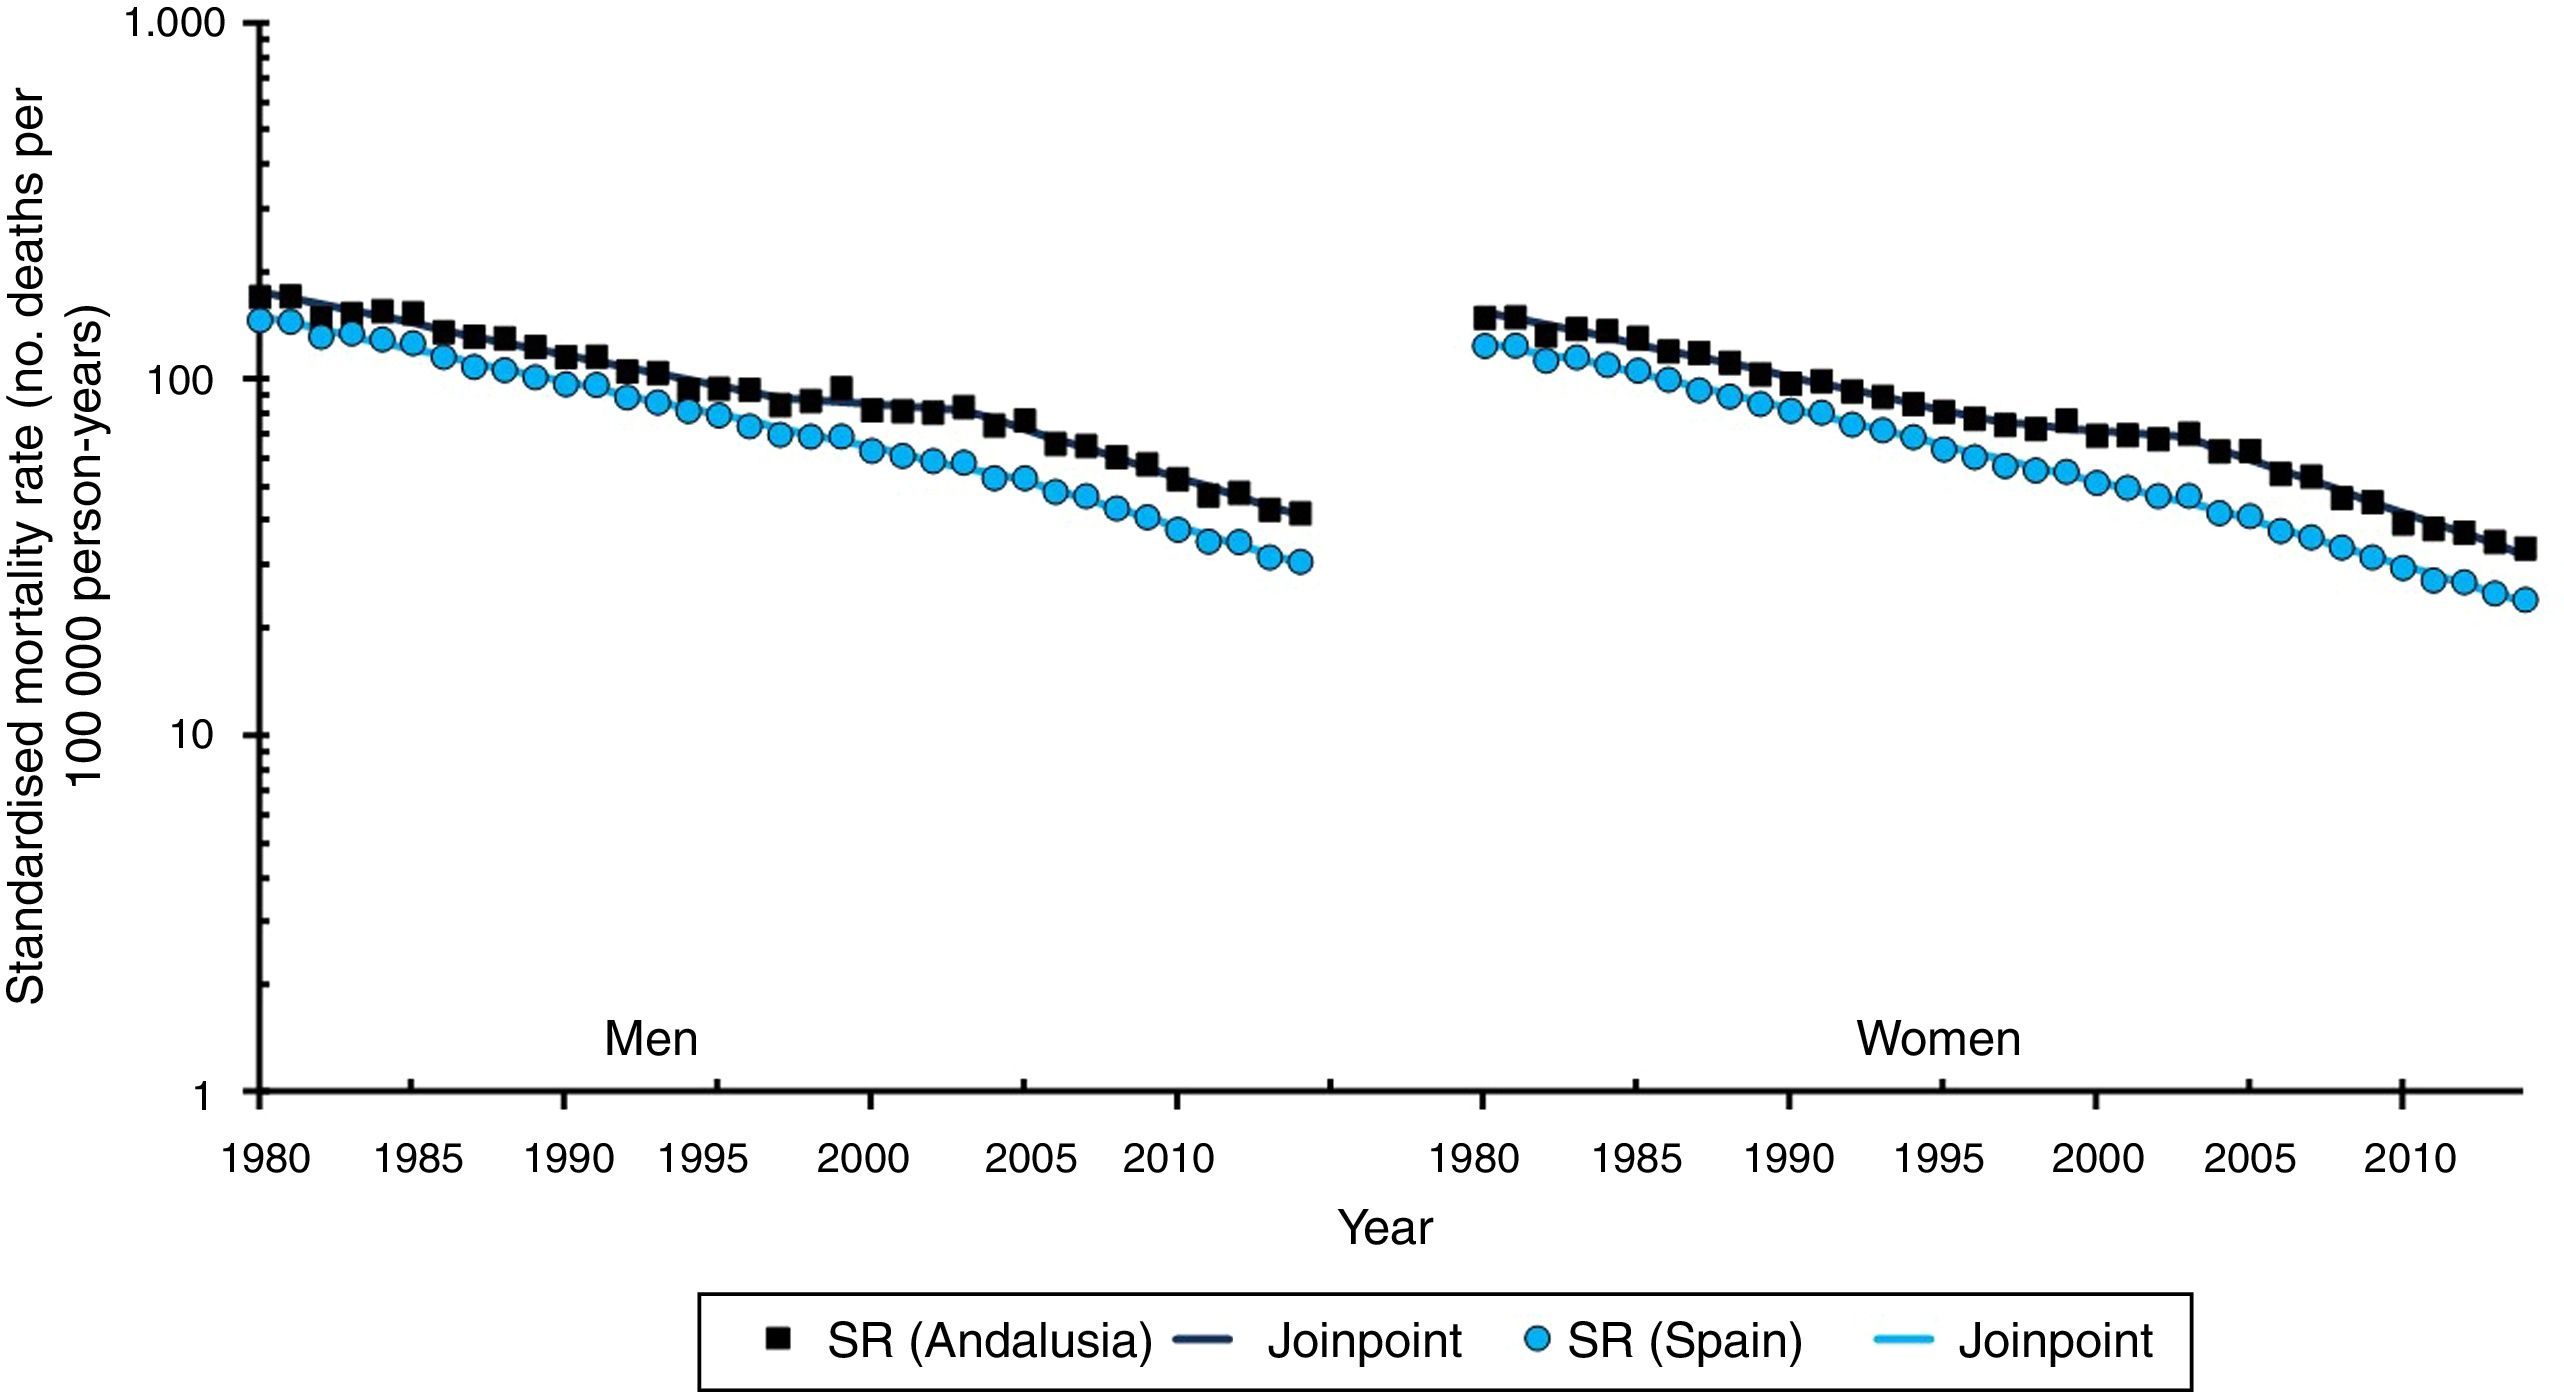
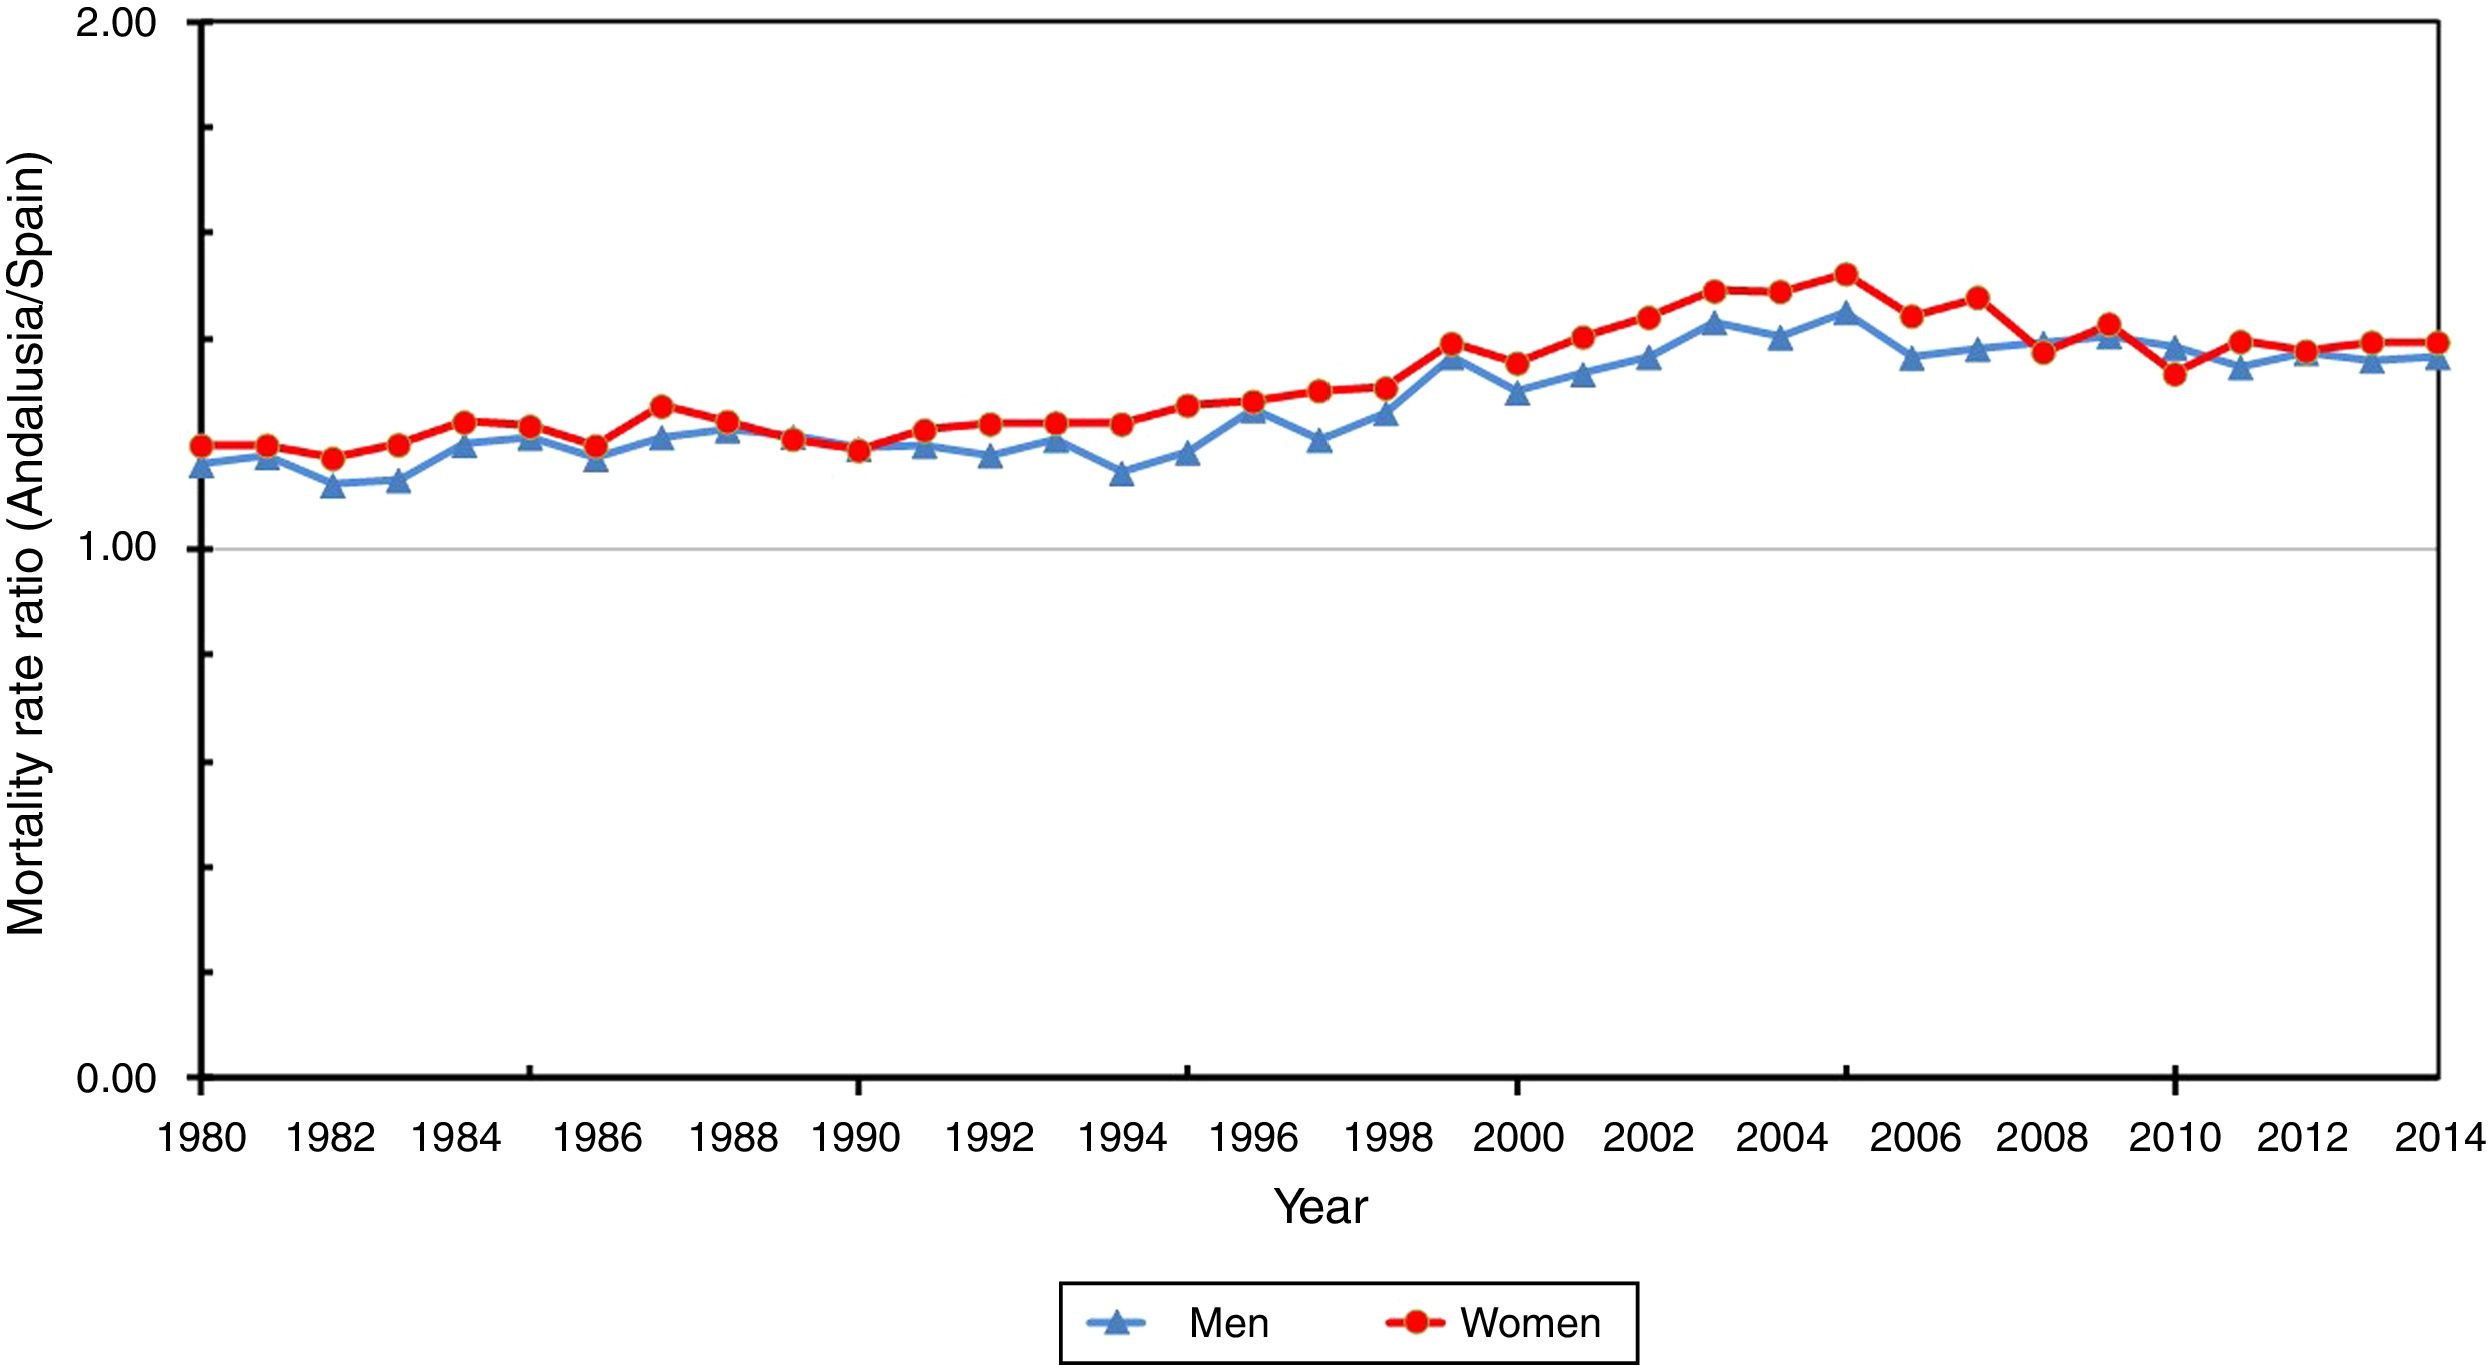
Fig. 1 shows sex-specific CVD SMRs in Spain and Andalusia for the 1980 to 2014 period, and Fig. 2 shows the Andalusia/Spain SMR ratio. Adjusted CVD SMRs show a marked, steady decrease in both sexes and in both Andalusia and Spain over the study period (Fig. 1).
. SR: standardised rate.")
.")
In Spain, SMRs in men decreased from 146.9 in 1980 to 30.8 in 2014. Joinpoint regression analysis shows 2 distinct periods; both follow a downward trend, which is more marked in the second period (2005-2014, −5.8%, P<.05) than in the first (1980-2005, −4.2%, P<.05) (Fig. 1). SMRs are slightly lower in women than in men and do not follow a parallel trend. The joinpoint regression model reveals 3 periods where the decrease rate increases significantly: 1980 to 1984, −3.5%; 1984 to 2005, −4.6%; and 2004 to 2014, −5.8% (Fig. 1).
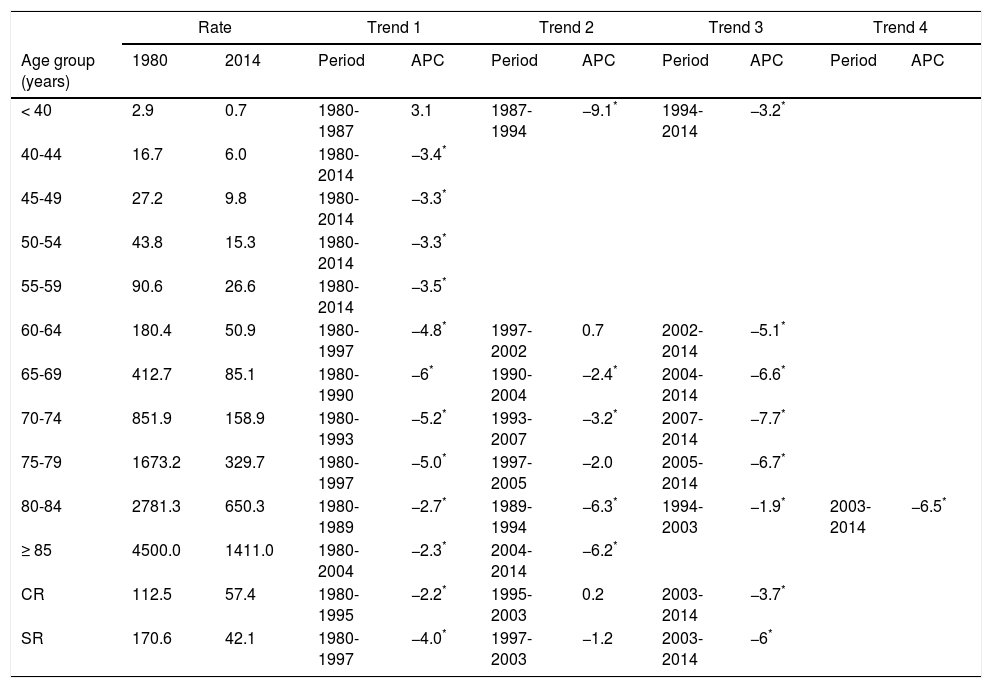
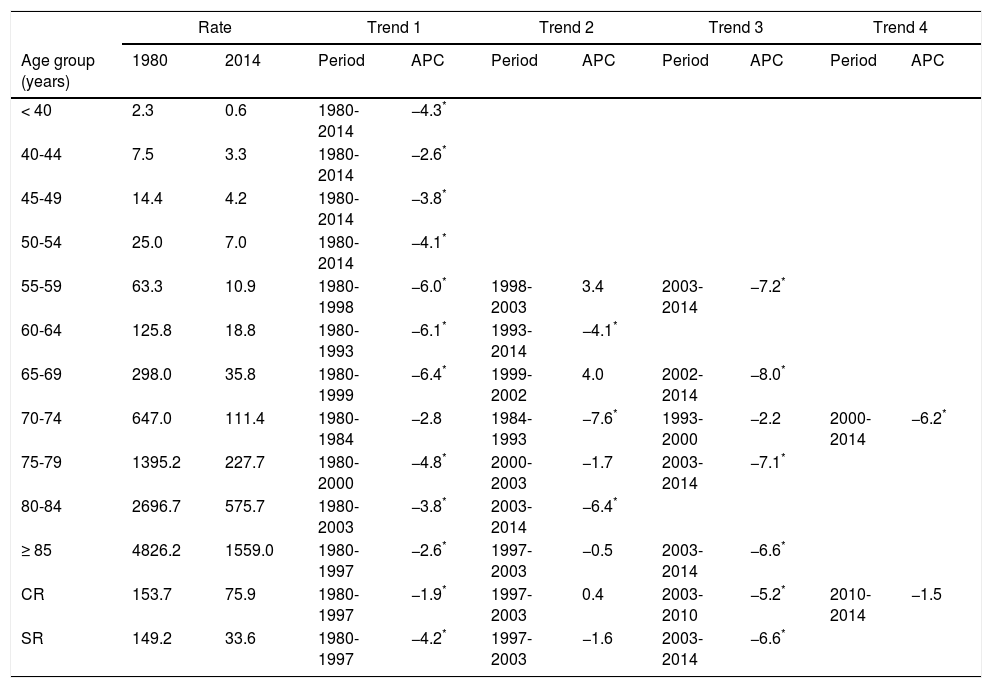
In Andalusia, SMRs for men decreased from 170.6 in 1980 to 42.1 in 2014. Joinpoint regression analysis shows an initial period of significant decreases (1980-1997, −4.0%), a period of relative stability (1997-2003, −1.2%, non-significant), and a third period of significant, marked decreases (2003-2014, −6.0%, P<.05) (Fig. 1, Table 2). SMRs are slightly lower in women than in men and do not follow a parallel trend. Over the study period, adjusted rates fell from 149.2 in 1980 to 33.6 in 2014. Joinpoint regression analysis shows an initial period of significant decreases (1980-1997, −4.2%), a period of stability (1997-2003, −1.6%, non-significant), and a third period of significant, marked decreases (2003-2014, −6.6%, P<.05) (Fig. 1, Table 3).
Age-specific trends in standardised cerebrovascular disease mortality rates (men, Andalusia 1980-2014).
| Rate | Trend 1 | Trend 2 | Trend 3 | Trend 4 | ||||||
|---|---|---|---|---|---|---|---|---|---|---|
| Age group (years) | 1980 | 2014 | Period | APC | Period | APC | Period | APC | Period | APC |
| < 40 | 2.9 | 0.7 | 1980-1987 | 3.1 | 1987-1994 | −9.1* | 1994-2014 | −3.2* | ||
| 40-44 | 16.7 | 6.0 | 1980-2014 | −3.4* | ||||||
| 45-49 | 27.2 | 9.8 | 1980-2014 | −3.3* | ||||||
| 50-54 | 43.8 | 15.3 | 1980-2014 | −3.3* | ||||||
| 55-59 | 90.6 | 26.6 | 1980-2014 | −3.5* | ||||||
| 60-64 | 180.4 | 50.9 | 1980-1997 | −4.8* | 1997-2002 | 0.7 | 2002-2014 | −5.1* | ||
| 65-69 | 412.7 | 85.1 | 1980-1990 | −6* | 1990-2004 | −2.4* | 2004-2014 | −6.6* | ||
| 70-74 | 851.9 | 158.9 | 1980-1993 | −5.2* | 1993-2007 | −3.2* | 2007-2014 | −7.7* | ||
| 75-79 | 1673.2 | 329.7 | 1980-1997 | −5.0* | 1997-2005 | −2.0 | 2005-2014 | −6.7* | ||
| 80-84 | 2781.3 | 650.3 | 1980-1989 | −2.7* | 1989-1994 | −6.3* | 1994-2003 | −1.9* | 2003-2014 | −6.5* |
| ≥ 85 | 4500.0 | 1411.0 | 1980-2004 | −2.3* | 2004-2014 | −6.2* | ||||
| CR | 112.5 | 57.4 | 1980-1995 | −2.2* | 1995-2003 | 0.2 | 2003-2014 | −3.7* | ||
| SR | 170.6 | 42.1 | 1980-1997 | −4.0* | 1997-2003 | −1.2 | 2003-2014 | −6* | ||
APC: annual percentage change; CR: crude rate; SR: standardised rate.
Age-specific trends in standardised cerebrovascular disease mortality rates (women, Andalusia 1980-2014).
| Rate | Trend 1 | Trend 2 | Trend 3 | Trend 4 | ||||||
|---|---|---|---|---|---|---|---|---|---|---|
| Age group (years) | 1980 | 2014 | Period | APC | Period | APC | Period | APC | Period | APC |
| < 40 | 2.3 | 0.6 | 1980-2014 | −4.3* | ||||||
| 40-44 | 7.5 | 3.3 | 1980-2014 | −2.6* | ||||||
| 45-49 | 14.4 | 4.2 | 1980-2014 | −3.8* | ||||||
| 50-54 | 25.0 | 7.0 | 1980-2014 | −4.1* | ||||||
| 55-59 | 63.3 | 10.9 | 1980-1998 | −6.0* | 1998-2003 | 3.4 | 2003-2014 | −7.2* | ||
| 60-64 | 125.8 | 18.8 | 1980-1993 | −6.1* | 1993-2014 | −4.1* | ||||
| 65-69 | 298.0 | 35.8 | 1980-1999 | −6.4* | 1999-2002 | 4.0 | 2002-2014 | −8.0* | ||
| 70-74 | 647.0 | 111.4 | 1980-1984 | −2.8 | 1984-1993 | −7.6* | 1993-2000 | −2.2 | 2000-2014 | −6.2* |
| 75-79 | 1395.2 | 227.7 | 1980-2000 | −4.8* | 2000-2003 | −1.7 | 2003-2014 | −7.1* | ||
| 80-84 | 2696.7 | 575.7 | 1980-2003 | −3.8* | 2003-2014 | −6.4* | ||||
| ≥ 85 | 4826.2 | 1559.0 | 1980-1997 | −2.6* | 1997-2003 | −0.5 | 2003-2014 | −6.6* | ||
| CR | 153.7 | 75.9 | 1980-1997 | −1.9* | 1997-2003 | 0.4 | 2003-2010 | −5.2* | 2010-2014 | −1.5 |
| SR | 149.2 | 33.6 | 1980-1997 | −4.2* | 1997-2003 | −1.6 | 2003-2014 | −6.6* | ||
APC: annual percentage change; CR: crude rate; SR: standardised rate.
Fig. 2 shows how Andalusia/Spain SMR ratios peak in 2005, both for men (1.45) and for women (1.52).
Tables 2 and 3 show the results of the joinpoint regression analysis, that is, the points representing significant changes in rates (age group–specific, crude, and adjusted), and the APC for each trend in Andalusia, for both men and women. No joinpoints were observed in the decrease in rates (which ranged from −2.6% to −4.3%) in men aged 40 to 54 years or in women younger than 54 years for the period 1980 to 2014. During the 1990s and the first years of the 21st century, SMRs stabilised or decreased more slowly in men aged 60 to 84 years and in women aged 55 to 59 and 65 to 74 years. After this period, the decrease is more pronounced, both in men and in women.
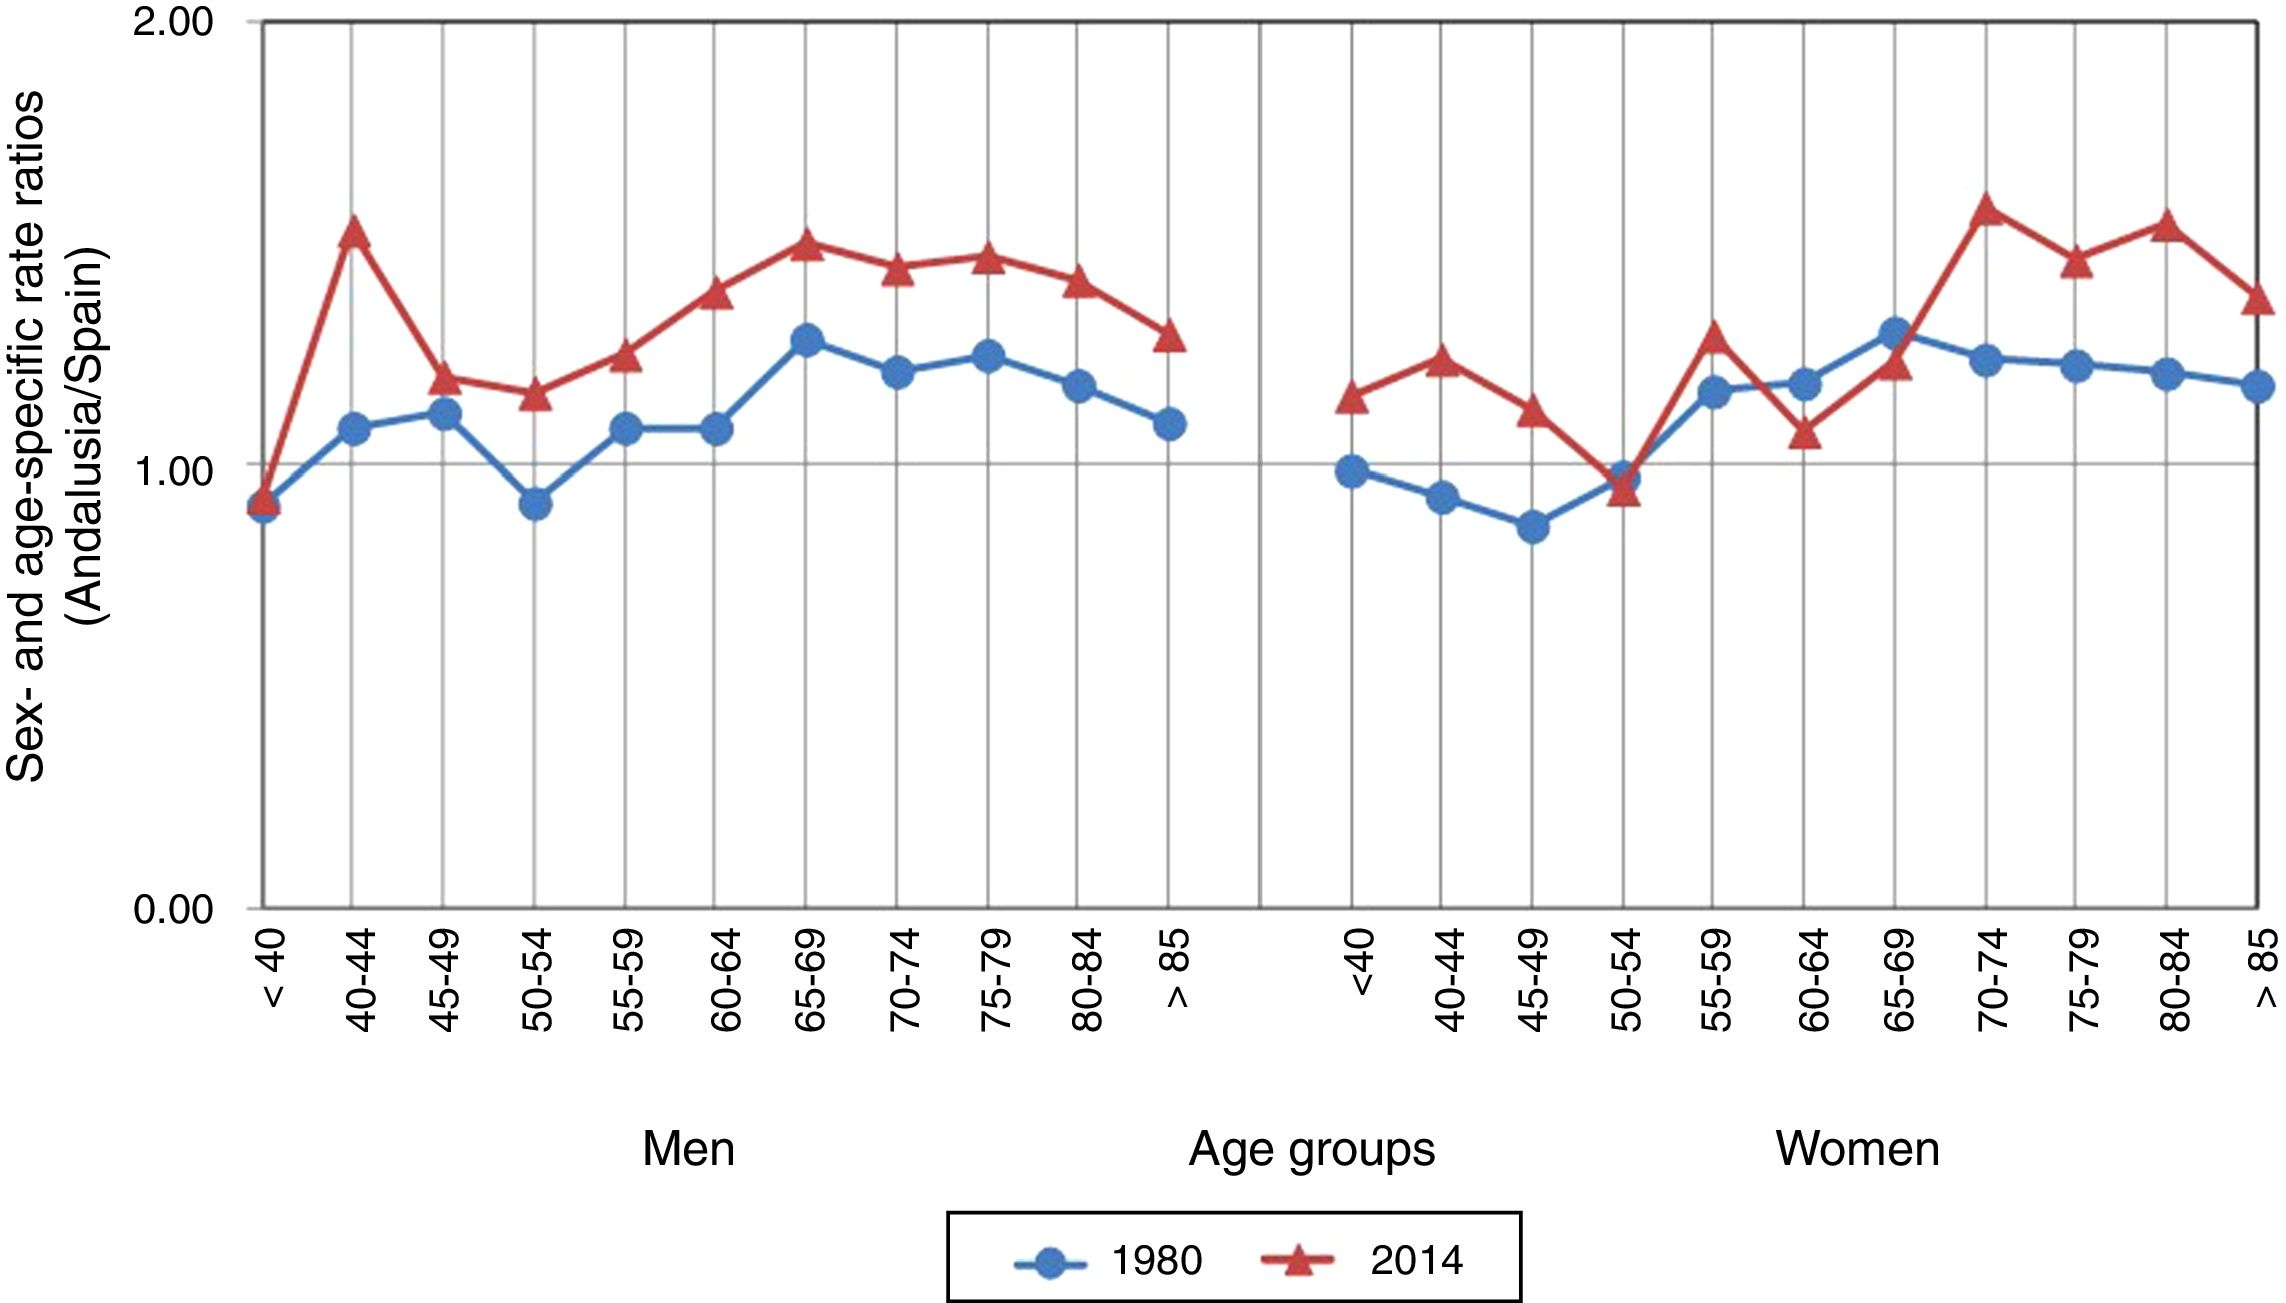
Fig. 3 shows the age- and sex-specific CVD mortality rate ratios (Andalusia/Spain) for the years 1980 and 2014. In both years, age-specific rates for men in Andalusia are higher than rates in Spain for all age groups except for men aged < 40 years and 50 to 54 years in 1980, and men aged < 40 years in 2014. Differences between rates in Andalusia and Spain increased between 1980 and 2014 in all age groups except for men younger than 40. For women, rates in Andalusia were lower than those in Spain only for the age groups below 55 years in 1980 and the age group 50 to 54 years in 2014. Most age groups showed an increase in the difference between Andalusia and Spain from 1980 to 2014.
Discussion.")
Studies of mortality due to CVD provide preliminary data on the risk of CVD by age, sex, and geographical location, and estimate case fatality and time trends,17 especially when incidence data is scarce.18 Official data on mortality due to CVD may be used for trend analysis and comparisons, at least in those countries where mortality data includes validation of diagnosis.19
During the 1990 to 2010 period, CVD mortality rates decreased by 20% in low-income countries and by 37% in high-income countries.9
The decrease in CVD mortality rates observed in Andalusia for the 1980 to 1997 period is similar to that observed in Spain (−4% per year) and may be attributed to improvements in healthcare for patients with CVDs or CVD risk factors. Reforms in primary care brought about the inclusion of services associated with prevention and care for patients with risk factors20 (50%-70% of acute strokes are initially assessed by primary care physicians).21,22 However, other factors must also be involved (factors probably linked to Andalusia's economic and social development in the 1980s): for example, when antihypertensive treatment was introduced, CVD mortality rates were already decreasing.23
No appropriate records are available to determine to what extent the decline in mortality is attributable to a decrease in incidence and/or case fatality.
Over the past decades, CVD incidence has decreased by 42% in high-income countries (this has been attributed to preventive treatments and/or a decrease in the incidence of risk factors at the population level), whereas it has multiplied by 2.3 times in low- and middle-income countries.24
Estimated incidence in Spain is 120 to 350 cases per 100000 person-years,25 although there is considerable variability in terms of geographical locations and time trends. Rates of hospitalisation due to acute CVD have decreased in some areas26,27 and increased in others.28,29
During the 1997 to 2003 period, mortality rates stabilised in Andalusia and decreased in Spain. This results in an increase in the differences between mortality rates in Andalusia and Spain for both sexes and most age groups (Figs. 1-3).
Like Spain as a whole, Andalusia was affected by the economic crisis of the 1990s, coinciding with the worst drought of the 20th century (peaking in 1995), which resulted in disastrous agricultural losses. This socioeconomic situation may have increased the prevalence of risk factors30 and, despite universal coverage under the Spanish healthcare system, decreased the use of preventive services in socioeconomically disadvantaged populations (which also have greater disease burden)31; this may explain a change in CVD mortality trends.32,33 Furthermore, risk equations based exclusively on clinical factors and used to determine the prescription of preventive treatments underestimate the cardiovascular risk of individuals with a lower socioeconomic level.34
The introduction of the ICD-10 in 1999 affected trends of some causes of mortality (rare or non-specific diseases) for the period 1999 to 2004 but had no impact on CVD mortality trends in Spain.35
During the 2003 to 2014 period, mortality rates decreased at a slightly faster pace in Andalusia than in Spain as a whole, both in men (−6% vs −5.5%) and in women (−6.6% vs −5.7%). This may reflect the different stroke management strategies in Andalusia: the Integrated Care Process for Cerebrovascular Accidents (2002 and a 2015 revision),36 the Andalusian Acute Cerebrovascular Disease Plan, establishing code stroke activation and implementing fibrinolytic treatment (2008),37 and the Andalusian Stroke Care Plan (2011-2014),38 which may have helped identify and control risk factors.
Andalusia (2014) is one of the most disadvantaged autonomous communities in Spain. It has the highest unemployment rate (34.23%) in the country and the second-lowest per-capita GDP (€16884) and public healthcare expenditure (€1042).39 Worldwide, increased unemployment rates and reduced healthcare spending have been associated with a significant increase in mortality due to CVD.40
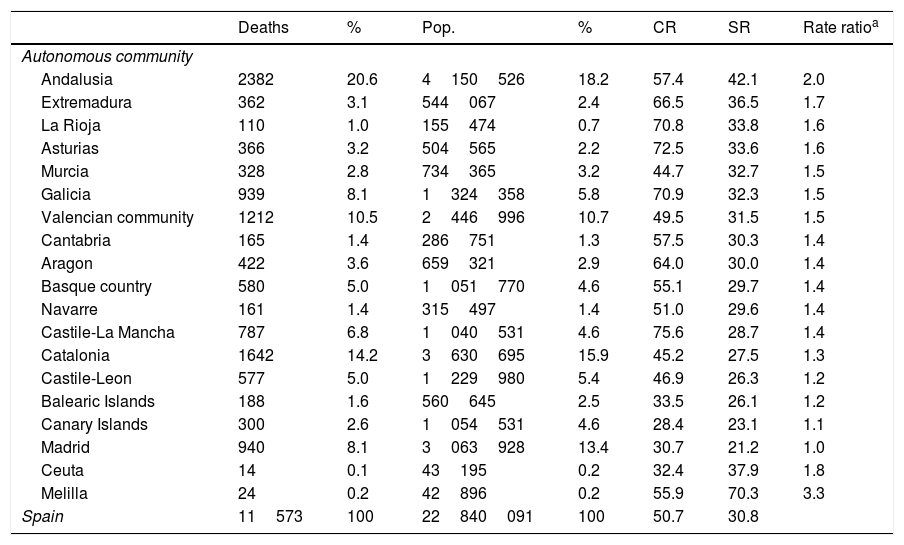
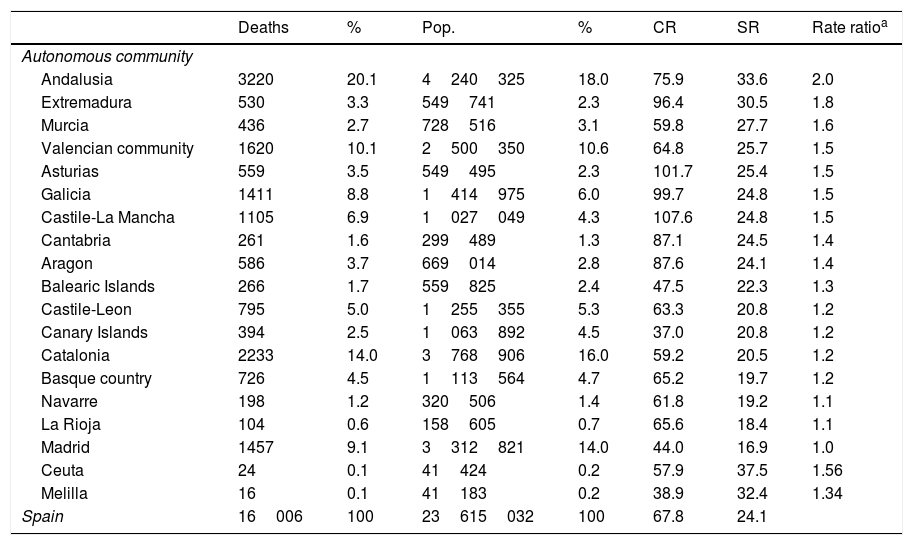
The prevalence of risk factors in Andalusia continues to be higher than the Spanish average41,42 (even surpassing the United States average for obesity and diabetes mellitus)43; and CVD mortality rates in Andalusia are the second highest in Spain in both women and men (after Ceuta and Melilla, respectively), and are twice as high as those for the Region of Madrid (which has the lowest rates) (Tables 4 and 5). Furthermore, CVD management (2014) is still lacking, with insufficient equipment and human resources to provide comprehensive, coordinated care (half of Andalusian hospitals lack neurologists and the number of stroke unit beds per 100000 inhabitants is the lowest in Spain44); a lack of specific training in lower-level centres and in primary care; and poor communication between primary and specialised care.45
Mortality due to cerebrovascular disease in men, by autonomous community (2014).
| Deaths | % | Pop. | % | CR | SR | Rate ratioa | |
|---|---|---|---|---|---|---|---|
| Autonomous community | |||||||
| Andalusia | 2382 | 20.6 | 4150526 | 18.2 | 57.4 | 42.1 | 2.0 |
| Extremadura | 362 | 3.1 | 544067 | 2.4 | 66.5 | 36.5 | 1.7 |
| La Rioja | 110 | 1.0 | 155474 | 0.7 | 70.8 | 33.8 | 1.6 |
| Asturias | 366 | 3.2 | 504565 | 2.2 | 72.5 | 33.6 | 1.6 |
| Murcia | 328 | 2.8 | 734365 | 3.2 | 44.7 | 32.7 | 1.5 |
| Galicia | 939 | 8.1 | 1324358 | 5.8 | 70.9 | 32.3 | 1.5 |
| Valencian community | 1212 | 10.5 | 2446996 | 10.7 | 49.5 | 31.5 | 1.5 |
| Cantabria | 165 | 1.4 | 286751 | 1.3 | 57.5 | 30.3 | 1.4 |
| Aragon | 422 | 3.6 | 659321 | 2.9 | 64.0 | 30.0 | 1.4 |
| Basque country | 580 | 5.0 | 1051770 | 4.6 | 55.1 | 29.7 | 1.4 |
| Navarre | 161 | 1.4 | 315497 | 1.4 | 51.0 | 29.6 | 1.4 |
| Castile-La Mancha | 787 | 6.8 | 1040531 | 4.6 | 75.6 | 28.7 | 1.4 |
| Catalonia | 1642 | 14.2 | 3630695 | 15.9 | 45.2 | 27.5 | 1.3 |
| Castile-Leon | 577 | 5.0 | 1229980 | 5.4 | 46.9 | 26.3 | 1.2 |
| Balearic Islands | 188 | 1.6 | 560645 | 2.5 | 33.5 | 26.1 | 1.2 |
| Canary Islands | 300 | 2.6 | 1054531 | 4.6 | 28.4 | 23.1 | 1.1 |
| Madrid | 940 | 8.1 | 3063928 | 13.4 | 30.7 | 21.2 | 1.0 |
| Ceuta | 14 | 0.1 | 43195 | 0.2 | 32.4 | 37.9 | 1.8 |
| Melilla | 24 | 0.2 | 42896 | 0.2 | 55.9 | 70.3 | 3.3 |
| Spain | 11573 | 100 | 22840091 | 100 | 50.7 | 30.8 | |
CR: crude rate; Pop.: population; SR: standardised rate.
Mortality due to cerebrovascular disease in women, by autonomous community (2014).
| Deaths | % | Pop. | % | CR | SR | Rate ratioa | |
|---|---|---|---|---|---|---|---|
| Autonomous community | |||||||
| Andalusia | 3220 | 20.1 | 4240325 | 18.0 | 75.9 | 33.6 | 2.0 |
| Extremadura | 530 | 3.3 | 549741 | 2.3 | 96.4 | 30.5 | 1.8 |
| Murcia | 436 | 2.7 | 728516 | 3.1 | 59.8 | 27.7 | 1.6 |
| Valencian community | 1620 | 10.1 | 2500350 | 10.6 | 64.8 | 25.7 | 1.5 |
| Asturias | 559 | 3.5 | 549495 | 2.3 | 101.7 | 25.4 | 1.5 |
| Galicia | 1411 | 8.8 | 1414975 | 6.0 | 99.7 | 24.8 | 1.5 |
| Castile-La Mancha | 1105 | 6.9 | 1027049 | 4.3 | 107.6 | 24.8 | 1.5 |
| Cantabria | 261 | 1.6 | 299489 | 1.3 | 87.1 | 24.5 | 1.4 |
| Aragon | 586 | 3.7 | 669014 | 2.8 | 87.6 | 24.1 | 1.4 |
| Balearic Islands | 266 | 1.7 | 559825 | 2.4 | 47.5 | 22.3 | 1.3 |
| Castile-Leon | 795 | 5.0 | 1255355 | 5.3 | 63.3 | 20.8 | 1.2 |
| Canary Islands | 394 | 2.5 | 1063892 | 4.5 | 37.0 | 20.8 | 1.2 |
| Catalonia | 2233 | 14.0 | 3768906 | 16.0 | 59.2 | 20.5 | 1.2 |
| Basque country | 726 | 4.5 | 1113564 | 4.7 | 65.2 | 19.7 | 1.2 |
| Navarre | 198 | 1.2 | 320506 | 1.4 | 61.8 | 19.2 | 1.1 |
| La Rioja | 104 | 0.6 | 158605 | 0.7 | 65.6 | 18.4 | 1.1 |
| Madrid | 1457 | 9.1 | 3312821 | 14.0 | 44.0 | 16.9 | 1.0 |
| Ceuta | 24 | 0.1 | 41424 | 0.2 | 57.9 | 37.5 | 1.56 |
| Melilla | 16 | 0.1 | 41183 | 0.2 | 38.9 | 32.4 | 1.34 |
| Spain | 16006 | 100 | 23615032 | 100 | 67.8 | 24.1 | |
CR: crude rate; Pop.: population; SR: standardised rate.
Primary care efforts to control traditional risk factors in socioeconomically disadvantaged populations46 and ensuring equal access to high-quality acute hospital care are essential to eradicate inequalities in CVD mortality47 in Andalusia.
Due to population ageing, CVDs continue to pose a challenge for prevention and healthcare policy, especially in elderly populations, in whom prognosis is poorer in terms of both the associated mortality (Table 1) and the functional sequelae and healthcare costs, particularly in the case of cerebral haemorrhages.48
Strengths and limitationsWe analysed trends in CVD mortality rates over a long period of time (35 years) using joinpoint regression analysis, which can objectively identify periods. This avoids the need for pre-established time periods, which may bias how trends are analysed.
Although our analysis identifies objective changes in CVD mortality rates, the methodology used prevents us from determining the causes of these changes.
Studying mortality rates by year of birth, rather than by age and period, may be more appropriate. In any case, our analysis by age group in consecutive years is reasonably close to this approach.49
ConclusionsOur data show that the CVD mortality rate is 50% higher in Andalusia than in Spain as a whole, and twice as high as in the Region of Madrid (the autonomous community with the lowest rate). Although we detected a marked decrease in CVD mortality over the study period (1980-2014), rates stabilised between 1997 and 2003 in Andalusia, whereas they continued to decrease in Spain as a whole, widening the gap between Andalusia and Spain for both sexes and most age groups.
FundingThis study has not been presented at any meeting or congress and has received no public or private funding.
Conflicts of interestThe authors have no conflicts of interest to declare.
Please cite this article as: Cayuela A, Cayuela L, Rodríguez-Domínguez S, González A, Moniche F. Análisis de las tendencias en la mortalidad por enfermedades cerebrovasculares en Andalucía (1980–2014). Neurología. 2019;34:309–317.
