


To determine the correlation between muscle mass, measured using bioelectrical impedance analysis (BIA), with calf circumference and grip strength.
Materials and methodsCross-sectional and observational study. Including all functional adults over 60 years of age seen in our Geriatric Clinic during the months of March 2013–February 2014. Measurements of weight, height, BMI, calf circumference, grip strength and muscle mass by BIA were made after the signature of informed consent.
Results105 patients were evaluated, 73 women and 32 men, with a mean age of 76 years (SD±7.3). Muscle mass showed a mild positive correlation with calf circumference: Pearson (r=0.31; p=0.000) and a moderate positive correlation with grip strength: Pearson (r=0.50; p=0.000).
DiscussionMuscle mass by BIA has a positive correlation with calf circumference and grip strength, and is a reliable measure to assess muscle mass and physical performance in older adults in geriatric ambulatory clinics and can be used in the diagnosis of sarcopenia in Mexican patients.
The relation between muscle mass and aging has led scientists to investigate its changes, causes and consequences. Initially, Irwin Rosenberg proposed the term “sarcopenia” in 1989 (from the Greek “sarx” or “meat”+“penia” or “loss”) to describe the decrease of muscle mass related to age.1 Since its definition, authors have demonstrated the absolute loss of muscle mass from the age of 50, with a decrease of 1.1 and 1.9kg per decade for man and women, respectively.2
Epidemiological studies of sarcopenia, with more representative samples from Europe and the U.S., show prevalence figures which range from 10% in adults older than 60 up to 60% in adults older than 80.3,4
In 2010, the European Working Group on Sarcopenia in Older People (EWGSOP)5,6 aided studies by Baumgartner, et al. and Janssen et al. to create diagnostic criteria. They used dual energy X-ray absorptiometry (DEXA) and bioelectrical impedance analysis (BIA) to determine muscular mass.6–8 The EWGSOP's final intended result was an algorithm for sarcopenia that fulfilled the following criteria: low physical performance measured by walking speed (4m course) and/or decreased grip strength, plus a criterion of low muscular mass below the standard deviations, to make a definitive diagnosis.6,9
In Mexico, the public health care system does not have the necessary tools to measure muscular mass. Thus, dynamometry has been widely used to evaluate grip strength and physical performance in older adults.10 Grip strength is a predictive factor of adverse results such as institutionalization or mortality, but is limited in patients with deteriorated cognitive ability, due to the difficulties in its execution or a lack of motivation.11 Anthropometric measures such as calf circumference (CC) have also been sought as a way to measure muscular mass and functionality, based principally on a study by Rolland et al. who demonstrated that older adults with a CC of less than 31cm had a high specificity (91%) in a sarcopenia diagnosis, and were associated with disability in the activities of their daily lives.12
Arango et al. in the Coyoacan cohort, also used a CC less than 31cm to estimate sarcopenia prevalence.13 However, it is important to consider than anthropometrics such as CC are prone to error due to adipose deposits in muscle fibers and loss of skin elasticity in older adults, which can cause an underestimation in sarcopenia's prevalence in persons with obesity.14
Bioelectrical impedance analysis (BIA) is a reproducible method to measure body composition, and has been used to predict muscle mass decreases in older adults. However, there limitations, such as hydration state, inadequate protein ingestion and physical condition. Despite this, BIA could be a useful tool to measure muscular mass in the Mexican population, with a lower cost compared to imaging studies and a decrease in limitations compared to CC and grip strength in patients with obesity, depression or cognitive deterioration, which are common syndromes in the olderly.15–17
The objective of this study is to determine the relation between muscular mass measured by BIA and CC and grip strength in the older adult population of Northeastern Mexico.
Material and methodDesignThis was a transversal study in Monterrey, Nuevo León between March 2013 and February 2014 in the ambulatory population of older adults that came to the Geriatric Services at the “Dr. José Eleuterio González” University Hospital of the Autonomous University of Nuevo León for their first consultation.
PopulationA non-probabilistic sample was used for this study, included all patients which came for a consultation during the study's time period. The total sample size of those who came to their consultation between March 2013 and February 2014 was 283.
Out of these 283 patients, we selected 105 that met the inclusion criteria, which were: independet in their basic daily living activities, with Katz index ≥5. We excluded any patient with an articular prosthesis or osteosynthesis, use of pacemakers, hormone replacement therapy with androgens, growth hormone or steroid use in the past year and other chronic or acute severe comorbidity that cause cachexia (or secondary sarcopenia) due to the catabolic disease process itself, such as NYHAIII heart failure, chronic obstructive pulmonary disease GOLD C or D, chronic liver disease CHILD B or C and/or stage 5 chronic kidney disease (Terminal disease).
The study was approved by the Ethics and Research Committee of the “Dr. José Eleuterio González”, University Hospital with the code number GE12-001.
InstrumentsA routine clinical service case history, including relevant pathological history and clinimetry, composed of scales of function and cognitive status, was performed.
To evaluate the functionality, we used the Basic Activity of Daily Living Index, developed by Katz et al.18 and Lawton-Brody's of Instrumental Activities of Daily Life Index.19 To evaluate cognitive state, we applied the Mini-Mental State Examination (MMSE) developed by Folstein et al.20 and the Geriatric Scale of Depression (GDS) by Yesavage et al.21 was used to evaluate state of mind. The anthropometry was registered using weight, height, body mass index (BMI) and calf circumference (CC).
Grip strength of the dominant hand was determined with a Takei A5401 digital dynamometer (Medical Systems Plus Industry and Commerce Marketing Co. Ltd., Besiktas Istanbul, Turkey). This measurement was performed three times, with an interval of one minute between each measurement, and we used the average of the three results.
Body weight (kg) and height (cm) were measured using a scale with a stadiometer precision of 810–260mm±0.1 cm (Holtain Ltd. Crosswell, Crymych Dyfed, UK) and CC was measured using a Rosscraft metallic measuring tape, with the patient lying down and their right leg flexed, with the measurement being performed at the biggest point of the calf.
The tetrapole bioimpedometer (BIA Quantum IV Body Composition Analyzer, RJL systems) evaluates the body tissue's resistance to an electric current. The analysis was performed with the patient lying down, with four attached electrodes, two on the back of the wrist and two on the right ankle. The results are presented as resistance and reactance in ohms, to later be used in one of the valid muscle mass (MM) estimation equations. We used a formula developed by Janssen et al.7
Muscle mass (kg)=[(height2/R×0.401)+(3825×gender)+(age×−0.071)]+5.102.
Height=cm, R=resistance in ohms measured by the BIA. Gender=male: 0, female: 1.
Statistical analysisDescriptive statistics were performed and expressed as mean and standard deviation (SD) for all variables and means of analysis were compared between both genders. The normality of the variables was analyzed using the Kolmogorov–Smirnov test. A Pearson correlation coefficient analysis was performed to calculate the association of quantitative variables. The values of p=0.05 or less was considered statistically significant. All analyzes were performed using SPSS for Windows (SPSS Inc., Chicago, IL, version 20.0).
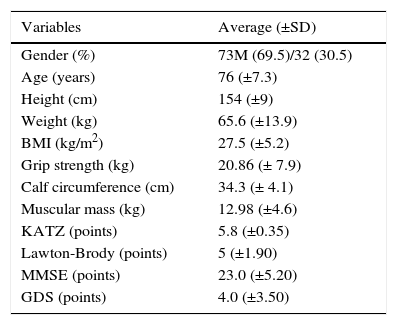
ResultsThese results are from the total sample of 105 patients, 73 women (69.5%) and 32 men (30.5%) who had an average age of 76 (±7.3) years.
Overall means of instruments, clinimetric evaluations and anthropometric characteristics such as the Katz Index, Lawton-Brody, MMSE, GDS, weight, height, BMI, calf circumference, grip strength and muscle mass are described in Table 1.
Clinimetric and anthropometric characteristics.
| Variables | Average (±SD) |
|---|---|
| Gender (%) | 73M (69.5)/32 (30.5) |
| Age (years) | 76 (±7.3) |
| Height (cm) | 154 (±9) |
| Weight (kg) | 65.6 (±13.9) |
| BMI (kg/m2) | 27.5 (±5.2) |
| Grip strength (kg) | 20.86 (± 7.9) |
| Calf circumference (cm) | 34.3 (± 4.1) |
| Muscular mass (kg) | 12.98 (±4.6) |
| KATZ (points) | 5.8 (±0.35) |
| Lawton-Brody (points) | 5 (±1.90) |
| MMSE (points) | 23.0 (±5.20) |
| GDS (points) | 4.0 (±3.50) |
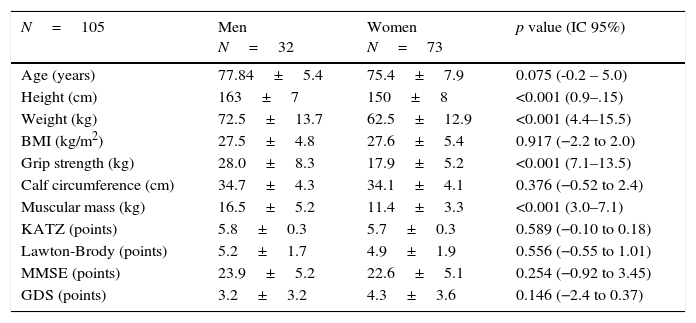
In the analysis by gender, men had higher values, showing statistically significant differences in mean muscle mass and grip strength, which was expected due to their larger size and weight, but there were no significant differences in calf circumference, showing the low sensitivity of the calf muscle as a biomarker of sarcopenia (Table 2).
Clinical characteristics by gender.
| N=105 | Men N=32 | Women N=73 | p value (IC 95%) |
|---|---|---|---|
| Age (years) | 77.84±5.4 | 75.4±7.9 | 0.075 (-0.2 – 5.0) |
| Height (cm) | 163±7 | 150±8 | <0.001 (0.9–.15) |
| Weight (kg) | 72.5±13.7 | 62.5±12.9 | <0.001 (4.4–15.5) |
| BMI (kg/m2) | 27.5±4.8 | 27.6±5.4 | 0.917 (−2.2 to 2.0) |
| Grip strength (kg) | 28.0±8.3 | 17.9±5.2 | <0.001 (7.1–13.5) |
| Calf circumference (cm) | 34.7±4.3 | 34.1±4.1 | 0.376 (−0.52 to 2.4) |
| Muscular mass (kg) | 16.5±5.2 | 11.4±3.3 | <0.001 (3.0–7.1) |
| KATZ (points) | 5.8±0.3 | 5.7±0.3 | 0.589 (−0.10 to 0.18) |
| Lawton-Brody (points) | 5.2±1.7 | 4.9±1.9 | 0.556 (−0.55 to 1.01) |
| MMSE (points) | 23.9±5.2 | 22.6±5.1 | 0.254 (−0.92 to 3.45) |
| GDS (points) | 3.2±3.2 | 4.3±3.6 | 0.146 (−2.4 to 0.37) |
Finally, a slight positive correlation was found between muscle mass by BIA and calf circumference (p=<0.001 is=0.31), as well as a moderate positive association between muscle mass and grip strength (r=0.50, p=<0.001) and calf circumference and grip strength (r=0.28, p=<0.001) (Figs. 1–3).


The results of this study show that there is a positive correlation between muscle mass and calf circumference and grip strength; this association had not been previously confirmed in Mexico. The comparative analysis by gender shows that there are significant differences in muscle mass by BIA between the genders, which is expected, but the calf circumference showed no statistically significant difference between women and men, suggesting a limitation with this form of measurement in discriminating between muscle mass, water, fat and bone, like all anthropometric measurements.22 This is consistent with a study by Rolland, et al. which showed that a calf circumference lower than 31cm had high specificity but low sensitivity 44% in the prediction of sarcopenia, limiting its use in diagnosing sarcopenia.12
BIA has been studied for over 10 years and has a high positive correlation (r=0.095) with MRI, which is considered the gold standard for measuring muscular mass.16 Our study supports the use of BIA to measure muscle mass with greater reliability than calf circumference and also as a tool to indirectly measure patients’ physical performance due to the positive association with grip strength. There are studies which show that the lower grip strength increases the relative risk of disability in activities involved with daily living to 2.0 (95% CI 1.14–3.17). These have also shown an association with sarcopenia, with a risk increase of 4.8 (95% CI 1.4–16.8).9,23The measurement of muscle mass by BIA is particularly relevant in patients with depression and/or cognitive impairment that cannot carry out other measures of force or physical performance properly.
The limitation of this study was the small and unrepresentative sample size we used to generalize the findings for all older adults in Northeastern Mexico. We need more studies to examine the reliability of these tools to measure muscle mass in the elderly.
Ethical normsThis study was approved by the Ethics and Research Committee of the “Dr. José Eleuterio González” Hospital Univeristario de la Universidad Autonoma de Nuevo Leon, with the code number GE12-001.
FundingProperty of the Geriatric Service of the “Dr. José Eleuterio González” Hospital Univeristario de la Universidad Autonoma de Nuevo Leon.
Conflict of interestThe authors have no conflicts of interest to declare.
To Luis Miranda Plata and Carlos Beltrán García, social service medical interns at the Geriatric Service of the “Dr. José Eleuterio González” Hospital Univeristario de la Universidad Autonoma de Nuevo Leon.