


An alarming rise of obesity in adolescents has been observed, placing them at risk of developing resistance to insulin (IR) and its adverse metabolic consequences such as diabetes mellitus type 2 (DM2), metabolic syndrome and cardiovascular disease.
ObjectiveTo know the prevalence of obesity, and the levels of glucose, insulin and HOMA-IR and its association with the BMIz, waist circumference and the pubertal stage in a random sample of adolescents.
Materials and methods292 adolescents between 12 and 15 years (152 female and 140 male), whose anthropometric measurements (weight, height and waist circumference) were taken, body mass index calculated and Z-score determined. Blood glucose and insulin levels were evaluated from a sample of blood and their HOMA-IR was determined.
ResultsThe results showed that 32.5% were obese, 22.3% were overweight and 23.6% showed adolescent central obesity. Glucose levels (p=0.016), insulin (p=0.0001) and HOMA-IR (p=0.0001) showed significant differences in the group with obesity. Values of the three parameters were increased with the stage of puberty. We found significant differences in the levels of glucose (p=0.0388), insulin (p=0.0005) and HOMA-IR (p=0.0001) between the prepubertal and postpubertal stages.
ConclusionThe results showed that the presence of central obesity, overweightness and obesity are closely associated with the prevalence of IR, and may be significant predictors of DM2.
Obesity in children and adolescents is an international health problem. The relationship between it and the development of metabolic alterations like insulin resistance (IR), Diabetes Mellitus type 2 (DM2), dyslipidemias and cardiovascular diseases (CVD) is well known. In the IR stage, a compensating increase of insulin is produced, with the objective of maintaining the homeostasis of glucose (GL). This stage of chronic hyperinsulinemia, in the long term, leads to the development of DM2, metabolic syndrome (MS) and CVD.1–6 Obesity with an excess of adipose tissue, mainly visceral, creates a determining factor in the establishment of IR, since this tissue, in addition to fulfilling its duties of energetic storage, exercises other activities involved in homeostatic maintenance. The visceral adipose tissue presents a greater amount of adrenergic beta receptors than the subcutaneous tissue, significantly favoring the lipolytic activity in this zone of the adipose tissue, generating a larger output of free fatty acids toward the portal circulation and liver, contributing to the establishment of insulin resistance in hepatic, muscular and pancreatic tissue. Additionally, the adipose tissue produces pro-inflammatory cytokines such as adipokines, among which are interleukin-6 (IL-6) and tumor necrosis factor alpha (TNF-α) which blocks the cascade of insulin signaling (INS). IL-6 and TNF-α promote lipolysis in adipose tissue, favoring portal circulation which floods the liver and other tissues with more free fatty acids, which contributes to RI.7–10 INS sensitivity varies in the different stages from childhood to adolescence. In children and adolescents, RI is the key element in MS associated with obesity, and it is usually present for many years before the onset of abnormalities like GL intolerance, dyslipidemia, hypertension, DM2 and CVD.11–13 In Mexico, according to the National Survey of Health and Nutrition 2012 (ENSANUT by its Spanish acronym), the combined prevalence of overweightness and obesity in adolescents between 12 and 19 years of age is 35%, 35.8% (3 175 711) for females and 34.1% (3148146) for males.14 The HOMA index (Homeostatic Model Assessment), built by Matthews (HOMA-IR), is the most utilized method to determine IR.15–19 Nationally and internationally, there is no consensus related to the average values of INS and HOMA-IR in children and healthy adolescents, thus causing researchers to establish non-uniform criteria and take previously conducted studies in different populations as a reference. INS levels in eutrophic children and adolescents have been reported by Viso et al. (2004) to be 5.47±2.46μUI/mL.20 Morales et al. (2007) reported 6.15±1.97μUI/mL,21 Souki-Rincón et al. reported 13.0±0.5μUI/mL22 and Marcos-Daccarett et al. reported 7.0±3.9μUI/mL.23 Goran and Gower, after insulinemia measurement studies in the pubertal stage, established some cut points. They determined for the prepubertal stage (Tanner 1 stage) insulinemia values ≥15μUI/mL, for middle prepubertal (Tanner 2–4 stage) values ≥30μUI/m, and postpubertal (Tanner 4–5 stage) values of ≥ a 20μUI/mL.24 Other researchers determined their own cut levels for their respective areas of study, estimating tables with percentiles. However, the lack of these tables in an important group of countries for pediatric ages prevents uniform criteria from being established.11,25 The same situation occurs for the cut point in IR diagnosis. In 2005 Kinski et al. reported HOMA-IR >3.16 and Hirschler et al. reported it as >3.29.26,27 Anthropometry is used in order to evaluate the degree of obesity, like the body mass index (BMI) calculating its Z score (BMIz) and the measurement of the circumference of the waist (CW).3,28–30 Therefore, the objective of the present investigation was to know the prevalence of OW, OB and COB, GL and INS levels, HOMA-IR and its connection to BMIz, CW and the pubertal stage in adolescents between 12 and 15 years of age in Saltillo, Coahuila, Mexico.
Materials and methodsThe present investigation is descriptive/transversal. A total of 292 adolescents were randomly analyzed between 2012 and 2013 from 5 public junior high schools of Saltillo, Coahuila, Mexico, with ages ranging between 12 and 15, who participated voluntarily with an informed consent signed by their parents or tutors. Adolescents who suffered from any sort of systemic or endocrinological chronic disease were excluded because they could alter the analytic results. Physical and anthropometric exams were performed in order to determine their nutritional stage and pubertal stage, according to Marshall and Tanner.31,32 Regarding anthropometric measurements, size was measured using the stadimeter (206 SECA BODYMETER, SECA AYN. Germany) in a standing position, with their backs toward the front, barefoot, and the measurement was registered in centimeters. The measurement of weight was performed using a digital scale with a capacity of 150kg (Tanita TFB 300, Tanita Corporation, Arlington Heights, IL, 60005, USA) with the minimum amount of clothing on, without shoes, registered in kilograms and grams. The circumference of the waist was performed with an anthropometric flexible, inextensible tape (Lufkin W606PM Lufkin, USA), with the adolescent in a standing position, arms relaxed on the side of the body, measurement in the middle point between the costal edge and the iliac crest, breathing out, and considering the cutoff point >90 percentile for central obesity.33 Moreover, BMI was calculated using the formula weight/height2 and the Z score was evaluated (BMIz) in order to classify their nutritional state using the charts of the WHO. The Z score is expressed in units of standard deviation (SD); a Z score between −2 and −3 SD corresponds to severe low weight, between −1 and −2 SD corresponds to low weight, between +1 and −1 SD corresponds to normal weight, between +1 and +1 SD corresponds to overweight, between +2 and +3 SD corresponds to obesity and greater than +3 SD corresponds to morbid obesity.34 Blood was obtained via venous puncture with a previous fasting of at least 12h. The samples were centrifuged at 35000rpm for 15min in refrigerated centrifuge at 6°C (Thermo Scientific SL, 16R, USA); the serum was conserved at 4°C up to the moment of processing of the GL on the same day as extraction. An aliquot was preserved at −21°C for two days to perform the INS analysis. The determination of the GL was conducted in automatized “Diconex” equipment InCCA (Intelligent Clinical Chemistry Analyzer) (Diconex, USA) through the enzymatic method (conversion to gluconate-6-phosphate by hexokinase and glucose-6-phosphate-dehydrogenase in presence of ATP and NAD) with Human reactives.
INS analysis was made with the automated equipment TOSOH AIA-600 (Tokyo, Japan) by an IFALS (Immunofluorescence assay with labeled substrate) immunoassay with TOSOH reactives. We used high- and low-level commercial-grade controls (Human brand) in both tests. The index of the homeostatic model was calculated with the Matthews formula: HOMA=[Glucose (mmol/L)×Insulin (μU/mL)/22.5]. We used the FID criteria for the fasting GL cutoff point value ≥100mg/dL,35 and for the fasting INS for the prepubertal state insulinemia values of ≥15μUI/mL, for the middle pubertal ≥30mU/mL and for the postpubertal ≥20mU/mL.24 We considered that the level of RI that predicts a greater rick of DM-2 was HOMA-IR ≥3.16.26 The results were expressed as an average, standard deviation (SD) and the analysis of the variables with the number of cases and a percentage. We compared the average between the groups with the Student's t test; for more than 2 groups and the comparison of multiples groups, we employed the variation analysis (ANOVA, test by Tukey). The results were considered statistically significant with a value of p≤0.05. The predictability of the AUS to evaluate the efficacy of the HOMA-IR index as an indicator of IR was determined by the analysis of the ROCC (Receiver Operating Characteristic Curve) for cutoff values of 3.16. The Minitab 16, GrapPad Prism 5 and SPSS 21 programs were used to make the statistical analysis of the results.
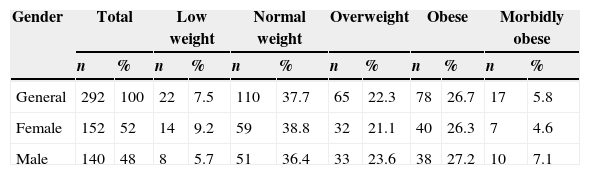
ResultsOut of the 292 analyzed adolescents, 52% were women (152) and 48% were men (140), with a mean age of 13.02±0.94 years, a mean weight of 60.02±15.69kg (27.2–120.3) and a mean size of 158.34±8.03cm (125–179). The prevalence of central obesity (percentile >90) was at 23.6% corresponding to 49.3% for females and 50.7% for males. According to their BMIz, over half of the adolescents presented overweightness and obesity, this abnormality being more predominant in males (Table 1).
Adolescents classified by BMIz in general and by gender Saltillo, Coahuila, Mexico (2012–2013).
| Gender | Total | Low weight | Normal weight | Overweight | Obese | Morbidly obese | ||||||
|---|---|---|---|---|---|---|---|---|---|---|---|---|
| n | % | n | % | n | % | n | % | n | % | n | % | |
| General | 292 | 100 | 22 | 7.5 | 110 | 37.7 | 65 | 22.3 | 78 | 26.7 | 17 | 5.8 |
| Female | 152 | 52 | 14 | 9.2 | 59 | 38.8 | 32 | 21.1 | 40 | 26.3 | 7 | 4.6 |
| Male | 140 | 48 | 8 | 5.7 | 51 | 36.4 | 33 | 23.6 | 38 | 27.2 | 10 | 7.1 |
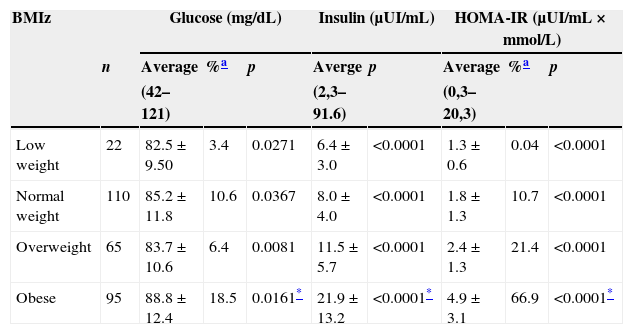
The mean values obtained by the biochemical parameters in our general sample were the following: GL 85.8±11.8mg/dL, the percentage above ≥100 was 11.5%, INS level was 13.2±10.5μUI/mL and the HOMA-IR value was 2.9±2.5 with a 46% over ≥3.16. When analyzing the results by gender, we found that for females, GL was 83.4±11.2mg/dL, INS 13.4±10.2μUI/mL and HOMA-IR 2.9±2.5, while for males, GL was 88.5±11.8mg/dL, INS 12.9±10.8μUI/mL and HOMA-IR 2.9±2.5. We found statistically significant differences between genders for GL (p=0.0002) but not for INS (p=0.6582) and HOMA-IR (p=0.9965). After studying the results of the biochemical parameters concerning BMIz, we noticed that the values increased as BMIz did, presenting the highest values in OB (Table 2). After evaluating HOMA-IR results, we found it notoriously high in OB (p≤0.0001). There were statistically significant differences in GL (p=0.0161), INS (p≤0.0001) and HOMA-IR levels (p≤0.0001) between the different BMIz groups.
Glucose, insulin and HOMA-IR by BMIz Saltillo, Coahuila, Mexico (2012–2013).
| BMIz | Glucose (mg/dL) | Insulin (μUI/mL) | HOMA-IR (μUI/mL×mmol/L) | ||||||
|---|---|---|---|---|---|---|---|---|---|
| n | Average | %a | p | Averge | p | Average | %a | p | |
| (42–121) | (2,3–91.6) | (0,3–20,3) | |||||||
| Low weight | 22 | 82.5±9.50 | 3.4 | 0.0271 | 6.4±3.0 | <0.0001 | 1.3±0.6 | 0.04 | <0.0001 |
| Normal weight | 110 | 85.2±11.8 | 10.6 | 0.0367 | 8.0±4.0 | <0.0001 | 1.8±1.3 | 10.7 | <0.0001 |
| Overweight | 65 | 83.7±10.6 | 6.4 | 0.0081 | 11.5±5.7 | <0.0001 | 2.4±1.3 | 21.4 | <0.0001 |
| Obese | 95 | 88.8±12.4 | 18.5 | 0.0161* | 21.9±13.2 | <0.0001* | 4.9±3.1 | 66.9 | <0.0001* |
After examining the results of three biochemical parameters by gender and BMIz, it was noted that the percentage of the highest values was observed in the OW and OB of both genders. We noticed statistically significant differences between genders with OW regarding GL levels (p=0.0046) and none in INS levels (p=0.3006) or the HOMA-IR value (p=0.1015). Regarding OB, no statistically significant differences between genders were observed for GL (p=0.0551), INS (p=0.3150) and HOMA-IR levels (p=0.6537).
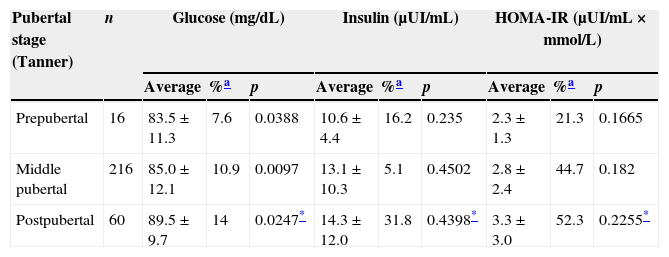
After analyzing the results of the three parameters in relationship with pubertal development, it was observed that the values increased when pubertal development was raised (Table 3). There was a statistically significant difference between the prepubertal and the postpubertal in relationship with GL levels (p=0.0247), but not in INS (p=0.4398) or HOMA-IR (p=0.2255). HOMA-IR values showed that approximately half the studied adolescents (pubertal and postpubertal) presented IR.
Glucose, insulin and HOMA-IR by pubertal stage Saltillo, Coahuila, Mexico (2012–2013).
| Pubertal stage (Tanner) | n | Glucose (mg/dL) | Insulin (μUI/mL) | HOMA-IR (μUI/mL×mmol/L) | ||||||
|---|---|---|---|---|---|---|---|---|---|---|
| Average | %a | p | Average | %a | p | Average | %a | p | ||
| Prepubertal | 16 | 83.5±11.3 | 7.6 | 0.0388 | 10.6±4.4 | 16.2 | 0.235 | 2.3±1.3 | 21.3 | 0.1665 |
| Middle pubertal | 216 | 85.0±12.1 | 10.9 | 0.0097 | 13.1±10.3 | 5.1 | 0.4502 | 2.8±2.4 | 44.7 | 0.182 |
| Postpubertal | 60 | 89.5±9.7 | 14 | 0.0247* | 14.3±12.0 | 31.8 | 0.4398* | 3.3±3.0 | 52.3 | 0.2255* |
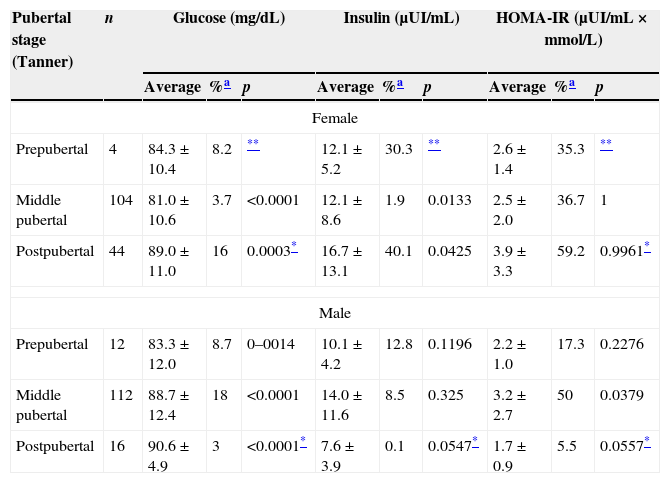
The study of the results of the biochemical parameters regarding pubertal development by gender revealed that the highest values in females occurred in the postpubertal stage, while in males the highest values for INS and HOMA-IR occurred in the pubertal stage and the highest values for GL occurred in the postpubertal stage (Table 4).
Glucose, insulin and HOMA-IR by pubertal stage (Tanner) and gender. Saltillo, Coahuila, Mexico (2012–2013).
| Pubertal stage (Tanner) | n | Glucose (mg/dL) | Insulin (μUI/mL) | HOMA-IR (μUI/mL×mmol/L) | ||||||
|---|---|---|---|---|---|---|---|---|---|---|
| Average | %a | p | Average | %a | p | Average | %a | p | ||
| Female | ||||||||||
| Prepubertal | 4 | 84.3±10.4 | 8.2 | ** | 12.1±5.2 | 30.3 | ** | 2.6±1.4 | 35.3 | ** |
| Middle pubertal | 104 | 81.0±10.6 | 3.7 | <0.0001 | 12.1±8.6 | 1.9 | 0.0133 | 2.5±2.0 | 36.7 | 1 |
| Postpubertal | 44 | 89.0±11.0 | 16 | 0.0003* | 16.7±13.1 | 40.1 | 0.0425 | 3.9±3.3 | 59.2 | 0.9961* |
| Male | ||||||||||
| Prepubertal | 12 | 83.3±12.0 | 8.7 | 0–0014 | 10.1±4.2 | 12.8 | 0.1196 | 2.2±1.0 | 17.3 | 0.2276 |
| Middle pubertal | 112 | 88.7±12.4 | 18 | <0.0001 | 14.0±11.6 | 8.5 | 0.325 | 3.2±2.7 | 50 | 0.0379 |
| Postpubertal | 16 | 90.6±4.9 | 3 | <0.0001* | 7.6±3.9 | 0.1 | 0.0547* | 1.7±0.9 | 5.5 | 0.0557* |
The results of each of the parameters were compared with each pubertal stage by gender; we found that there were no statistically significant differences in the prepubertal stage, while in the pubertal stage there were differences in GL (p≤0.0001) and HOMA-IR (p=0.0408) and differences in INS (p=0.0085) and HOMA-IR (p=0.0101) in the postpubertal stage were also observed.
Mean values obtained from the three biochemical parameters concerning adolescents without COB (76.4%) were GL 84.2±11.4mg/dL, HOMA-IR 2.1±1.5 with 8.5 and 24.2% of values over the cutoff points, respectively, and INS 9.9±6.1μUI/mL. For adolescents with COB (23.6%), GL was 91.1±11.2mg/dL, HOMA-IR 5.4±3.4 with 21.3 and 74.4% of values over the cutoff points, respectively, and INS 23.7±14.2μUI/mL. When the results of the three biochemical parameters of adolescents with and without COB were compared, there were statistically significant differences in all three parameters (p≤0.0001).
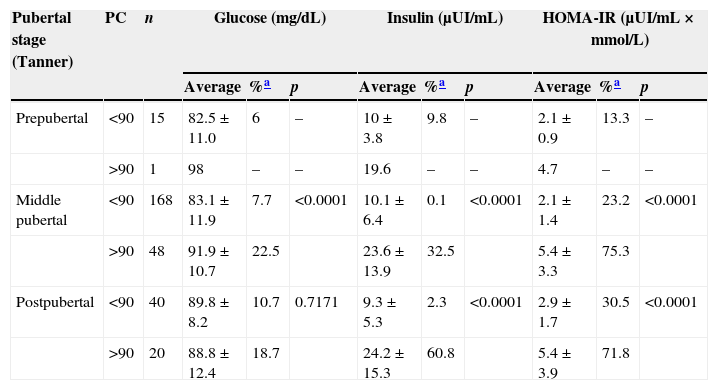
Concerning COB prevalence and pubertal stage, it was reported that 6.7% occurred in the prepubertal stage, 22.2% in the pubertal stage and 33.3% in the postpubertal stage. When the results of the biochemical parameters were associated with pubertal stage and waist circumference, it was noted that in all pubertal stages, the adolescents who displayed COB presented higher values, observing a high IR incidence in pubertal and postpubertal stages (Table 5).
Glucosa, insulin and HOMA by pubertal stage (Tanner) and waist circumference. Saltillo, Coahuila, Mexico (2012–2013).
| Pubertal stage (Tanner) | PC | n | Glucose (mg/dL) | Insulin (μUI/mL) | HOMA-IR (μUI/mL×mmol/L) | ||||||
|---|---|---|---|---|---|---|---|---|---|---|---|
| Average | %a | p | Average | %a | p | Average | %a | p | |||
| Prepubertal | <90 | 15 | 82.5±11.0 | 6 | – | 10±3.8 | 9.8 | – | 2.1±0.9 | 13.3 | – |
| >90 | 1 | 98 | – | – | 19.6 | – | – | 4.7 | – | – | |
| Middle pubertal | <90 | 168 | 83.1±11.9 | 7.7 | <0.0001 | 10.1±6.4 | 0.1 | <0.0001 | 2.1±1.4 | 23.2 | <0.0001 |
| >90 | 48 | 91.9±10.7 | 22.5 | 23.6±13.9 | 32.5 | 5.4±3.3 | 75.3 | ||||
| Postpubertal | <90 | 40 | 89.8±8.2 | 10.7 | 0.7171 | 9.3±5.3 | 2.3 | <0.0001 | 2.9±1.7 | 30.5 | <0.0001 |
| >90 | 20 | 88.8±12.4 | 18.7 | 24.2±15.3 | 60.8 | 5.4±3.9 | 71.8 | ||||
PC: waist percentile.
When performing a comparative study of the results of the biochemical parameters in adolescents with and without COB in each of the pubertal stages, statistically significant differences were found in pubertal stage in GL (p≤0.0001), INS (p≤0.0001)and HOMA-IR (p≤0.0001). There were no significant differences in GL (p=0.7171), INS (p≤0.0001) or HOMA-IR (p≤0.0001) in the postpubertal stage. When comparing the results of adolescents with COB and the pubertal and postpubertal stages there were no significant differences in GL (p=0.3061), INS (p=0.8707) or HOMA-IR (p=0.9734) values.
The result of the sensitivity and specificity analysis revealed the fact that HOMA-IR proved to be a good predictor of IR presence (Fig. 1), which reflects a higher discriminating power in the evaluation of this syndrome.
Discussion
This study showed an elevated prevalence of overweightness (22.3%), obesity (32.5%), central obesity (23.6%) and HOMA-IR (46%). These results were higher than those reported in adolescents in the same age range for overweightness (19%) and obesity (13%) in Chiapas, Mexico,5 and even lower than those reported in adolescents between 10 and 17 years with obesity (49.2%) in Lima, Peru.1 As expected, adolescents with obesity and central obesity showed significantly higher INS and HOMA-IR numbers compared to those adolescents with a normal BMIz.
In this manner, the adolescents without obesity manifested average values for INS (8μUI/mL) and HOMA-IR (1.8), and the adolescents with obesity had averages of INS as 21.9μUI/mL and HOMA-IR 4.9. We would like to point out the fact that adolescents with morbid obesity reached INS levels of 91.6μUI/mL and HOMA-IR values of 20.3, values never before reported in the Mexican population. These findings in adolescents of both genders confirm those reported by other authors in the sense that they observed a positive relationship between IR and the presence of obesity and that it increases progressively in function of the excess of weight.1,5–7,37
Regarding basal GL levels, this increased as BMIz increased. We found that the average levels are greater in males than in females, just as reported by Souki-Rincón et al.22
Similar to other studies previously conducted, we found in ours that INS concentrations are higher in female adolescents than in males.21 In this study, approximately 2 out of every 10 adolescents with overweightness and 7 out of 10 with obesity displayed IR, the male gender being the most affected. A significant correlation between INS concentrations and HOMA-IR was found, which was expected, because HOMA-IR values are derived from INS and GL concentrations. Antropometric measurements, BMIz, and WC are independently associated with GL, INS and HOMA-IR levels. We were able to observe that WC predicted these variables more accurately in comparison to BMIz.
Furthermore, given the fact that INS and HOMA-IR concentrations followed the same distribution, we were able to consider the latter as a meter to be as good as basal INS to establish IR. Keskin et al. showed that HOMA-IR had a high specificity and sensitivity for IR measurement in children and adolescents.36
The prevalence of IR found in the studied population (46%) exceeds that reported by Acosta et al.7 These authors also used HOMA-IR values higher than 3.1 for an IR diagnosis. On the other hand, it was found that approximately half of the adolescents in the postpubertal state (IV and V) displayed higher levels of INS and HOMA-IR. When analyzing pubertal stage by gender, the highest values of chemical parameters were found in females in the postpubertal (IV and V) and males with pubertal stage (II and III). Rojas-Gabulli et al.1 suggested that IR, which results in hyperinsulinemia, according to Arslanian and Kalhan38 is observed between Tanner stages II and IV. These results agree with our results. Also, IR found in the study's adolescents was lower than that reported by Kurtoglu et al.39 in adolescents in the prepubertal (male 37% and female 27.8%) and pubertal stages (male 61.7% and female 66.7%). These differences are based on the fact that these authors utilized different reference values according to gender and sexual maturation stage for their IR diagnosis, using the following HOMA-IR values: for the prepubertal stage the following values were used: male 2.67 and female 2.22, and for the pubertal stage: male 5.22 and female 3.82. Thus, we present the need to continue conducting studies on adolescents, allowing the establishment of normal levels for INS as well as for HOMA-IR. The highest insulin and HOMA-IR values were observed in adolescents with COB. Moreover, the incidence of higher INS and HOMA-IR values were observed in adolescents with COB in the pubertal and postpubertal stages, like other authors.7,39 The evaluation of HOMA-IR's ability to predict an IR diagnosis through the analysis of the ROC curve, indicates that it has a high sensitivity and specificity for this purpose.
The main strengths of this study are the homogeneity of the conditions at which samples were taken, conducting simple non-invasive studies like WC (waist circumference) BMIz, INS, basal GL and HOMA-IR, and HOMA-IR being a high sensitivity and specificity indicator. The limitations of this study are the following: since it is a relatively small demographic sample, it was not necessarily a sample representative of the population of the same age intervals (however, it may serve for comparison of other Mexican adolescents); not having cutoff points in HOMA-IR for Mexican adolescents of different ages and pubertal stages, and not having a balanced representative number for each one of the pubertal maturation stages.
ConclusionThis study shows a high OW, OB and COB incidence. It revealed a positive correlation between the rise in GL, INS and HOMA-IR levels and the rise of BMIz and COB, showing a high IR incidence. Therefore, OW, OB, COB and HOMA-IR can be used as a reference in clinical practice for IR diagnosis and can be significant predictors of DM2. These data highlight the importance of early IR detection in adolescents with OW, OB, and COB, and stress the importance of managing early intervention strategies, which allow the identification of IR risk, for its timely management and prevention of DM2, CVD and MS development.
FundingNo financial support was provided.
Conflict of interestThe authors have no conflicts of interest to declare.
We thank public schools in Saltillo, Coahuila, (Mexico) “Nazario S. Ortiz Garza” Federal Secondary School No. 1, “Margarita Maza de Juárez” Secondary School, “Ismael Rodríguez” Technical Secondary School No. 4, “Ejercito Mexicano” Secondary School No. 16 and “Ricardo Flores Magón” Secondary School No. 11, for their availability and co-operation with this investigation. Special thanks to the authorities, training staff, parents and students who participated in this investigation of public schools.