


Introduction
The use of flow cytometry as a remarkable tool for evaluating complex cell populations that exhibit a variety of biological mechanisms, has led to the development of multiple protocols according to intrinsic characteristics of the cell population studied.1-3 Flow cytometry offers interesting advantages, like the fact that it does not require the use of radiation, the analysis of multiple cell subsets4,5 without the need for separation, and the use of multiple laser and color combinations offering a wide range of possibilities.6
One of the many cell mechanisms that can be analyzed by flow cytometry is cell proliferation. Several setups have been made depending on the proliferative staining marker used.7 One particular proliferation marker is the carboxyfluorescein succinimidyl ester (CFSE).8 In contrast to other proliferative cell markers limitations like detecting limited numbers of cell divisions (bromodeoxyuridine incorporation) or only quantify overall proliferation (tritiated thymidine incorporation) it can be used for in vivo or in vitro protocols,9-11 and for example, lymphocytes stained with CFSE have been detected up to eight weeks after being injected into mice in lymphocyte-migration studies.12 It passively diffuses into cells, and the succinimidyl ester group reacts with intracellular amines, forming fluorescent conjugates that are inherited to daughter cells after each division. The approximate excitation and emission peaks of its products after hydrolysis are 492 nm and 517 nm, respectively.10,11
Another feature to measure in complex population protocols is cell viability, even though discrimination of dead cells in flow cytometry can be achieved by forward scatter and side scatter it is not accurate enough to be considered a routine test.13 The use of viability markers such as 7-aminoactinomycin D is a good choice. Not only can it identify dead cells, but by a flow cytometry assay 7AAD can also identify pre-apoptotic cells.13-15
The identification of different subsets of cells according to their specific surface markers is a standard tool and procedure of flow cytometry analysis. The simultaneous labeling with fluorescent conjugated fluorochrome antibodies against cell surface proteins allows the study of multiple heterogenic populations. However, use of fluorochromes in a multicolor setup involves some issues concerning compensation among them. Depending on their nature, spectral emission overlaps and emission peaks, conjugated antibodies should be wisely chosen for every protocol to avoid the overlapping with fluorochromes with broader excitation curves.4-6,16,17
In this report, we present the optimization and validation of a flow cytometry multi task analysis comprising the identification of heterogenic cell populations, tracking cell proliferation with CFSE and assessing viability with 7-AAD in a FC500 Flow Cytometer.
Methods
Peripheral blood mononuclear cell isolation. Peripheral blood mononuclear cells (PBMCs) were collected from buffy coats of healthy donors from Aarhus University Hospital. Cells were diluted 1:1 with 0.9% NaCl, isolated by density gradient centrifugation using Ficoll-Pacque PLUS (GE Healthcare Bio-Sciences AB, Sweden) according to manufacturer's instructions, and centrifuged at 2000 rpm for 25 min at 20 ÅãC. Mononuclear cells were collected from the interphase into PBS pH 7.4 with 0.5% bovine serum albumine (BSA) and washed again at 1200 rpm, 10 min at 20°C. Cells were counted using both methyl violet and trypane blue exclusion and resuspended in culture media RPMI 1640 with NaHCO3. They were supplemented with 20% fetal calf serum (FCS) (Gibco, Paisley, UK), 2 mm L-glutamine, 100 U/ml penicillin, and 100 μg/ml streptomycin) and 10% dimethyl sulfoxide (Sigma Aldrich, St. Louis, MO) and stored at -134°C.
In vitro cell stimulation to assess cell proliferation with CFSE. Flat bottom 96 well plates were coated with anti-CD3 and anti-CD28, both at a concentration of 2 μg/ ml in 4 ml of PBS + BSA. Plates were incubated overnight at 4°C before use.
CFSE Staining. PBMNCs were thawed at 37°C - 40°C and re-suspended in phosphate-buffered saline (PBS) with 20% FCS and centrifuged at 1200 rpm for 10 min at 20°C. Cells were counted using trypan blue exclusion test and either left unstained as a control or stained with CFSE (Cell-Trace CFSE Proliferation Kit, Molecular Probes, Invitrogen technologies) to a final 2.5 μM concentration with PBS, and immediately incubated for 10 minutes. Staining was stopped by washing the cells with ice cold RPMI + 0.1% FCS solution and incubated in ice for 5 minutes. Cells then were washed twice in RPMI-1640 culture media with 10% FCS and adjusted to a concentration of 2 million per mL. After that, cells were placed in the previously coated 96 well tray at 250 000 cells per well.
Phenotypic immunostaining and 7AAD staining. Cells were harvested at various timepoints, washed once with PBS containing 0.5% BSA and 0.09% NaN3 (PBS/BSA/Az) and centrifuged at 1200 rpm for 5 min at room temperature. Pellets were re-suspended and then stained with ECD conjugated anti-CD3 and phycoerythrin-cyanine 7 (PC7) conjugated CD4 or CD56 antibodies, then incubated for 15 min in the dark. Cells were washed twice with PBS/BSA/Az. Samples included in the viability assay were incubated for 10 min before analysis with 20 μL 7-AAD (Beckton Dickinson) . Prior flowcytometric analysis, 400 μl PBS/BSA/Az was added. Cells were analysed within 1 hour of adding 7-AAD using either a FC500 flow cytometer (Beckman Coulter) or a FACSCanto flow cytometer (Beckton Dickinson). For each sample at least 250 000 cells were collected, and 10 000 signals analyzed. Compensation beads for the fluorochromes were run in each analysis as well as Flow set beads for internal control of the cytometer readings.
Before surface staining, PBMNCs in co-culture were re-suspended and washed in PBS/BSA/Az buffer (PBS with 0.5% bovine serum albumin and 0.1% of NaN3). Cells were prepared for four color flow cytometry protocols using the following antibodies: anti-CD56 PC7 (clone N901, Beckman Coulter), anti-CD3 ECD (clone UCHT1, Beckman Coulter), anti-CD45 FITC/anti-CD14RPE (clone T29/33 and TUK4, DAKO), anti-CD19 APC (clone HD37, DAKO), anti-CD163 FITC (Clone Mac2-158, Trillium Diagnostics), anti-CD45APC (clone HL100, Beckton Dickinson), anti-CD14 PC7 (Clone KMO52, Beckman Coulter), anti-CD14 APC (Clone M5E2 Beckton Dickinson). Intracellular staining was performed as follows.
Thereafter, PBMNCs were prepared for three or four color flow cytometry protocols. After 15 min of incubation, the cells were washed in PBS/BSA/Az buffer and incubated for 10 minute in 2mL 1xBD FACS Lysing Solution (BD Biosciences). Once washed in PBS/BSA/Az buffer, the samples were added to 0.5ml 1X FACS permeabilizing solution 2 (BD Biosciences). Subsequently, the samples were stained with 20μL anti-IL12 (p40/p70, BD Pharmingen, Clone C11.5). Generally, monocytes were defined as CD45+/CD14+ leukocytes. All samples were analyzed on a FC500 flow cytometer (Beckman Coulter). FlowJo software version 8.8.4.
Results
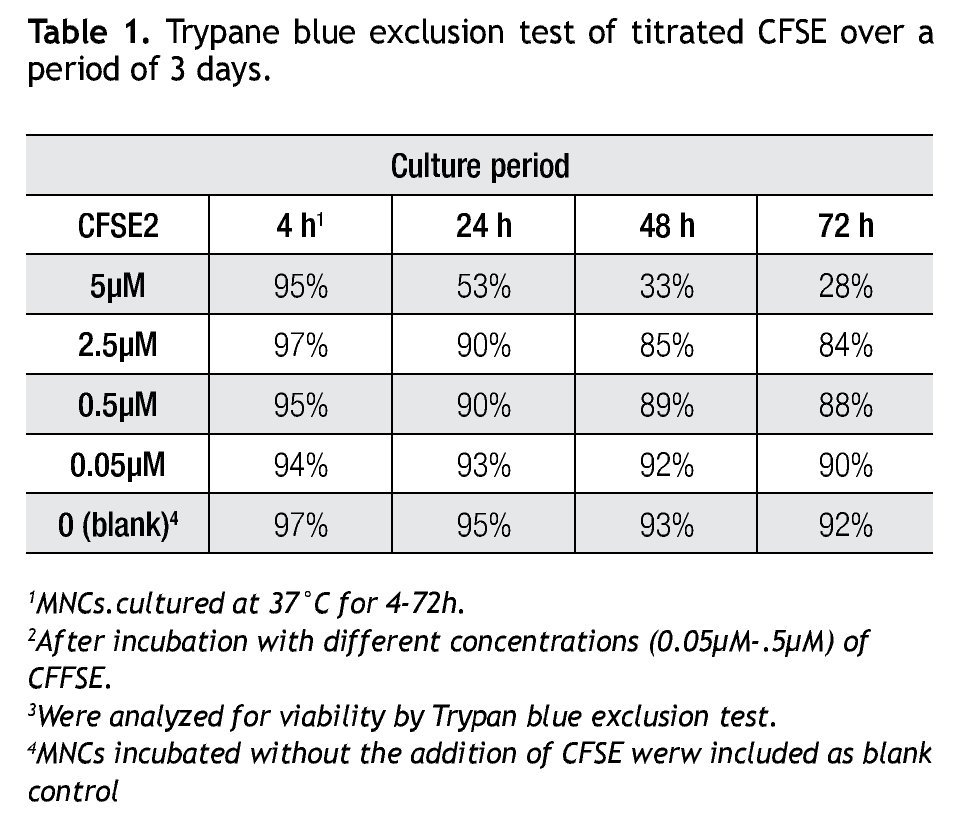
A CFSE protocol designed for the 488 nm blue Argon laser of a Beckman Coulter FC500 flow cytometer was developed to further study the proliferation on immune cell subsets (i.e. monocytes, lymphocytes, including NK cells) in complex cell samples. Since CFSE fluorescence intensity is correlated directly with toxicity, its intensity was assessed with a single staining protocol with CFSE on non-stimulated cells to determine the optimal concentration. Afterwards we followed incubation of MNCs with different concentrations of CFSE (0.05 μM, 0.5 μM, 2.5 μM and 5 μM) for up to 72 h and analyzed for viability using Trypan Blue exclusion test (Table 1). Not unexpected, a clear correlation is seen between the concentration of CFSE, its median fluorescense intensity (MFI) and viability.

Assessing cell proliferation using CFSE. After choosing the optimal concentration of CFSE with respect to fluorescence intensity and toxicity for our experiments, the next step was to verify efficiency in tracking cell proliferation in our samples. For this purpose, we used a standardized in vitro model for cell proliferation, i. e. activation of T cells through anti-CD3/antiCD28 stimulation. Thus, we stained MNCS with CFSE (2.5 μM) and incubated these cells in anti-CD3/anti-CD28 coated wells at 37°C, 5% CO2. At different time points after starting incubation, lymphocytes were analyzed for fluorescence intensity of CFSE by flow cytometry using the FS/SS gating strategy previously described. Figure 1 shows clearly visible peaks representing cell divisions from days three to five, and the difference of the percentages of dividing- and non-dividing populations. From day two until day five the fraction of dividing cells increased from 17.1% to approximately 86% of the total lymphocyte population.
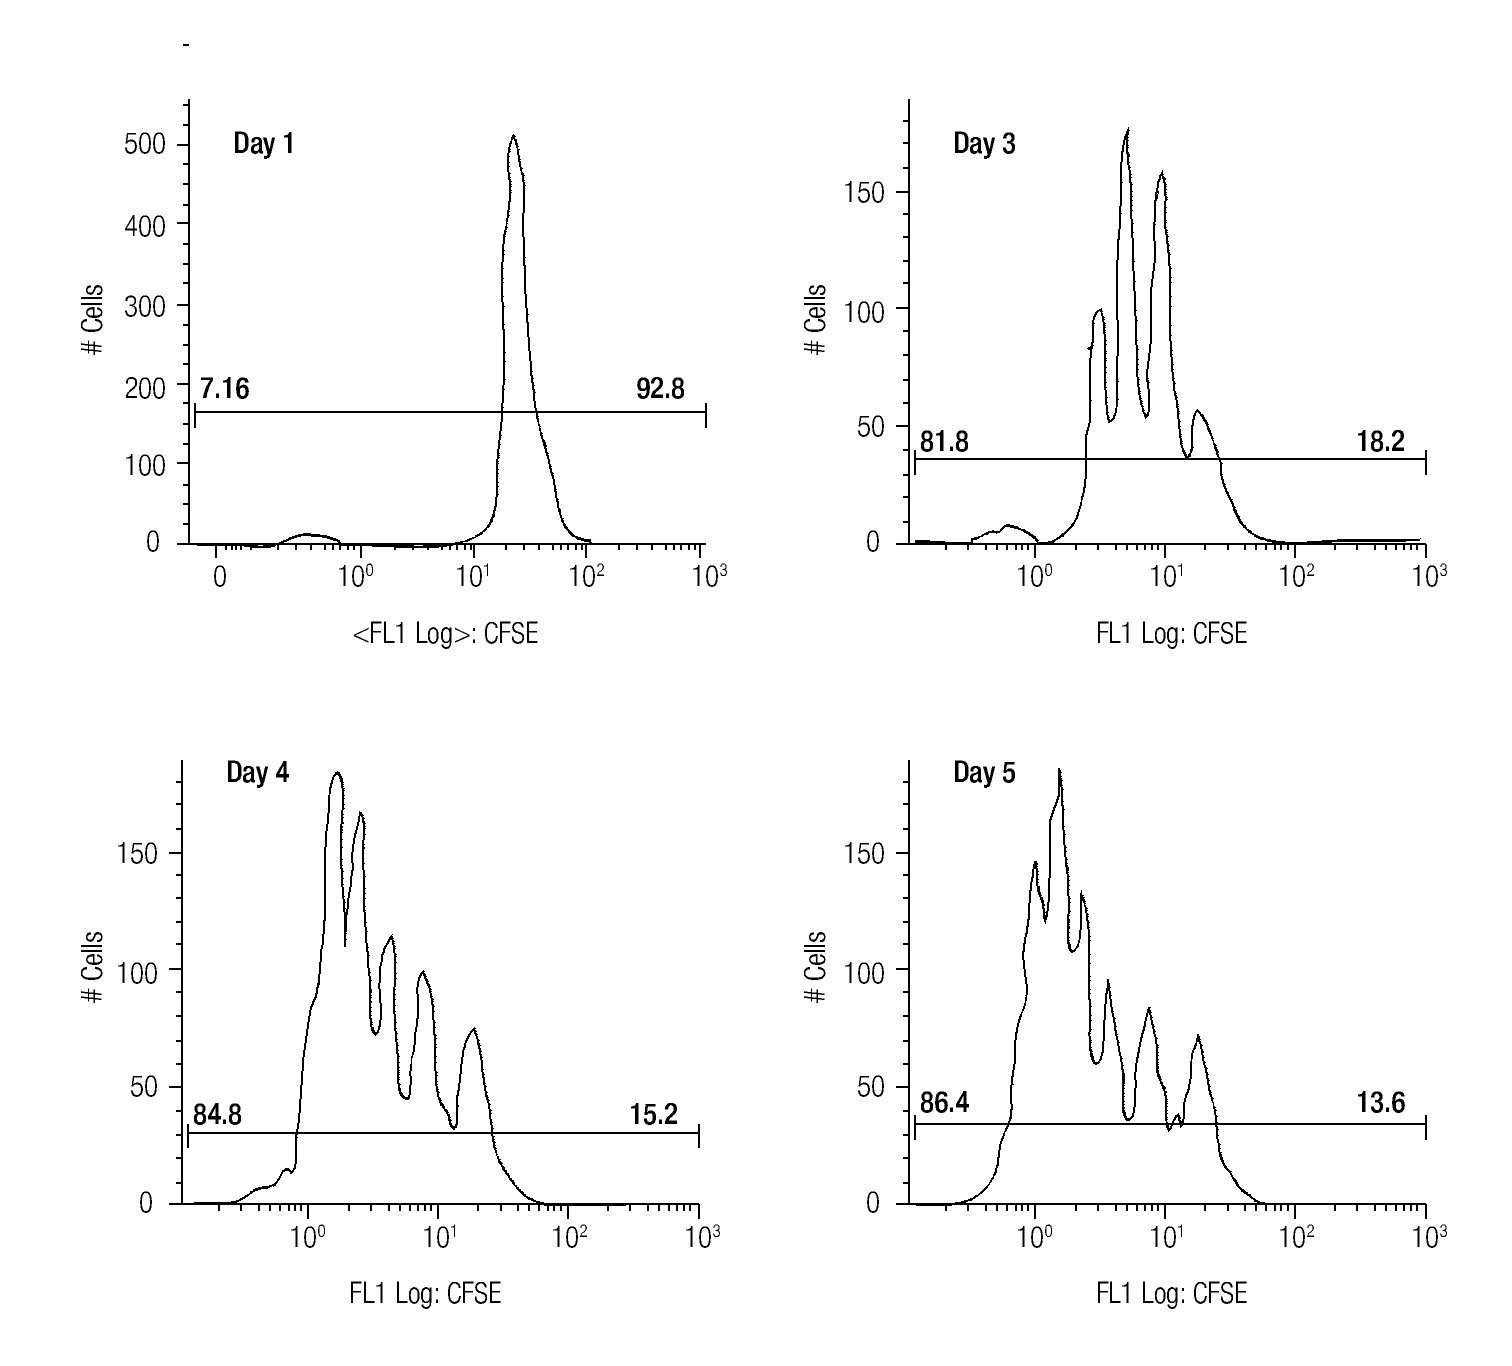
Figure 1. The histograms show the fluorescense intensity of anti-CD3/anti-CD28 stimulated MNCs stained with 2.5μM CFSE followed for up to 5 days to check the amount of proliferating (the T cell subset) and non-proliferating (the NK- and B cells).
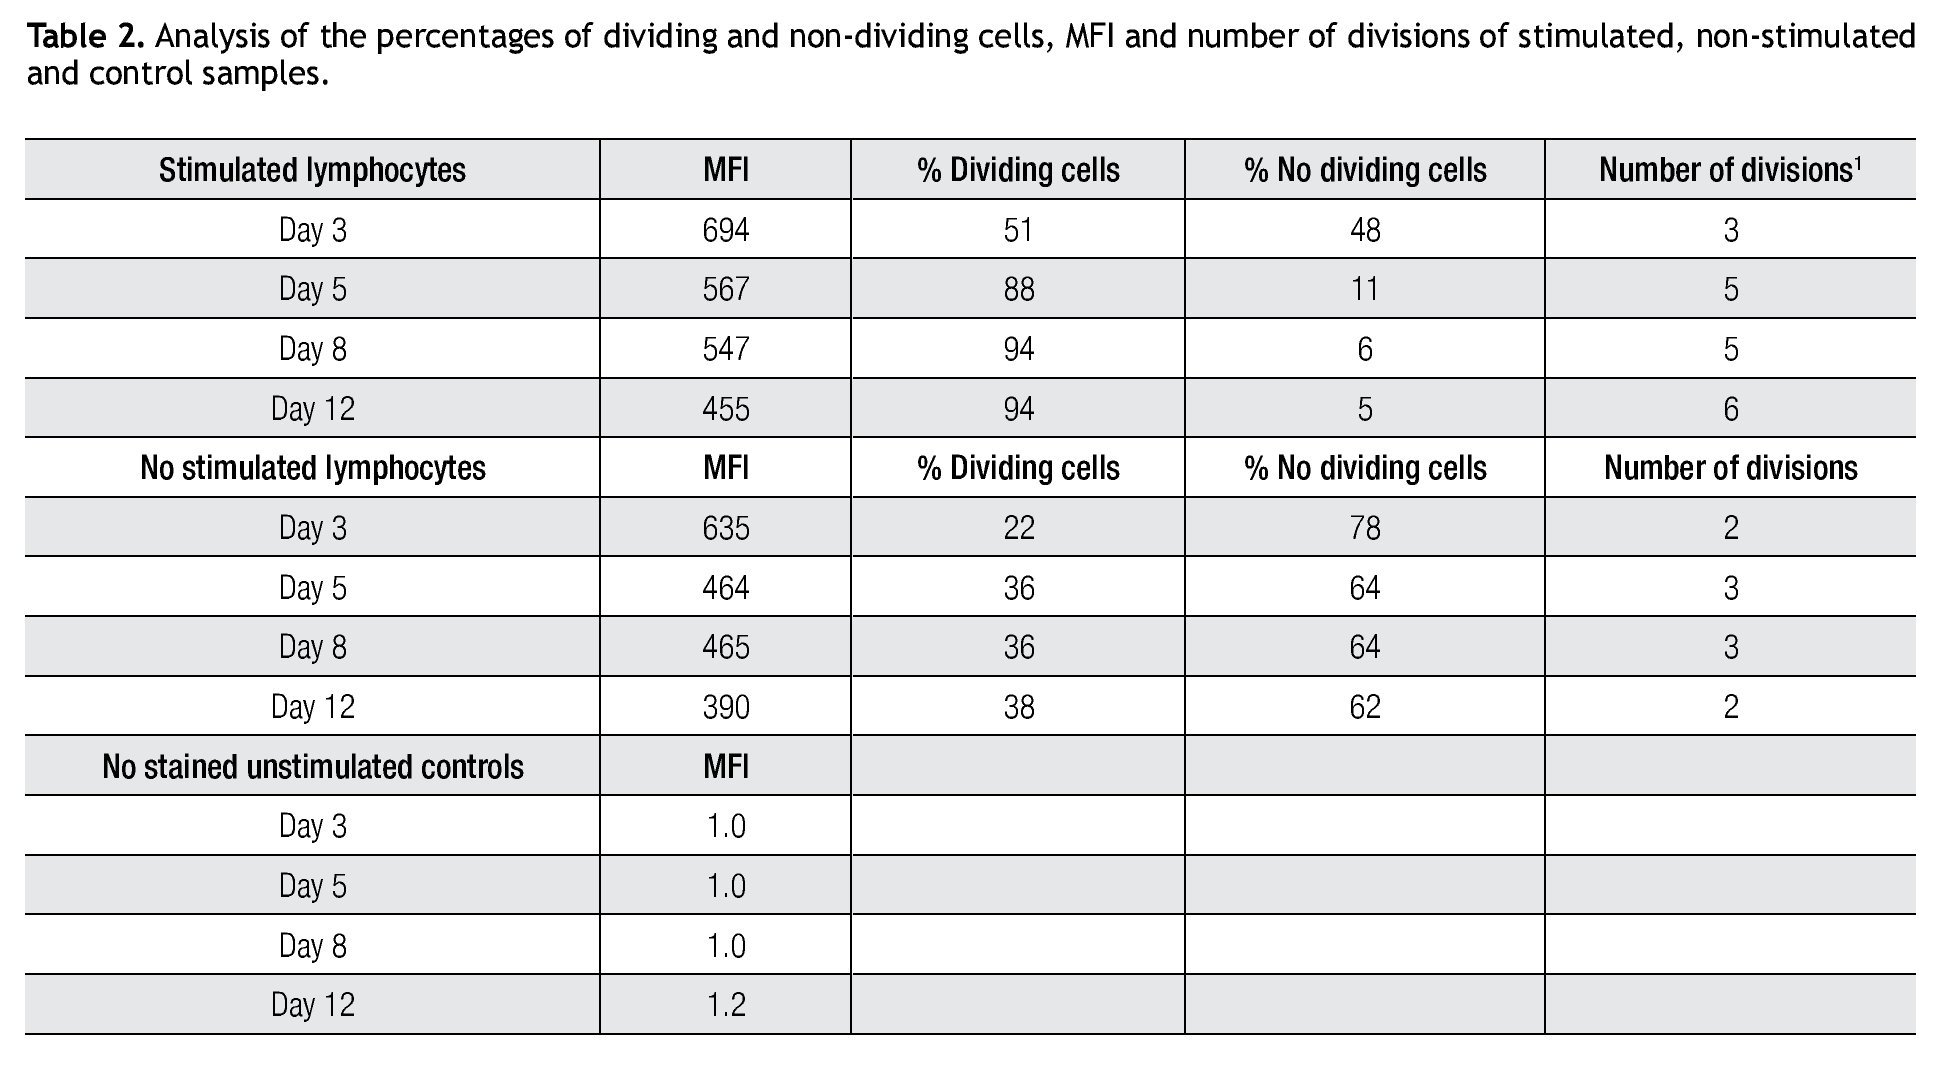
Validating CFSE as a proliferation marker for longtime cell cultures. The next step was to validate the staining intensity, percentages of dividing cells and number of divisions that could be achieved on a longer period of time and with appropriate controls. Following the previously described gating procedures and experimental setups, cells were followed in cell cultures for up to 18 days. As controls, unlabeled cells (to set background labeling) and stained- non-dividing cells (to compare MFI and assess staining stability) were included. Table 2 shows the results of the follow up for 4 representative time points. MFI values from both stimulated and non stimulated cells gradually decreased after day 5 in all stained samples, also noticeable is the fact that percentages of non-stimulated stained cells remained fairly constant over time from 51% on day 3 to 46% on day 12.

Tracking specific subsets of dividing and no dividing cell populations with CFSE. One important characteristic for this staining procedure will be the ability to track heterogeneous cell populations that may have different division rates. For this purpose we decided to check from a single donor sample, NK, NKT and T cells. Only T cells (expressing the CD3 complex) respond to CD3/CD28 stimulation while NK cells, defined as CD56+ and CD3-, do not respond to the anti-CD3 signaling. Figure 2 shows dot-plots at two different time points (day 5 and day 8 of the representative T and NK cell populations). The NK cell population decreased significantly over time, during which the population below increased, this clearly shows the change of location from viable to dead cells to the lower left corner of the dot-plot on day 8. So adding a viability marker such as 7-AAD to identify dead or apoptotic cells is crucial i.e. was the subsequent step in the process, alongside using other surface markers.
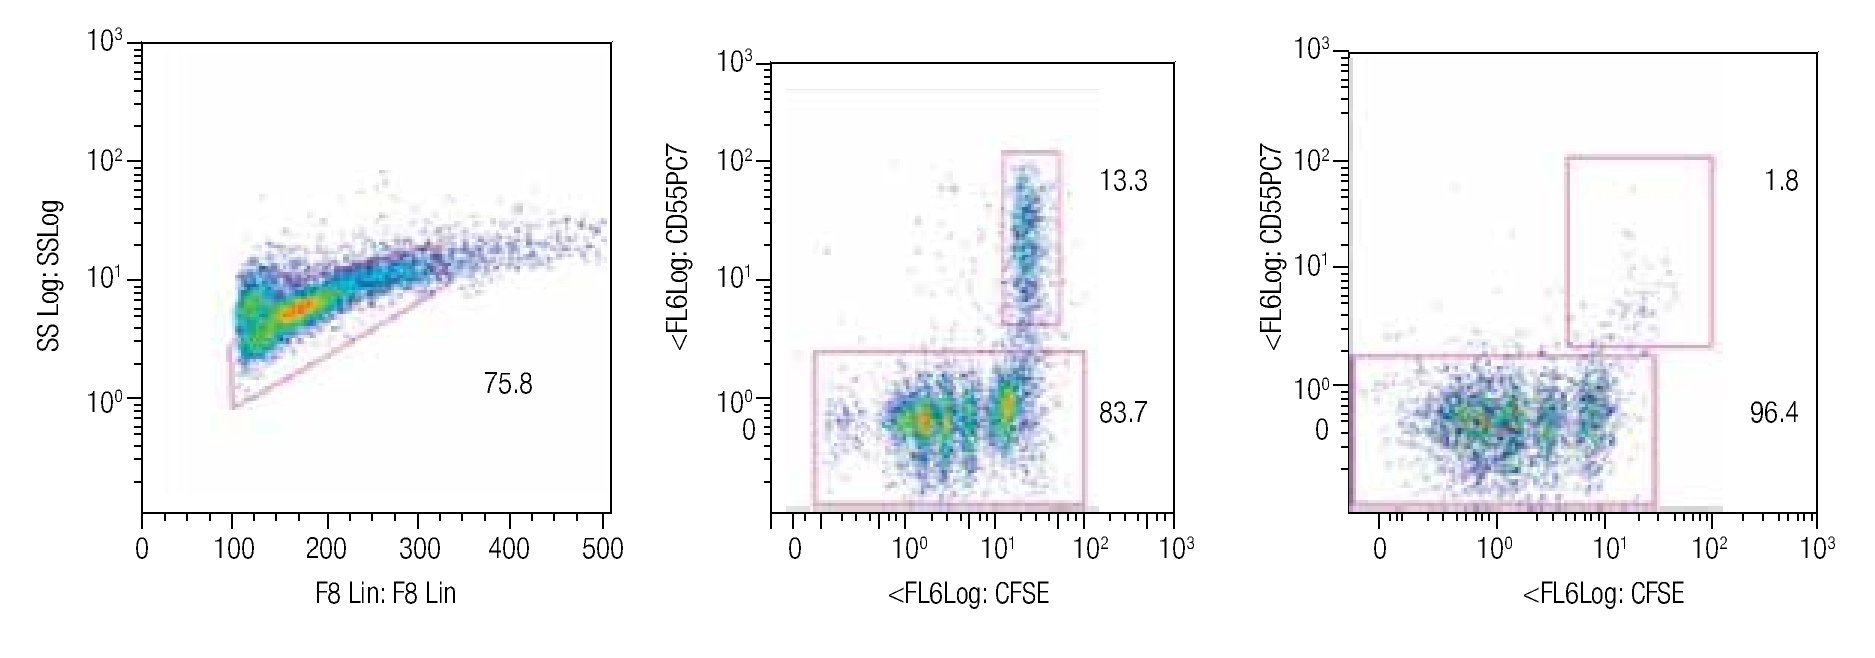
Figure 2. Single patient sample showing the strength of the CFSE staining method in which at days 5 (center dot-plot) and 8 (right dot-plot), a stimulated T cell (CD56-) cell population gated on mononuclear cells can be seen dividing and a non-stimulated NK cell subset (identified as CD56+/CD3-) can be tracked in the same tube. The experiment is an example of 4 repeats.
Designing a multicolor flow cytometric protocol comprising proliferation (CFSE) viability (7AAD) and two phenotypic markers for the FC500 flow cytometer. Figure 3 shows the basic laser and filter equipment of the FC500 flow cytometer.
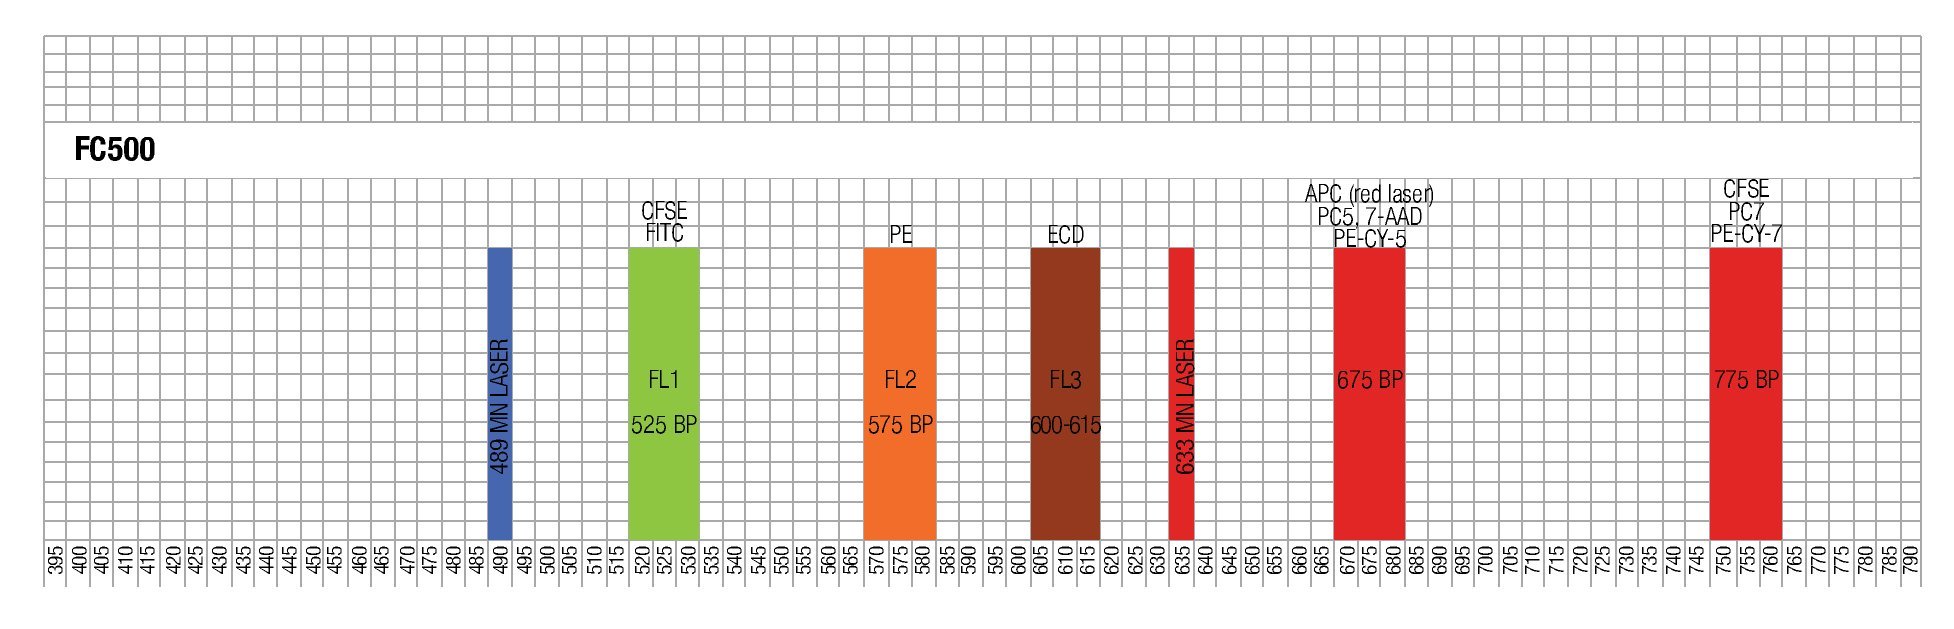
Figure 3. Representation of lasers and channels according to a FC500 (Beckman Coulter) flow cytometer. CFSE and FITC are placed on FL1, ECD in FL3, 7-AAD in FL4 , and PE-Cy7 in FL5.
Thus, based on this, and the known emission spectra for the fluorochromes to be used, we choose a combination of CFSE for FL1, ECD for FL3, 7-AAD for FL4 and PE-Cy7 for FL5 in order to minimize overlapping of the emission spectra of each individual fluorochrome used.
Validation of a multicolor staining procedure including CFSE, 7AAD and two surface markers. As referred in the material and methods for flow cytometry, before performing the multi-color staining with ECD and PE-Cy7, the location of viable and nonviable mononuclear cells in a FS/SS dot-plot was determined by 7-AAD viability labeling according to general practice in the lab. Thus, 7-AAD negative cells, which are regarded as viable by this method, were backgated to determine their location on the normal FS/SS (data not shown). The location proved to adequately match our gating procedure in the previous experiments.
After choosing the fluorochromes, a sample of CFSE stained lymphocytes was incubated for 3 days in anti-CD3/ anti-CD28 coated wells and examined for the expression of CFSE, CD3-ECD, 7-AAD and CD4-PC7 in single-stainings.
The results of this approach show the capacity of this staining procedure to visualize the different antibody and parameter expressions. It must be noticed that the increase in spillover and /or autofluorescence in FL3 and FL4 (FL3/FL1, FL3/FL4, FL4/FL1, FL4/FL3) could be related to CFSE in channel 1 (FL1). Figure 4 shows the results of analyzing the tube containing all the stainings in the same way as the single stained samples.
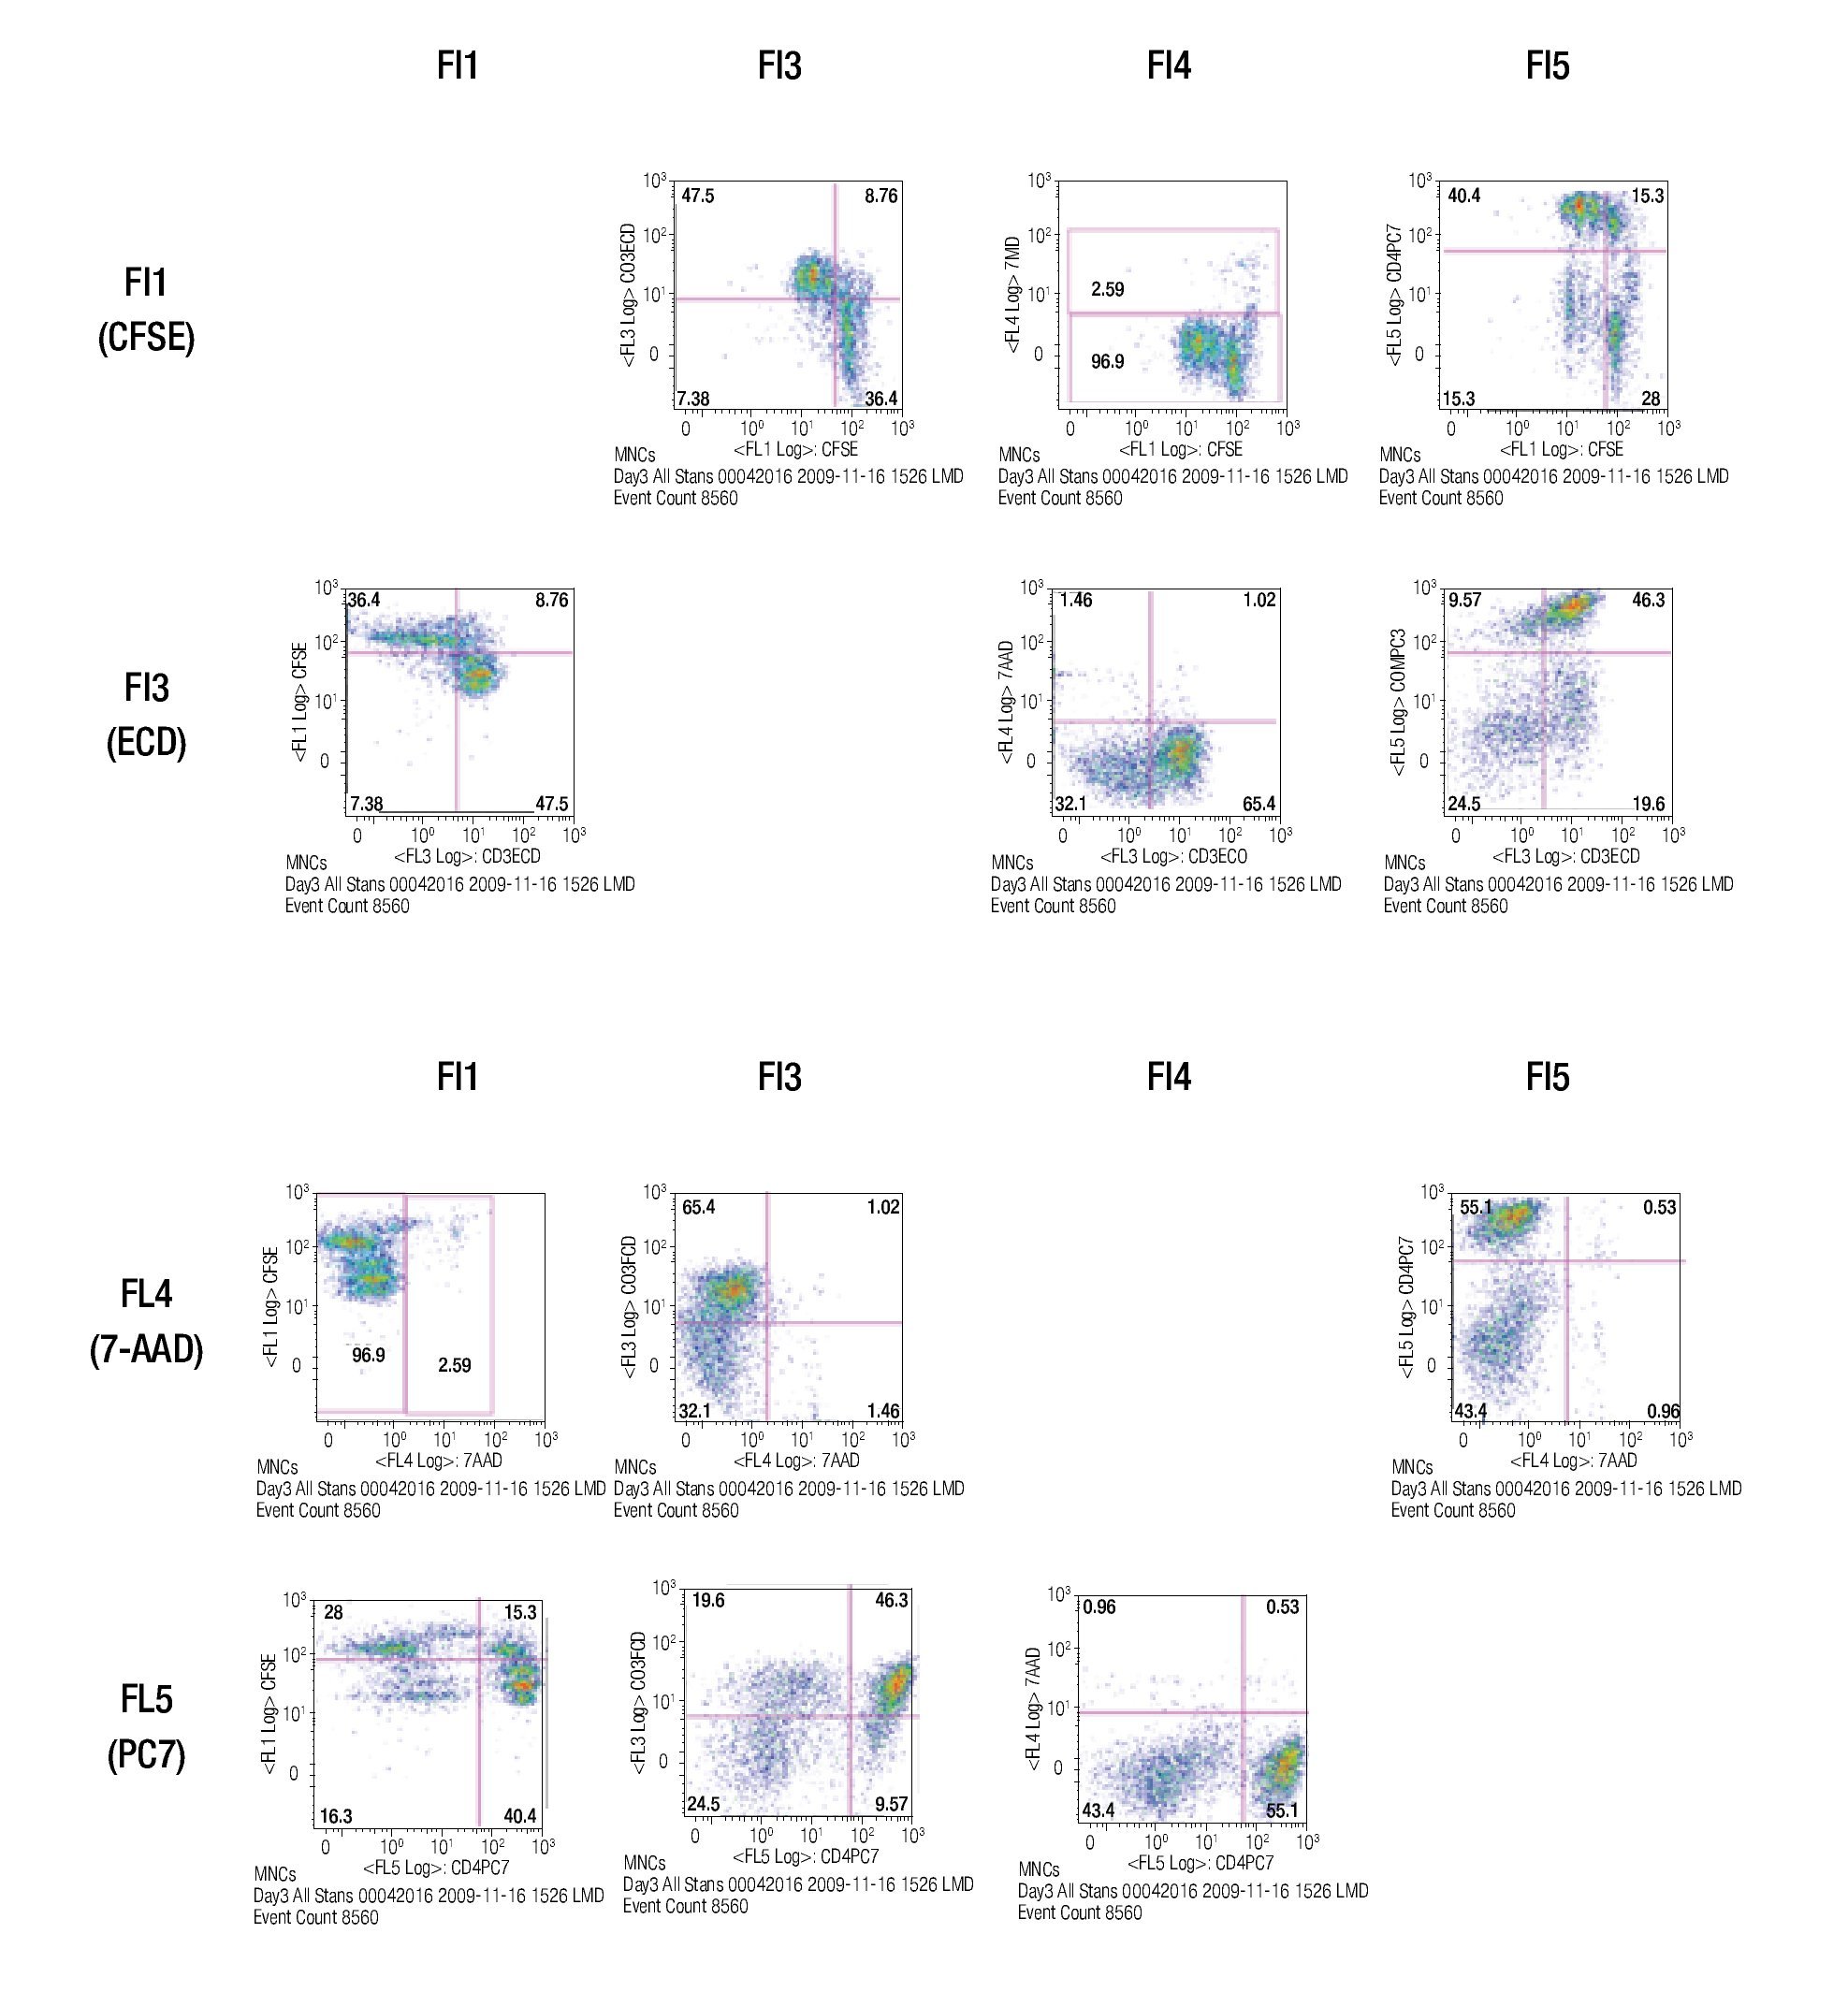
Figure 4. Multi-color staining of one representative experiment of anti-CD3/anti-CD28 stimulated MNCs at day 3 of culture. The sample is gated for lymphocytes and each fluorochromes is analyzed in all channels to verify for compensational mistakes or limitations concerning the selected fluorochromes.
Checking proper compensation of our samples. To review and check the spillover especially due to CFSE, controls of the multicolor stainings were performed (Figure 5). Each graph contains an FMO of the stainings (red), a blank sample representation (blue), single staining (green) and the same staining in the tube containing all stains (yellow). Interference from FL1 (CFSE) over FL3 (ECD) is clearly seen in Figure B, whereas interference with FL4 and FL5 is more limited (Figure 5C and 5D). Due to this fact, a comparison of FITC and CFSE emission spectra was our next step.
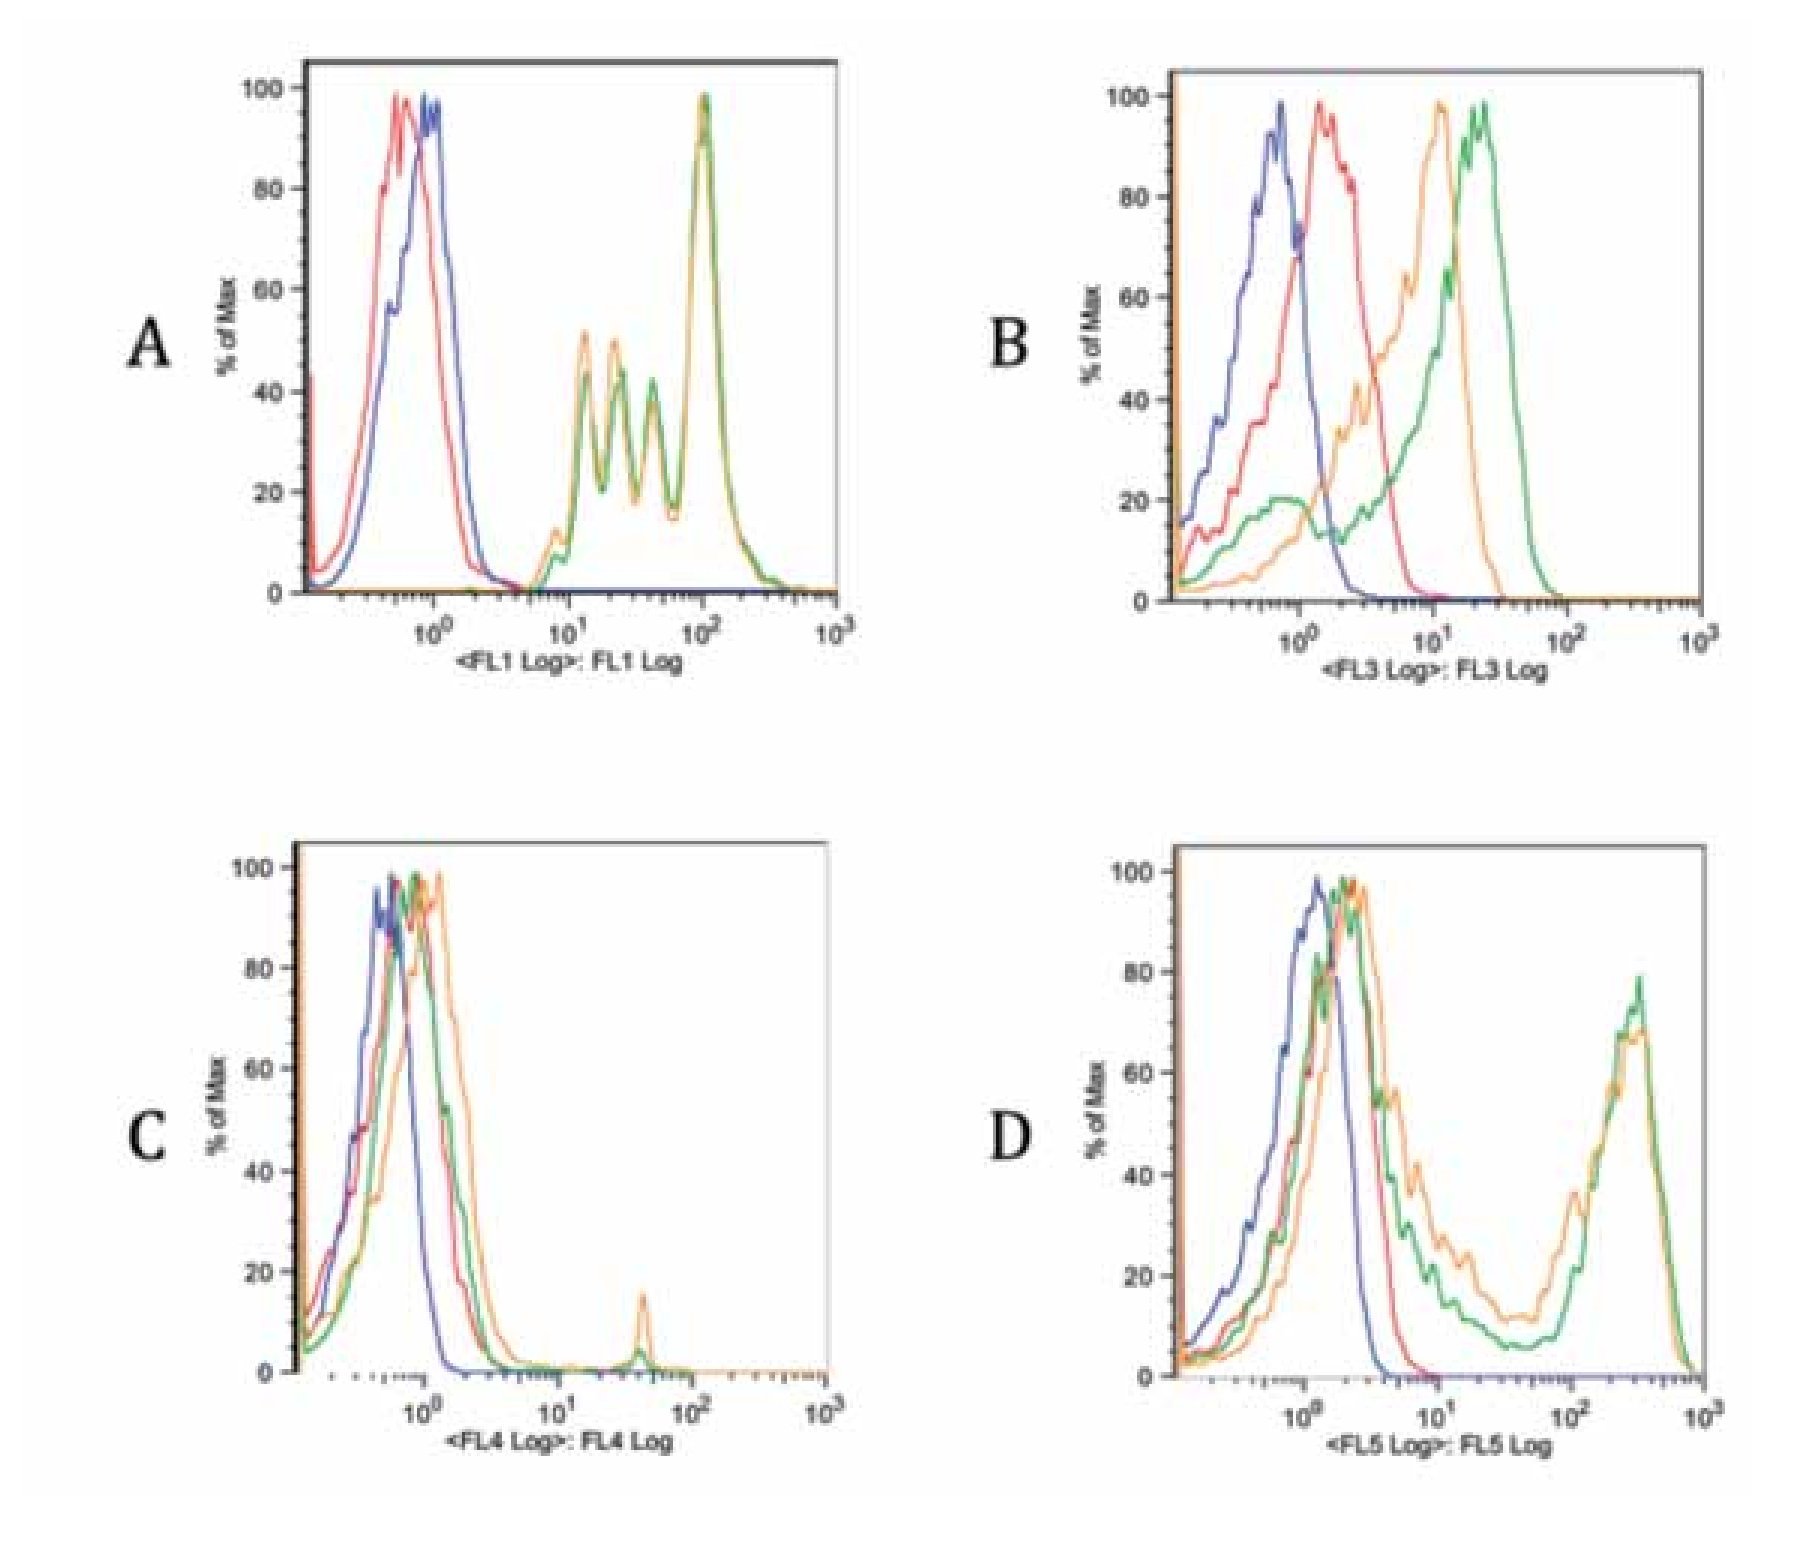
Figure 5. Fluorescence minus one controls of the multicolor flow cytometry protocol for each staining. Blank sample, FMO, single stain and all stains together sample are included in each graph. A. FL1 CFSE, B. FL3 anti-CD3 ECD, C. FL4 7-AAD and D. FL5 anti-CD4 Pe-Cy7. There is a spillover of FL1 on FL3 due to CFSE intensity. The spillover on other channels is less noticeable (C, D).
Comparison between spillover of CFSE and FITC in the FC500 channels (FL1-FL5). According to the CFSE manufacturers description, CFSE emission spectra should be the same as the FITC fluorochrome. To verify this claim and check the spillover of both, two stained samples of stimulated lymphocytes were analyzed. One sample was stained with CFSE and the other one with FITC, non- stimulated CFSE cells and unstained blank samples were included as controls. Figure 6 shows how CFSE MFI in both stimulated and non- stimulated samples spills over into FL3 and o FL5, and FITC only barely spills into FL3 and not in FL4 or FL5. Thus, these results indicate that the emission spectrum of CFSE is not completely consistent with that of FITC. The comparison between the spillover of CFSE and FITC draws the following results: The emission of CFSE causes interference in FL3, FL4 and FL5. FITC only in FL3 and in much less amount.
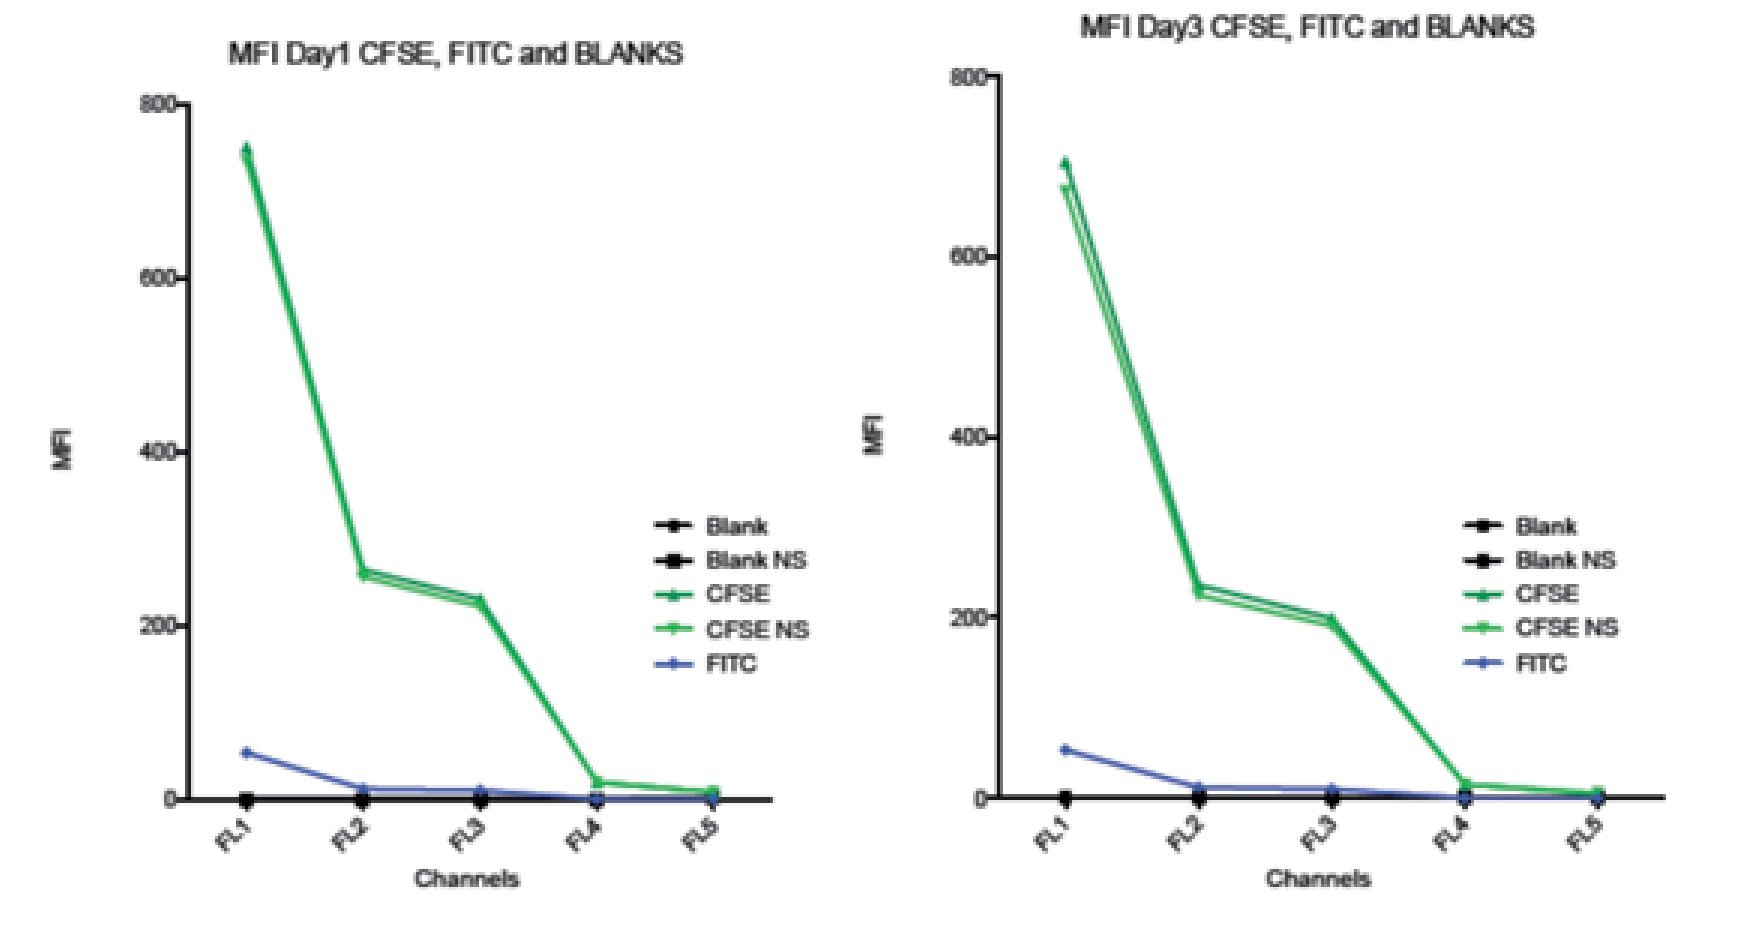
Figure 6. Comparison of the Spillover of CFSE MFI and FITC throughout the channels of the Beckman Coulter FC500 investigated after 1 (A) and 3 (B) days of incubation. According to the manufactures description, the comparatively emission spectra of CFSE should be the same as FITC. However, in our data, CFSE spills over even into FL4 and FL5. Graph includes CFSE labeled stimulated sample, CFSE labeled non-stimulated sample, FITC, Blank sample control and non-stimulated blank control.
Conclusions
The use of CFSE as a proliferation marker and its use with flow cytometry analysis has become a standard in cell research; it can be used alongside surface molecule expression, internal expression of cytokines and viability stainings. It allows complex information on proliferation kinetics and differentiation to be collected.9,18 However, the use of any combination of dyes, irrespective of their use, needs an adequate optimization of the combined agents brightness, spillover and compensation steps.19 Due to the challenge of working with CFSE we wished to optimize its use in proliferation assays for our flow cyto-meter. Hence, we started out by titrating CFSE.
The manufacturer of CFSE suggests the use of a concentration ranging from 5 μM to 10 μM of CFSE for rapidly dividing cells.10 However, it has been noticed that this concentration is not only toxic, but also delays the proliferation of cells and potentially can down-regulate the expression of surface markers.20 Thus, we tried to reduce the amount of CFSE and thereby reduce its toxicity while maintaining an appropriate staining intensity. An alternative to CFSE might be the surface marker PKH,21 or far-red dyes such as Cell Claret Vue,22 however, CFSE gives a more definite distribution of the staining among the cells compared to the surface membrane marker PKH, thus enabling a better visualization of the peaks.9,18,23 The 2.5μM concentration of CFSE and the increase in the voltage settings to determine the number of peaks (i.e. cell divisions) was sufficient to allow an acceptable display of cell proliferation, as evaluated in our in vitro anti-CD3/ anti-CD28 T cell stimulation model. Hereby we reduced the necessary amount of CFSE 2-4 fold compared to the manufacturer's recommendations and thus, we reduced the toxic effects of CFSE staining.
Moreover, although CFSE has been used in multicolor settings in different publications even in intracytoplasmatic settings, the optimization is usually not shown or the methods regarding its use are not explained.24 When combining CFSE with other fluorochromes in multipara-meter setups, we found that a limitation for our protocol was the use of a single laser without timed pulse. In newer flow cytometers, that also may include infra-red or ultraviolet lasers with time-lapse other cell proliferation stainings such as Cell Vue staining can be used, resulting in fewer problems when compensating the chosen fluorochromes.22 This limitation was addressed after we found that CFSE caused spillover in the other channels of our flow cytometer. We found a substantial spillover of CFSE to channels FL3, FL4 and FL5, while not from FITC. According to the manufacturer, CFSE should have a similar spectrum as FITC however, this is in contradiction to our results
After reviewing the results of the stainings we can conclude that while working on compensating the samples, the antibody expressed in FL3 will show interference. An appropriate marker with an important amount of expression must be selected in this channel i.e. CD3. The staining procedure is adequate to analyze consequently CFSE and 7AAD to assess viability and proliferation with the specific surface markers.
Corresponding author: Eduardo Vázquez Garza IMMI.
Lab Bygning 1240 Wilhelm Meyers Allé 4 DK-8000 Arhus C Phone: 89421741
E-mail:evazquezg@gmail.com
Recibido: Julio 2011.
Aceptado: Octubre 2011