
To validate the unsupervised cluster model (USCM) developed during the first pandemic wave in a cohort of critically ill patients from the second and third pandemic waves.
DesignObservational, retrospective, multicentre study.
SettingIntensive Care Unit (ICU).
PatientsAdult patients admitted with COVID-19 and respiratory failure during the second and third pandemic waves.
InterventionsNone.
Main variables of interestCollected data included demographic and clinical characteristics, comorbidities, laboratory tests and ICU outcomes. To validate our original USCM, we assigned a phenotype to each patient of the validation cohort. The performance of the classification was determined by Silhouette coefficient (SC) and general linear modelling. In a post-hoc analysis we developed and validated a USCM specific to the validation set. The model’s performance was measured using accuracy test and area under curve (AUC) ROC.
ResultsA total of 2330 patients (mean age 63 [53–82] years, 1643 (70.5%) male, median APACHE II score (12 [9–16]) and SOFA score (4 [3–6]) were included. The ICU mortality was 27.2%. The USCM classified patients into 3 clinical phenotypes: A (n = 1206 patients, 51.8%); B (n = 618 patients, 26.5%), and C (n = 506 patients, 21.7%). The characteristics of patients within each phenotype were significantly different from the original population. The SC was −0.007 and the inclusion of phenotype classification in a regression model did not improve the model performance (0.79 and 0.78 ROC for original and validation model). The post-hoc model performed better than the validation model (SC −0.08).
ConclusionModels developed using machine learning techniques during the first pandemic wave cannot be applied with adequate performance to patients admitted in subsequent waves without prior validation.
Validar el modelo de conglomerados no supervisado (USCM) desarrollado durante la primera ola pandémica en una cohorte de pacientes críticos de la segunda y tercera ola.
DiseñoEstudio observacional, retrospectivo y multicéntrico.
EntornoUnidad de Cuidados Intensivos (UCI).
PacientesPacientes adultos ingresados con COVID-19 e insuficiencia respiratoria durante la segunda/tercera ola pandémica.
IntervencionesNinguna.
Variables de interés principalsSe recogieron características demográficas y clínicas, comorbilidades, laboratorio y evolución en UCI. Para validar el USCM original, asignamos un fenotipo a cada paciente de la cohorte de validación. El rendimiento se determinó mediante análisis de silueta (AS) y modelización lineal general. En un análisis post-hoc desarrollamos y validamos un USCM específico para el conjunto de validación. El rendimiento del modelo se midió mediante la prueba de exactitud y el área bajo la curva (AUC) ROC.
ResultadosSe incluyeron 2033 pacientes (edad media 63 [53–-82] años, 1643 (70,5%) varones, APACHE II (12 [9–16]) y SOFA (4 [3–6]). La mortalidad en UCI fue del 27,2%. El USCM clasificó a los pacientes en 3 fenotipos clínicos: A (n = 1206 pacientes, 51.8%); B (n = 618 pacientes, 26.5%), and C (n = 506 pacientes, 21.7%). Las características de los pacientes dentro de cada fenotipo fueron significativamente diferentes de la población original. El AS fue −0.007 y la inclusión de la clasificación por fenotipos en un modelo de regresión no mejoró el rendimiento del modelo (ROC 0.79 y 0.78 para el modelo original y de validación). El modelo post-hoc obtuvo mejores resultados que el modelo de validación (AS −0.08).
ConclusionesLos modelos desarrollados durante la primera oleada pandémica no pueden aplicarse con un rendimiento adecuado a los pacientes ingresados en oleadas posteriores sin una validación previa.
Phenotypes have been described as a way to characterize patients heterogeneous in different diseases.1–11 Patients with sepsis are amongst those patients with a very variable presentation including comorbid conditions, age, and inflammatory response.1–3 More recently, this approach has been also introduced and tested in COVID-19 patients.4–13 COVID-19 is a single pathogen disease with some specific organ failure damage mainly restricted to the lungs. Due to the different array of clinical presentation from asymptomatic disease to severe acute respiratory distress syndrome, many research groups, including large number of patients aimed to phenotype and subgroup patients in order to better characterize clinical trajectories and response to treatment.4–13
During the first wave, patients with COVID-19 represented a huge challenge for healthcare systems due to the high demand of invasive mechanical ventilation and refractory hypoxemia. Our group,13 and others,4–12 found mainly three phenotypes based on the mortality rates finding some particular clinical characteristics associated with a guarded prognosis. We hypothesised that clinical phenotypes are not static models and clinical characteristics previously published will not avail to be implemented in other clinical settings and when patients are not within the same time frames.14,15 Based on these considerations, the aim of the study is to assess the reproducibility of the application of an unsupervised cluster model developed during the first pandemic wave, in a cohort of critically ill patients from the second and third pandemic waves.
Material and methodsStudy designThis study is a pre-planned secondary analysis derived from a multi-centre, prospective, observational study consisting of a large-scale data source of critically ill patients to determine the reproducibility of the application of a machine learning model developed during the first COVID-19 pandemic wave to identify clinical phenotypes, when applied to a cohort of 2330 critically ill patients from the second and third pandemic waves (1 July 2020 to 31 July 2021). The study was retrospectively registered at Clinical-Trials.gov (NCT 04948242) on the 30th of June 2021. The variables are shown in e-Table 1 (Supplementary material). The need of informed consent was waived by the Institution’s Internal Review Board (Comitè Ètic d’Investigació amb Medicaments [CEIm] from Institut d’Investigació Sanitària Pere Virgili [IISPV] — IRB# CEIM/066/2020). Local researchers-maintained contact with a study team member, and participating hospitals obtained local ethics committee approval. The study was carried out according to the principles of the Declaration of Helsinki and the Clinical Trials Directive 2001/20/EC of the European Parliament relating to the Good Clinical Practice guidelines. Information on anonymisation, data collection and validation are described in the Supplementary material (Page 1).
We reported results in accordance with the Strengthening the Reporting of Observational Studies in Epidemiology (STROBE) guidelines.16
PatientsConsecutive patients older than 16 years of age were eligible for participation if admitted to one of the 74 participating ICUs (72 from Spain, 1 from Ireland and 1 from Andorra) with acute respiratory failure and a COVID-19 diagnosis was confirmed by a positive reverse transcriptase-polymerase chain reaction for SARS-CoV-2 from upper or lower respiratory tract samples.17 The follow-up of patients was scheduled until October 31, 2021, which confirmed ICU discharge or death whichever occurred first.
OutcomesThe primary outcome included all-causes of ICU mortality. Patients who were discharged alive from ICU were evaluated in the data as alive considering mortality was defined as any in-ICU death. All complications and outcomes were followed during ICU admission.
Data preparation of the validation cohortWe first assessed the value distributions and missingness of the 25 candidate clinical variables. For data quality control, continuous variables with missing data >20% were excluded of database. Missing data for continuous variables were imputed using R-package “missForest” for the statistical software R/CRAN. The imputation was applied to impute the missing values of D dimer (15%), ferritin (15%), D-lactate dehydrogenase (10%), procalcitonin (10%), creatinine (10%), SOFA score (10%), APACHE II score (9%) and C-reactive protein (CRP) (5%). Categorical data (including ICU mortality) were available for all patients. The study definitions used in the present analysis are shown in the Additional file (Page 2). The distribution of patients for each variable in the general population and each phenotype differentiating the original cohort from the validation cohort are shown in the Additional file (e-Figs. 1–8).
Statistical analysisNo statistical sample size calculation was performed a priori, and sample size was equal to the number of patients admitted to the participant’s ICUs with confirmed COVID-19 during the study period. To describe baseline characteristics, the continuous variables were expressed as median (Q1–Q3 range]) and categorical variables as number of cases (percentage). For patient demographics and clinical characteristics, differences between groups were assessed using the chi-squared test and Fisher’s exact test for categorical variables, and the Mann–Whitney U or Wilcoxon test for continuous variables.
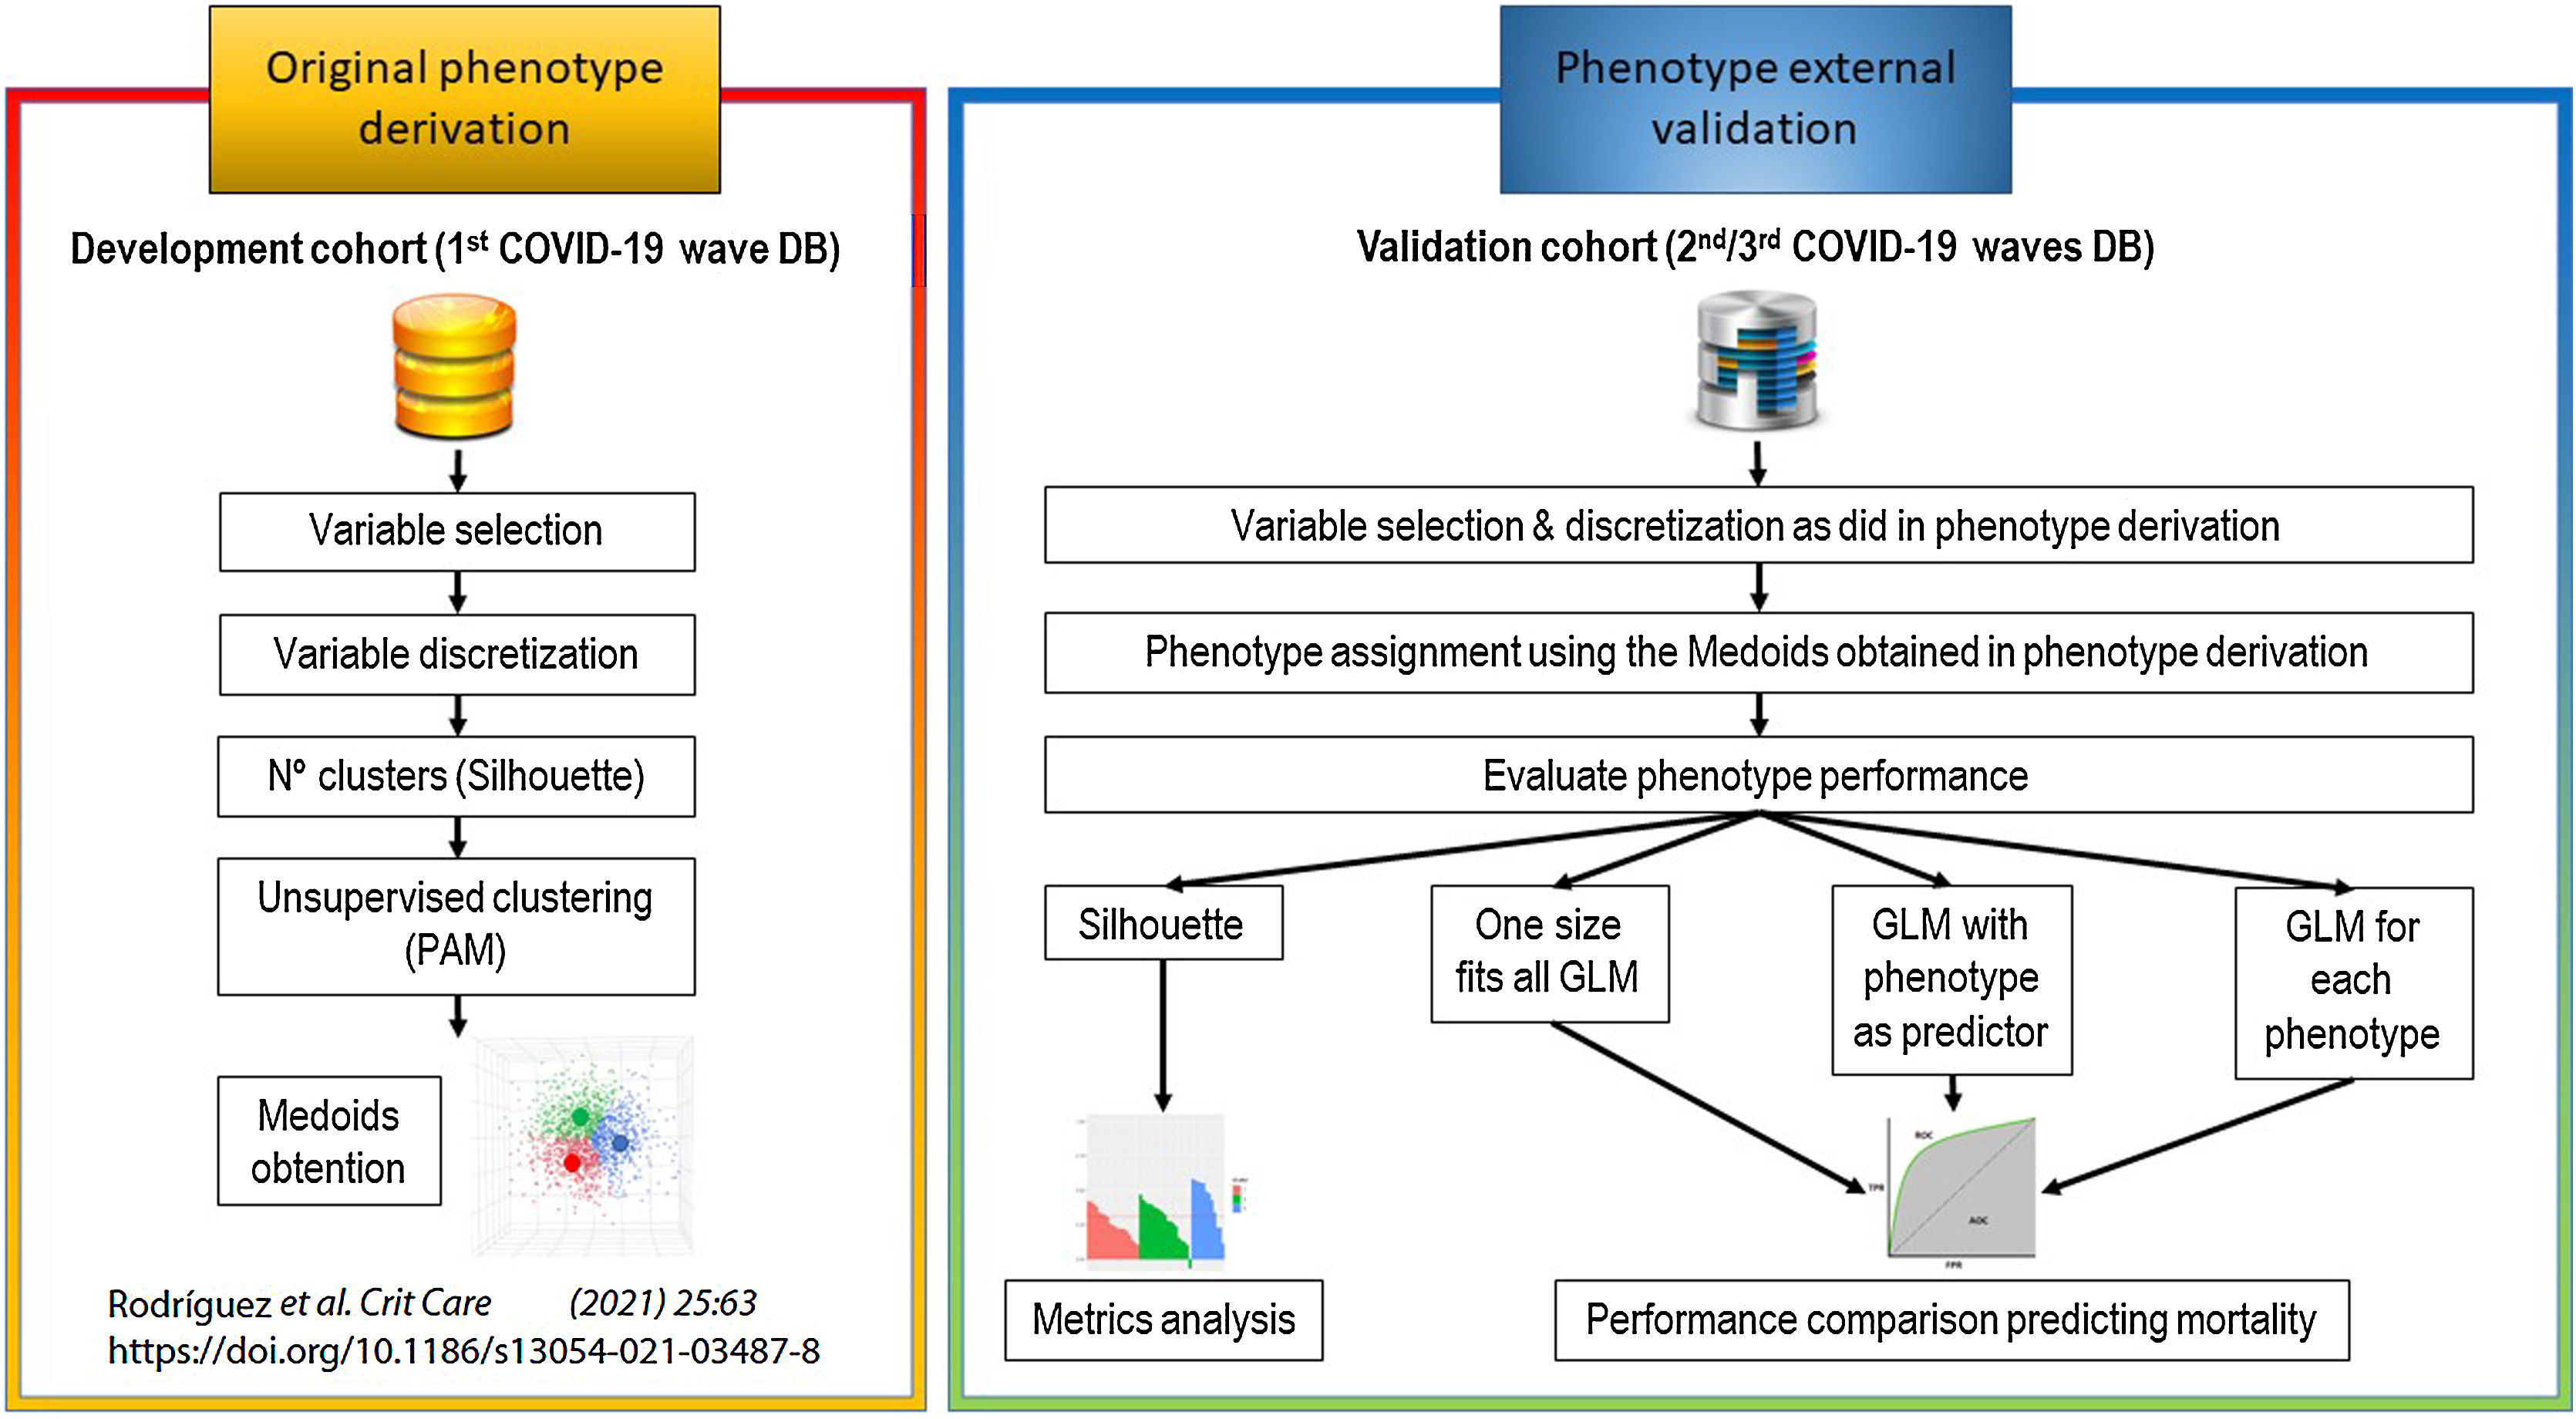
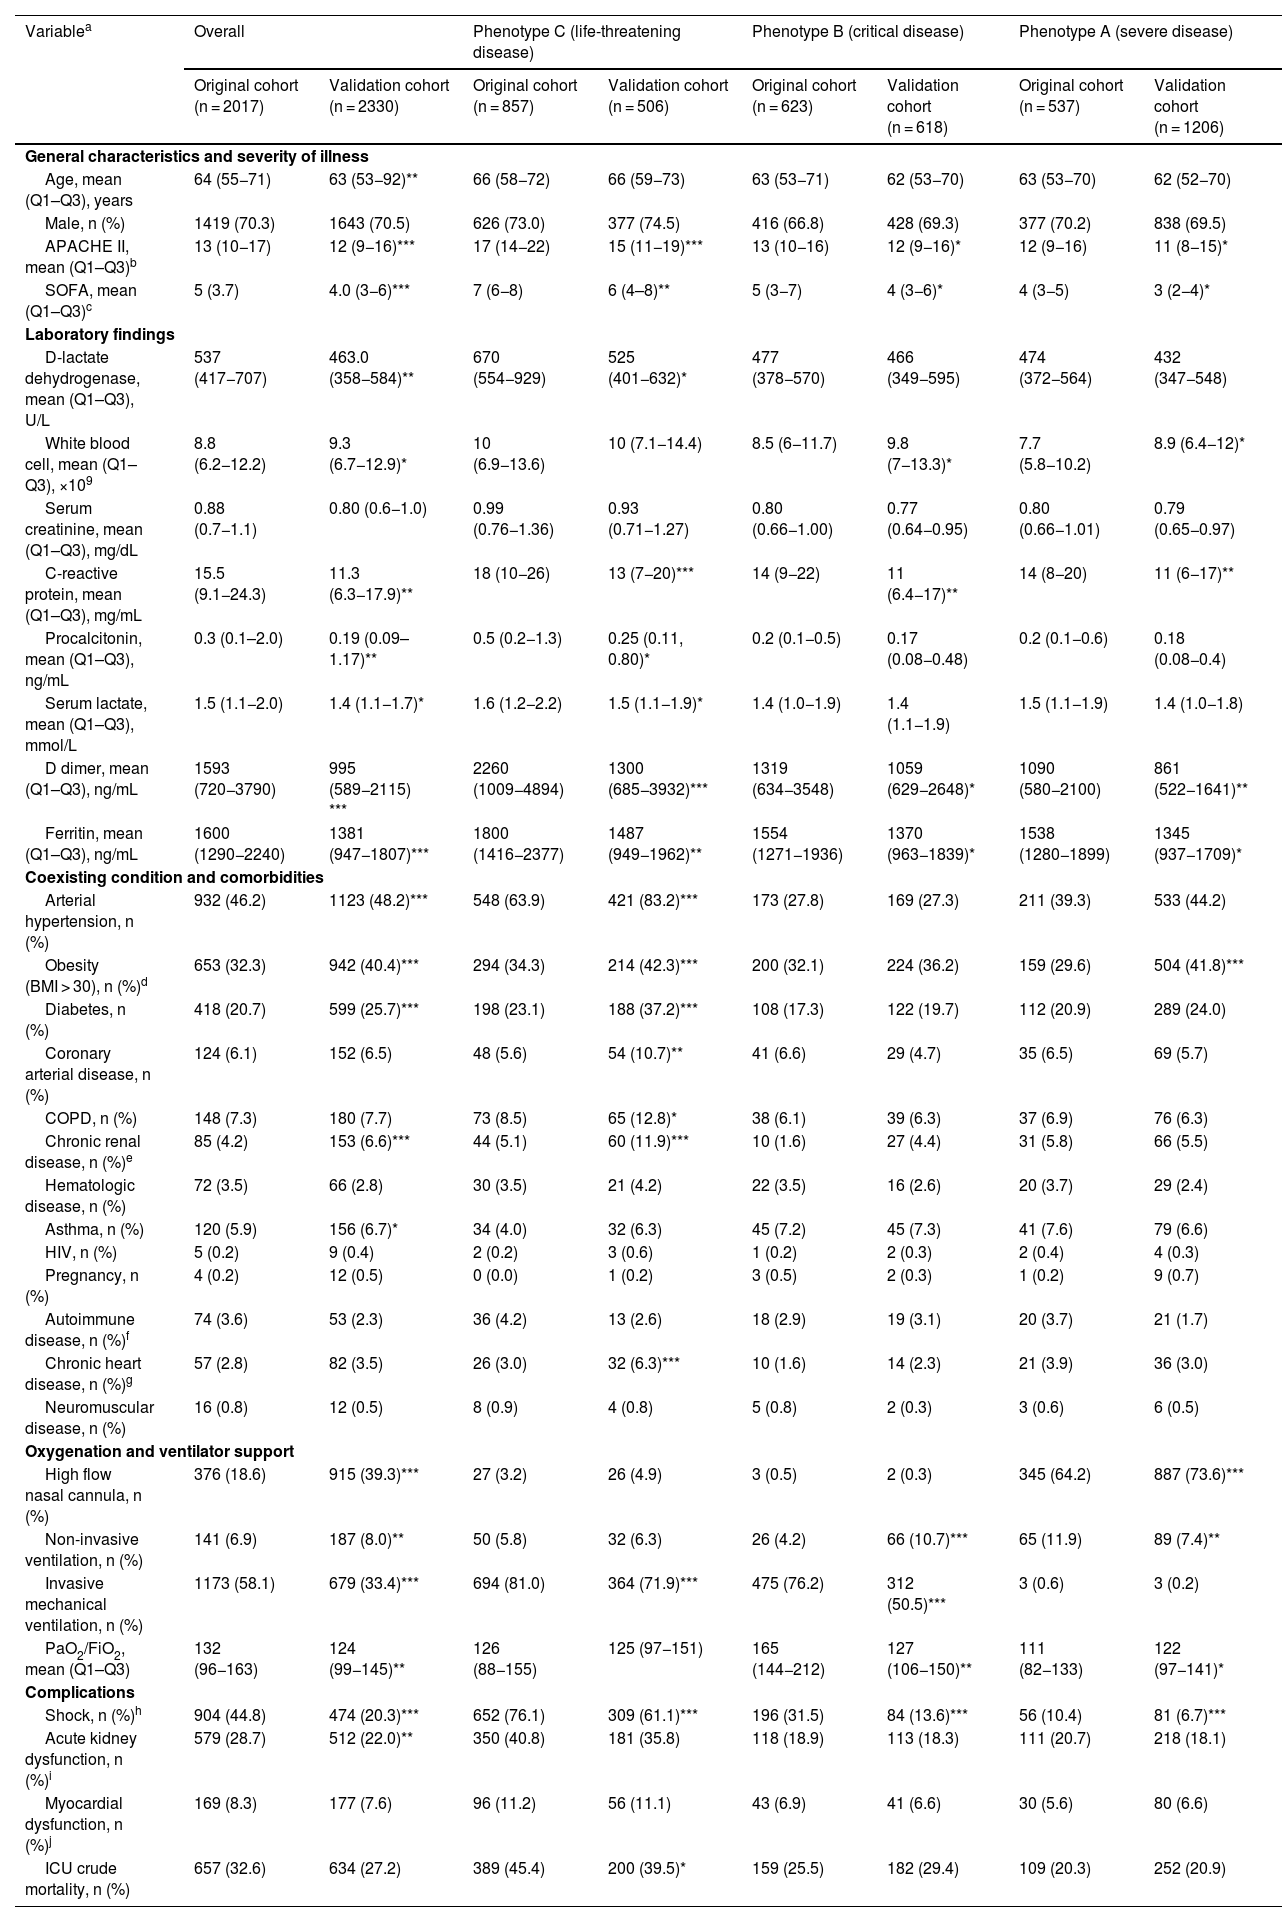
Original phenotype derivationWe originally derived phenotypes using the development cohort.13 More specifically, an unsupervised clustering analysis was applied in a cohort population of 2022 critically ill patients admitted to ICU during the first pandemic wave, and three different clinical phenotypes were derived: (1) Cluster A phenotype (severe disease); (2) Cluster B phenotype (critical disease) and (3) Cluster C phenotype (life-threatening disease). The characteristics of each phenotype are shown in Table 1 and more detailed information on the development of phenotypes is available in the original publication.13 An overview of the primary analysis plan is outlined in Fig. 1.
Patient characteristics of the original and validation cohort and within each phenotype obtained by applying the original model in the validation population.
| Variablea | Overall | Phenotype C (life-threatening disease) | Phenotype B (critical disease) | Phenotype A (severe disease) | ||||
|---|---|---|---|---|---|---|---|---|
| Original cohort (n = 2017) | Validation cohort (n = 2330) | Original cohort (n = 857) | Validation cohort (n = 506) | Original cohort (n = 623) | Validation cohort (n = 618) | Original cohort (n = 537) | Validation cohort (n = 1206) | |
| General characteristics and severity of illness | ||||||||
| Age, mean (Q1–Q3), years | 64 (55−71) | 63 (53−92)** | 66 (58−72) | 66 (59−73) | 63 (53−71) | 62 (53−70) | 63 (53−70) | 62 (52−70) |
| Male, n (%) | 1419 (70.3) | 1643 (70.5) | 626 (73.0) | 377 (74.5) | 416 (66.8) | 428 (69.3) | 377 (70.2) | 838 (69.5) |
| APACHE II, mean (Q1–Q3)b | 13 (10−17) | 12 (9−16)*** | 17 (14−22) | 15 (11−19)*** | 13 (10−16) | 12 (9−16)* | 12 (9−16) | 11 (8−15)* |
| SOFA, mean (Q1–Q3)c | 5 (3.7) | 4.0 (3−6)*** | 7 (6−8) | 6 (4–8)** | 5 (3−7) | 4 (3−6)* | 4 (3−5) | 3 (2−4)* |
| Laboratory findings | ||||||||
| D-lactate dehydrogenase, mean (Q1–Q3), U/L | 537 (417−707) | 463.0 (358−584)** | 670 (554−929) | 525 (401−632)* | 477 (378−570) | 466 (349−595) | 474 (372−564) | 432 (347−548) |
| White blood cell, mean (Q1–Q3), ×109 | 8.8 (6.2−12.2) | 9.3 (6.7−12.9)* | 10 (6.9−13.6) | 10 (7.1−14.4) | 8.5 (6−11.7) | 9.8 (7−13.3)* | 7.7 (5.8−10.2) | 8.9 (6.4−12)* |
| Serum creatinine, mean (Q1–Q3), mg/dL | 0.88 (0.7−1.1) | 0.80 (0.6−1.0) | 0.99 (0.76−1.36) | 0.93 (0.71−1.27) | 0.80 (0.66−1.00) | 0.77 (0.64−0.95) | 0.80 (0.66−1.01) | 0.79 (0.65−0.97) |
| C-reactive protein, mean (Q1–Q3), mg/mL | 15.5 (9.1−24.3) | 11.3 (6.3−17.9)** | 18 (10−26) | 13 (7−20)*** | 14 (9−22) | 11 (6.4−17)** | 14 (8−20) | 11 (6−17)** |
| Procalcitonin, mean (Q1–Q3), ng/mL | 0.3 (0.1–2.0) | 0.19 (0.09–1.17)** | 0.5 (0.2−1.3) | 0.25 (0.11, 0.80)* | 0.2 (0.1−0.5) | 0.17 (0.08−0.48) | 0.2 (0.1−0.6) | 0.18 (0.08−0.4) |
| Serum lactate, mean (Q1–Q3), mmol/L | 1.5 (1.1−2.0) | 1.4 (1.1−1.7)* | 1.6 (1.2−2.2) | 1.5 (1.1−1.9)* | 1.4 (1.0−1.9) | 1.4 (1.1−1.9) | 1.5 (1.1−1.9) | 1.4 (1.0−1.8) |
| D dimer, mean (Q1–Q3), ng/mL | 1593 (720−3790) | 995 (589−2115) *** | 2260 (1009−4894) | 1300 (685−3932)*** | 1319 (634−3548) | 1059 (629−2648)* | 1090 (580−2100) | 861 (522−1641)** |
| Ferritin, mean (Q1–Q3), ng/mL | 1600 (1290−2240) | 1381 (947−1807)*** | 1800 (1416−2377) | 1487 (949−1962)** | 1554 (1271−1936) | 1370 (963−1839)* | 1538 (1280−1899) | 1345 (937−1709)* |
| Coexisting condition and comorbidities | ||||||||
| Arterial hypertension, n (%) | 932 (46.2) | 1123 (48.2)*** | 548 (63.9) | 421 (83.2)*** | 173 (27.8) | 169 (27.3) | 211 (39.3) | 533 (44.2) |
| Obesity (BMI > 30), n (%)d | 653 (32.3) | 942 (40.4)*** | 294 (34.3) | 214 (42.3)*** | 200 (32.1) | 224 (36.2) | 159 (29.6) | 504 (41.8)*** |
| Diabetes, n (%) | 418 (20.7) | 599 (25.7)*** | 198 (23.1) | 188 (37.2)*** | 108 (17.3) | 122 (19.7) | 112 (20.9) | 289 (24.0) |
| Coronary arterial disease, n (%) | 124 (6.1) | 152 (6.5) | 48 (5.6) | 54 (10.7)** | 41 (6.6) | 29 (4.7) | 35 (6.5) | 69 (5.7) |
| COPD, n (%) | 148 (7.3) | 180 (7.7) | 73 (8.5) | 65 (12.8)* | 38 (6.1) | 39 (6.3) | 37 (6.9) | 76 (6.3) |
| Chronic renal disease, n (%)e | 85 (4.2) | 153 (6.6)*** | 44 (5.1) | 60 (11.9)*** | 10 (1.6) | 27 (4.4) | 31 (5.8) | 66 (5.5) |
| Hematologic disease, n (%) | 72 (3.5) | 66 (2.8) | 30 (3.5) | 21 (4.2) | 22 (3.5) | 16 (2.6) | 20 (3.7) | 29 (2.4) |
| Asthma, n (%) | 120 (5.9) | 156 (6.7)* | 34 (4.0) | 32 (6.3) | 45 (7.2) | 45 (7.3) | 41 (7.6) | 79 (6.6) |
| HIV, n (%) | 5 (0.2) | 9 (0.4) | 2 (0.2) | 3 (0.6) | 1 (0.2) | 2 (0.3) | 2 (0.4) | 4 (0.3) |
| Pregnancy, n (%) | 4 (0.2) | 12 (0.5) | 0 (0.0) | 1 (0.2) | 3 (0.5) | 2 (0.3) | 1 (0.2) | 9 (0.7) |
| Autoimmune disease, n (%)f | 74 (3.6) | 53 (2.3) | 36 (4.2) | 13 (2.6) | 18 (2.9) | 19 (3.1) | 20 (3.7) | 21 (1.7) |
| Chronic heart disease, n (%)g | 57 (2.8) | 82 (3.5) | 26 (3.0) | 32 (6.3)*** | 10 (1.6) | 14 (2.3) | 21 (3.9) | 36 (3.0) |
| Neuromuscular disease, n (%) | 16 (0.8) | 12 (0.5) | 8 (0.9) | 4 (0.8) | 5 (0.8) | 2 (0.3) | 3 (0.6) | 6 (0.5) |
| Oxygenation and ventilator support | ||||||||
| High flow nasal cannula, n (%) | 376 (18.6) | 915 (39.3)*** | 27 (3.2) | 26 (4.9) | 3 (0.5) | 2 (0.3) | 345 (64.2) | 887 (73.6)*** |
| Non-invasive ventilation, n (%) | 141 (6.9) | 187 (8.0)** | 50 (5.8) | 32 (6.3) | 26 (4.2) | 66 (10.7)*** | 65 (11.9) | 89 (7.4)** |
| Invasive mechanical ventilation, n (%) | 1173 (58.1) | 679 (33.4)*** | 694 (81.0) | 364 (71.9)*** | 475 (76.2) | 312 (50.5)*** | 3 (0.6) | 3 (0.2) |
| PaO2/FiO2, mean (Q1–Q3) | 132 (96−163) | 124 (99−145)** | 126 (88−155) | 125 (97−151) | 165 (144−212) | 127 (106−150)** | 111 (82−133) | 122 (97−141)* |
| Complications | ||||||||
| Shock, n (%)h | 904 (44.8) | 474 (20.3)*** | 652 (76.1) | 309 (61.1)*** | 196 (31.5) | 84 (13.6)*** | 56 (10.4) | 81 (6.7)*** |
| Acute kidney dysfunction, n (%)i | 579 (28.7) | 512 (22.0)** | 350 (40.8) | 181 (35.8) | 118 (18.9) | 113 (18.3) | 111 (20.7) | 218 (18.1) |
| Myocardial dysfunction, n (%)j | 169 (8.3) | 177 (7.6) | 96 (11.2) | 56 (11.1) | 43 (6.9) | 41 (6.6) | 30 (5.6) | 80 (6.6) |
| ICU crude mortality, n (%) | 657 (32.6) | 634 (27.2) | 389 (45.4) | 200 (39.5)* | 159 (25.5) | 182 (29.4) | 109 (20.3) | 252 (20.9) |
All comparison between overall and clusters. *p < 0.05; **p < 0.01; ***p < 0.001, others comparison p > 0.01.
Abbreviations: IQR, interquartile range; APACHE II, Acute Physiology and Chronic Health Evaluation II; SOFA, Sequential Organ Failure Assessment; BMI, body mass index; COPD, chronic obstructive pulmonary disease; HIV, human immunodeficiency viruses; PaO2/FiO2, partial pressure arterial oxygen/fraction of inspired oxygen.
Corresponds to minimum or maximum value, as appropriate, within 12 h of ICU admission. The variables in this Table were no transformed for your comparison.
APACHE II score to the severity of illness, the score is obtained by adding the following components 1) 12 clinical and laboratory variables each with a score range of 0–4 points (APS). The APS is determined from the worst physiologic values during the initial 24 h after ICU admission, 2) age with a range 0–6 points and 3) chronic health points if the patients has history of severe organ system insufficiency or is immunocompromised assign 5 points if the patients is no operative or emergency postoperative and 2 points for elective postoperative patients with a total score range of 0–71.
SOFA score corresponds to the severity of organ dysfunction, reflecting six organ systems each with a score range of 0–4 points (cardiovascular, hepatic, hematologic, respiratory, neurological, renal), with a total score range of 0–24.
Defined as a body mass index (calculated as weight in kilograms divided by height in meters squared) of 30 or greater.
Baseline eGFR <60 on at least two consecutive values at least 12 weeks apart prior or hemodialysis.
Defined as patients in whom adequate fluid resuscitation therapy are unable to restore hemodynamic stability and need any dose of vasopressor drugs.

To evaluate the reproducibility, we validated our original phenotypes like the primary analysis. We assigned a phenotype to each patient of the validation cohort using the medoids obtained with the development cohort. The analysis was carried out using the same number of clusters (n = 3), the same number of variables (n = 25) and the same discretisation of variables used in the development of the original model.13 We then characterised the new population assigned to each phenotype by assessing their differences in demographics, clinical and laboratory variables, comorbidities, and mortality from the original phenotypes.
Performance evaluation of phenotype classificationThe performance of the classification was determined by:
- a)
Silhouette analysis: the silhouette analysis measures how well an observation is clustered, and it estimates the average distance between clusters. The Silhouette coefficient (Si) measures how similar an object “i” is to the other objects in its own cluster versus those in the neighbour cluster. Si values range from 1 to −1: a value of Si close to 1 indicates that the object is well clustered. A value of Si close to −1 indicates that the object is poorly clustered, and that assignment to some other cluster would probably improve the overall results. Finally, the silhouette plot displays a measure of how close each point in one cluster is to points in the neighboring clusters.
- b)
General linear model (GLM): in addition, for the aims of confirming phenotypes performance, we developed a supervised predictive model (GLM) with validation dataset. GLM (original) was performed to investigate the association between baseline (on ICU admission) variables and ICU-mortality. The GLM model comprised factors of clinical interest and all significant covariates (p < 0.05) in the univariate analysis of ICU mortality, and we studied presence of collinearity between explanatory variables with the use of variance inflation factors (VIF). A VIF value greater than 5 was considered as potentially severe correlation between predictor variables and the variable was excluded of model.
The results are presented as odds ratios (OR) and 95% confidence intervals (CI).
To assess whether the new classification of patients by phenotype improved the performance of the original GLM model, a new GLM model was run again, now including the phenotype variable (modified model), and finally the model was applied to patients within each phenotype (model A, B and C).
For all model internal validation, database was randomly split into two subsets: (a) a “training set” (70%), and (b) a “validation set” (30%). Models’ performance was examined using accuracy test, sensitivity(S), specificity (Sp), positive predictive value (PPV), negative predictive value (NPV) and area under ROC curve (AUC). The AUC ROC of the models was compared using the package roc.test (R sfotware). This function compares two correlated (or matched) or uncorrelated (unmatched) ROC curves. The Delong method was used which tests whether there is a difference in the (partial) AUC of the ROC curves.
A post-hoc analysisWe performed an unsupervised cluster model specific to the second and third wave patients (2/3 wave model) in order to evaluate whether a model specifically designed to obtain new medoids classifies patients better than the validation model. The performance of the 2/3 wave model classification was assessed by silhouette analysis.
Data analysis was performed using R software (cran.r-project.org).
ResultsStudy populationsThe original population includes 2017 patients admitted to ICUs during the first pandemic wave as noted in the original publication.13 The validation population includes 2330 patients admitted to ICUs during the second and third pandemic waves and is the focus of the present study.
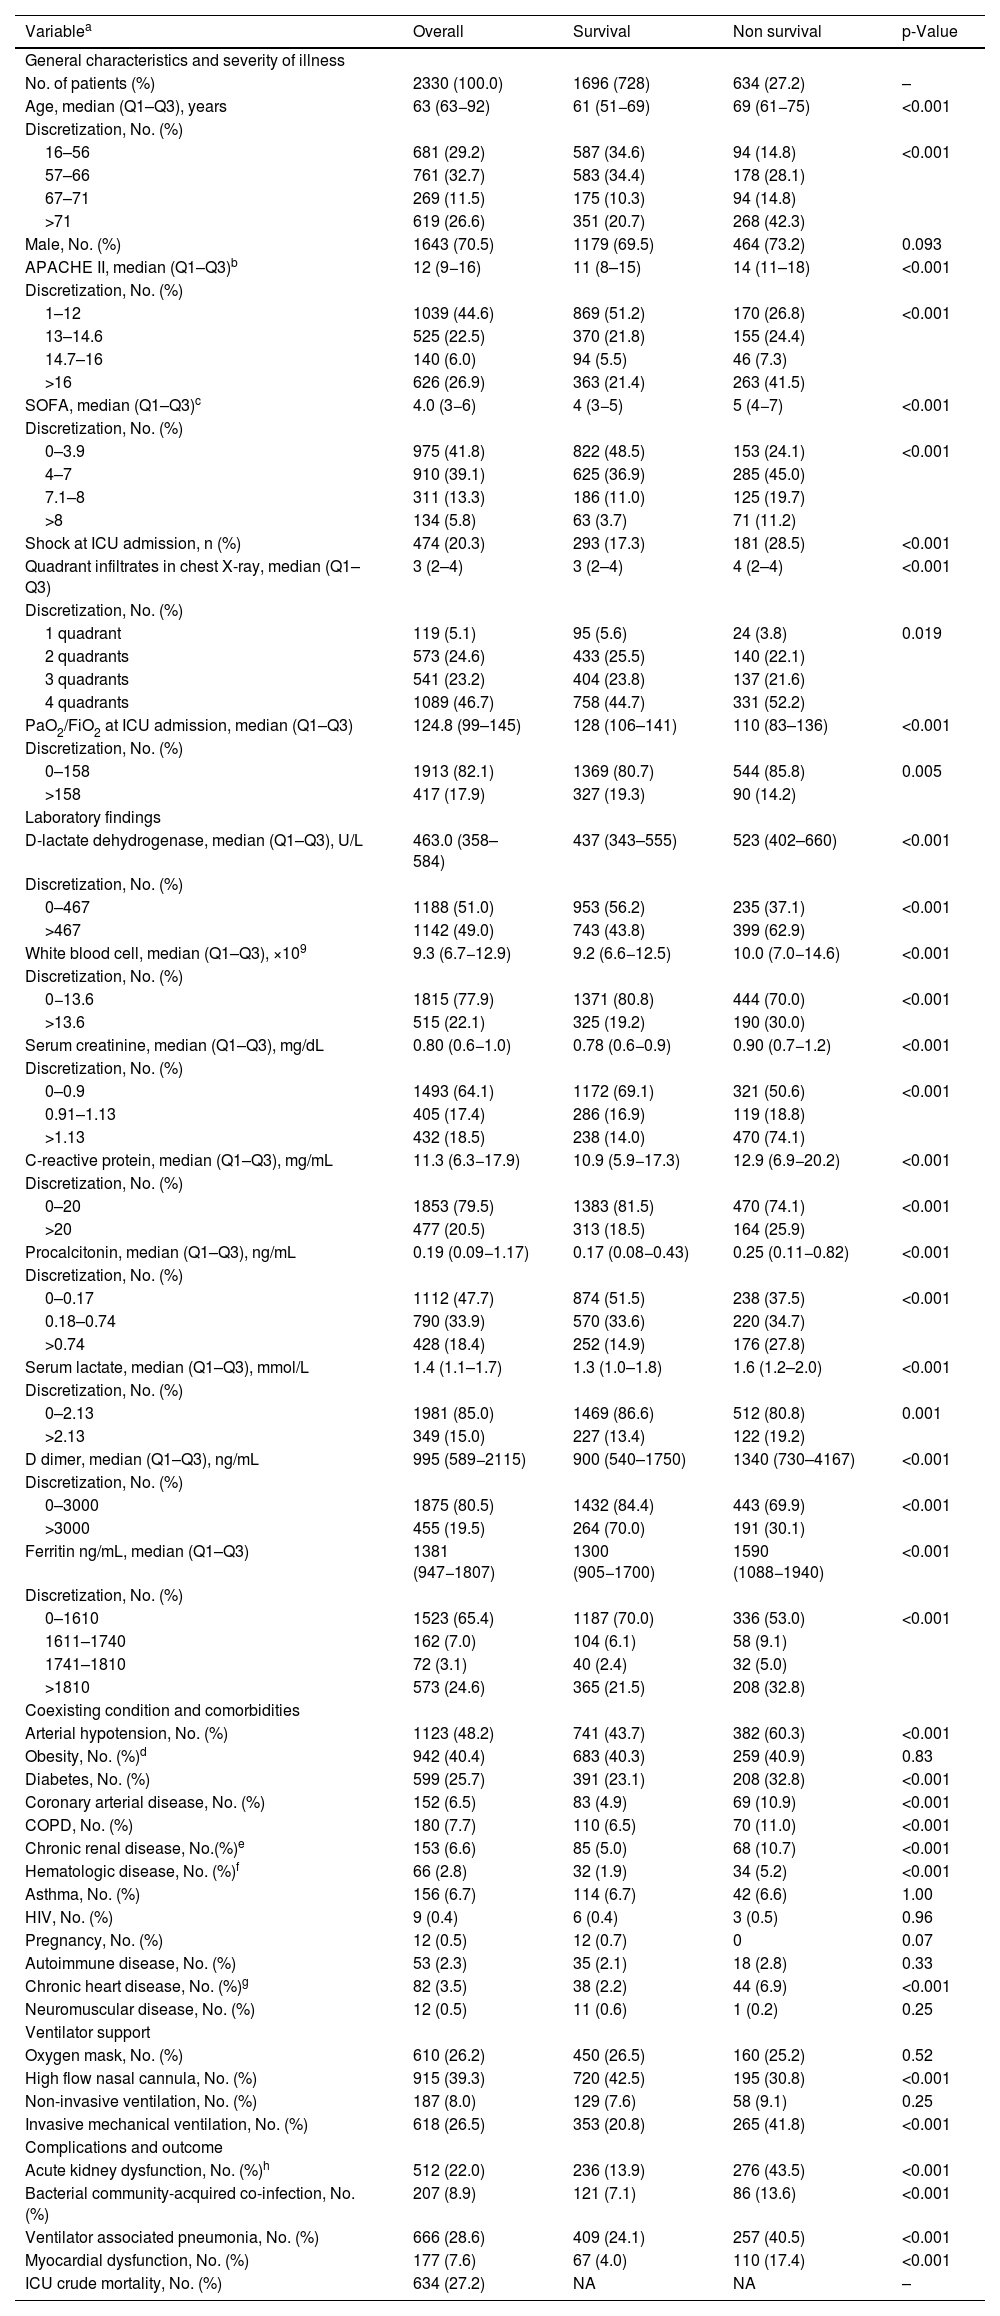
Characteristics of patients in the validation group on admission to the ICUFrom July 1, 2020, to July 31, 2021, a total of 2330 critically ill patients from 74 ICUs were enrolled in the present analysis. The median age was 63 (53–82) years, and 1643 (70.5%) were men. A total of 1630 (70.0%) patients had at least one coexisting comorbidity. Arterial hypertension (n = 1123; 48.2%) and obesity (n = 942; 40.4%) were the most frequently comorbid conditions reported. The severity of illness was intermediate according to the APACHE II (12 [9–16]) and SOFA (4 [3–6]) scores. PaO2/FiO2 ratio on the day of ICU admission was 124.8 (99–145) and 915 (39.3%) patients required high flow nasal cannula (HFNC). Only 26.5% (n = 618) of patients required mechanical ventilation on ICU admission. The ICU crude mortality was 27.2% (n = 634). As expected, patients who died were more severe, had a higher frequency of comorbidities and complications than those who survived. The clinical characteristics of the patients and laboratory results are shown in Table 2.
Characteristics of 2330 COVID-19 critically ill patients in the validation group included in the study. The data are shown with the discretisation of the variables used to carry out the study.
| Variablea | Overall | Survival | Non survival | p-Value |
|---|---|---|---|---|
| General characteristics and severity of illness | ||||
| No. of patients (%) | 2330 (100.0) | 1696 (728) | 634 (27.2) | – |
| Age, median (Q1–Q3), years | 63 (63−92) | 61 (51−69) | 69 (61−75) | <0.001 |
| Discretization, No. (%) | ||||
| 16–56 | 681 (29.2) | 587 (34.6) | 94 (14.8) | <0.001 |
| 57–66 | 761 (32.7) | 583 (34.4) | 178 (28.1) | |
| 67–71 | 269 (11.5) | 175 (10.3) | 94 (14.8) | |
| >71 | 619 (26.6) | 351 (20.7) | 268 (42.3) | |
| Male, No. (%) | 1643 (70.5) | 1179 (69.5) | 464 (73.2) | 0.093 |
| APACHE II, median (Q1–Q3)b | 12 (9−16) | 11 (8–15) | 14 (11–18) | <0.001 |
| Discretization, No. (%) | ||||
| 1–12 | 1039 (44.6) | 869 (51.2) | 170 (26.8) | <0.001 |
| 13–14.6 | 525 (22.5) | 370 (21.8) | 155 (24.4) | |
| 14.7–16 | 140 (6.0) | 94 (5.5) | 46 (7.3) | |
| >16 | 626 (26.9) | 363 (21.4) | 263 (41.5) | |
| SOFA, median (Q1–Q3)c | 4.0 (3−6) | 4 (3−5) | 5 (4−7) | <0.001 |
| Discretization, No. (%) | ||||
| 0–3.9 | 975 (41.8) | 822 (48.5) | 153 (24.1) | <0.001 |
| 4–7 | 910 (39.1) | 625 (36.9) | 285 (45.0) | |
| 7.1–8 | 311 (13.3) | 186 (11.0) | 125 (19.7) | |
| >8 | 134 (5.8) | 63 (3.7) | 71 (11.2) | |
| Shock at ICU admission, n (%) | 474 (20.3) | 293 (17.3) | 181 (28.5) | <0.001 |
| Quadrant infiltrates in chest X-ray, median (Q1–Q3) | 3 (2–4) | 3 (2–4) | 4 (2–4) | <0.001 |
| Discretization, No. (%) | ||||
| 1 quadrant | 119 (5.1) | 95 (5.6) | 24 (3.8) | 0.019 |
| 2 quadrants | 573 (24.6) | 433 (25.5) | 140 (22.1) | |
| 3 quadrants | 541 (23.2) | 404 (23.8) | 137 (21.6) | |
| 4 quadrants | 1089 (46.7) | 758 (44.7) | 331 (52.2) | |
| PaO2/FiO2 at ICU admission, median (Q1–Q3) | 124.8 (99–145) | 128 (106–141) | 110 (83–136) | <0.001 |
| Discretization, No. (%) | ||||
| 0–158 | 1913 (82.1) | 1369 (80.7) | 544 (85.8) | 0.005 |
| >158 | 417 (17.9) | 327 (19.3) | 90 (14.2) | |
| Laboratory findings | ||||
| D-lactate dehydrogenase, median (Q1–Q3), U/L | 463.0 (358–584) | 437 (343–555) | 523 (402–660) | <0.001 |
| Discretization, No. (%) | ||||
| 0–467 | 1188 (51.0) | 953 (56.2) | 235 (37.1) | <0.001 |
| >467 | 1142 (49.0) | 743 (43.8) | 399 (62.9) | |
| White blood cell, median (Q1–Q3), ×109 | 9.3 (6.7−12.9) | 9.2 (6.6−12.5) | 10.0 (7.0−14.6) | <0.001 |
| Discretization, No. (%) | ||||
| 0−13.6 | 1815 (77.9) | 1371 (80.8) | 444 (70.0) | <0.001 |
| >13.6 | 515 (22.1) | 325 (19.2) | 190 (30.0) | |
| Serum creatinine, median (Q1–Q3), mg/dL | 0.80 (0.6−1.0) | 0.78 (0.6−0.9) | 0.90 (0.7−1.2) | <0.001 |
| Discretization, No. (%) | ||||
| 0–0.9 | 1493 (64.1) | 1172 (69.1) | 321 (50.6) | <0.001 |
| 0.91–1.13 | 405 (17.4) | 286 (16.9) | 119 (18.8) | |
| >1.13 | 432 (18.5) | 238 (14.0) | 470 (74.1) | |
| C-reactive protein, median (Q1–Q3), mg/mL | 11.3 (6.3−17.9) | 10.9 (5.9−17.3) | 12.9 (6.9−20.2) | <0.001 |
| Discretization, No. (%) | ||||
| 0–20 | 1853 (79.5) | 1383 (81.5) | 470 (74.1) | <0.001 |
| >20 | 477 (20.5) | 313 (18.5) | 164 (25.9) | |
| Procalcitonin, median (Q1–Q3), ng/mL | 0.19 (0.09−1.17) | 0.17 (0.08−0.43) | 0.25 (0.11−0.82) | <0.001 |
| Discretization, No. (%) | ||||
| 0–0.17 | 1112 (47.7) | 874 (51.5) | 238 (37.5) | <0.001 |
| 0.18–0.74 | 790 (33.9) | 570 (33.6) | 220 (34.7) | |
| >0.74 | 428 (18.4) | 252 (14.9) | 176 (27.8) | |
| Serum lactate, median (Q1–Q3), mmol/L | 1.4 (1.1–1.7) | 1.3 (1.0–1.8) | 1.6 (1.2–2.0) | <0.001 |
| Discretization, No. (%) | ||||
| 0–2.13 | 1981 (85.0) | 1469 (86.6) | 512 (80.8) | 0.001 |
| >2.13 | 349 (15.0) | 227 (13.4) | 122 (19.2) | |
| D dimer, median (Q1–Q3), ng/mL | 995 (589−2115) | 900 (540–1750) | 1340 (730–4167) | <0.001 |
| Discretization, No. (%) | ||||
| 0–3000 | 1875 (80.5) | 1432 (84.4) | 443 (69.9) | <0.001 |
| >3000 | 455 (19.5) | 264 (70.0) | 191 (30.1) | |
| Ferritin ng/mL, median (Q1–Q3) | 1381 (947−1807) | 1300 (905−1700) | 1590 (1088−1940) | <0.001 |
| Discretization, No. (%) | ||||
| 0–1610 | 1523 (65.4) | 1187 (70.0) | 336 (53.0) | <0.001 |
| 1611–1740 | 162 (7.0) | 104 (6.1) | 58 (9.1) | |
| 1741–1810 | 72 (3.1) | 40 (2.4) | 32 (5.0) | |
| >1810 | 573 (24.6) | 365 (21.5) | 208 (32.8) | |
| Coexisting condition and comorbidities | ||||
| Arterial hypotension, No. (%) | 1123 (48.2) | 741 (43.7) | 382 (60.3) | <0.001 |
| Obesity, No. (%)d | 942 (40.4) | 683 (40.3) | 259 (40.9) | 0.83 |
| Diabetes, No. (%) | 599 (25.7) | 391 (23.1) | 208 (32.8) | <0.001 |
| Coronary arterial disease, No. (%) | 152 (6.5) | 83 (4.9) | 69 (10.9) | <0.001 |
| COPD, No. (%) | 180 (7.7) | 110 (6.5) | 70 (11.0) | <0.001 |
| Chronic renal disease, No.(%)e | 153 (6.6) | 85 (5.0) | 68 (10.7) | <0.001 |
| Hematologic disease, No. (%)f | 66 (2.8) | 32 (1.9) | 34 (5.2) | <0.001 |
| Asthma, No. (%) | 156 (6.7) | 114 (6.7) | 42 (6.6) | 1.00 |
| HIV, No. (%) | 9 (0.4) | 6 (0.4) | 3 (0.5) | 0.96 |
| Pregnancy, No. (%) | 12 (0.5) | 12 (0.7) | 0 | 0.07 |
| Autoimmune disease, No. (%) | 53 (2.3) | 35 (2.1) | 18 (2.8) | 0.33 |
| Chronic heart disease, No. (%)g | 82 (3.5) | 38 (2.2) | 44 (6.9) | <0.001 |
| Neuromuscular disease, No. (%) | 12 (0.5) | 11 (0.6) | 1 (0.2) | 0.25 |
| Ventilator support | ||||
| Oxygen mask, No. (%) | 610 (26.2) | 450 (26.5) | 160 (25.2) | 0.52 |
| High flow nasal cannula, No. (%) | 915 (39.3) | 720 (42.5) | 195 (30.8) | <0.001 |
| Non-invasive ventilation, No. (%) | 187 (8.0) | 129 (7.6) | 58 (9.1) | 0.25 |
| Invasive mechanical ventilation, No. (%) | 618 (26.5) | 353 (20.8) | 265 (41.8) | <0.001 |
| Complications and outcome | ||||
| Acute kidney dysfunction, No. (%)h | 512 (22.0) | 236 (13.9) | 276 (43.5) | <0.001 |
| Bacterial community-acquired co-infection, No. (%) | 207 (8.9) | 121 (7.1) | 86 (13.6) | <0.001 |
| Ventilator associated pneumonia, No. (%) | 666 (28.6) | 409 (24.1) | 257 (40.5) | <0.001 |
| Myocardial dysfunction, No. (%) | 177 (7.6) | 67 (4.0) | 110 (17.4) | <0.001 |
| ICU crude mortality, No. (%) | 634 (27.2) | NA | NA | – |
Abbreviations: Q1–Q3: 1st quartile–3rd quartile; APACHE II, Acute Physiology and Chronic Health Evaluation II; SOFA, Sequential Organ Failure Assessment; BMI, body mass index; COPD, Chronic obstructive pulmonary disease; HIV, human immunodeficiency viruses; PaO2/FiO2, partial pressure arterial oxygen/fraction of inspired oxygen.
Corresponds to minimum or maximum value, as appropriate, within 12 h of ICU admission. The variables in this Table were no transformed for your comparison.
APACHE II score to the severity of illness, the score is obtained by adding the following components 1) 12 clinical and laboratory variables each with a score range of 0–4 points (APS). The APS is determined from the worst physiologic values during the initial 24 h after ICU admission, 2) age with a range 0–6 points and 3) chronic health points if the patients have history of severe organ system insufficiency or is immunocompromised assign 5 points if the patients is no operative or emergency postoperative and 2 points for elective postoperative patients with a total score range of 0–71.
SOFA score corresponds to the severity of organ dysfunction, reflecting six organ systems each with a score range of 0–4 points (cardiovascular, hepatic, hematologic, respiratory, neurological, renal), with a total score range of 0–24.
Defined as a body mass index (calculated as weight in kilograms divided by height in meters squared) of 30 or greater.
Comparing the validation population with the original cohort population10 (Table 1), the validation population showed lower age, lower severity (APACHE) and organ dysfunction (SOFA) level, lower inflammatory status, and less development of complications such as shock and acute kidney injury (AKI). In contrast, the presence of hypertension, obesity, diabetes, chronic renal failure, and asthma were more frequent in the validation population. Ventilatory support was different between the 2 populations, with a decrease in the use of invasive mechanical ventilation (IMV) and an increase in the use of high-flow nasal cannulas (HFNC) and non-invasive ventilation (NIV) upon admission to the ICU in the validation population. Despite these characteristics, crude mortality in ICU was lower in the validation cohort but this difference did not achieve statistical significance (Table 1).
Application of unsupervised cluster analysis in validation populationThe 25 variables considered as predictors in the development of the original model10 were included in the new validation model, considering the same discretisation with respect to the original model. The variables categorized as independently associated with ICU mortality are shown in Table 2.
The application of unsupervised cluster analysis allowed the classification of patients in the validation population into 3 clinical phenotypes. Phenotype A (severe disease) included 1206 patients (51.8%), phenotype B (critical disease) included 618 patients (26.5%), while phenotype C (life-threatening disease) included the remaining 506 patients (21.7%). ICU mortality increased significantly from phenotype A (20.9%), B (29.4%) to C (39.5%, p < 0.001 for all comparisons).
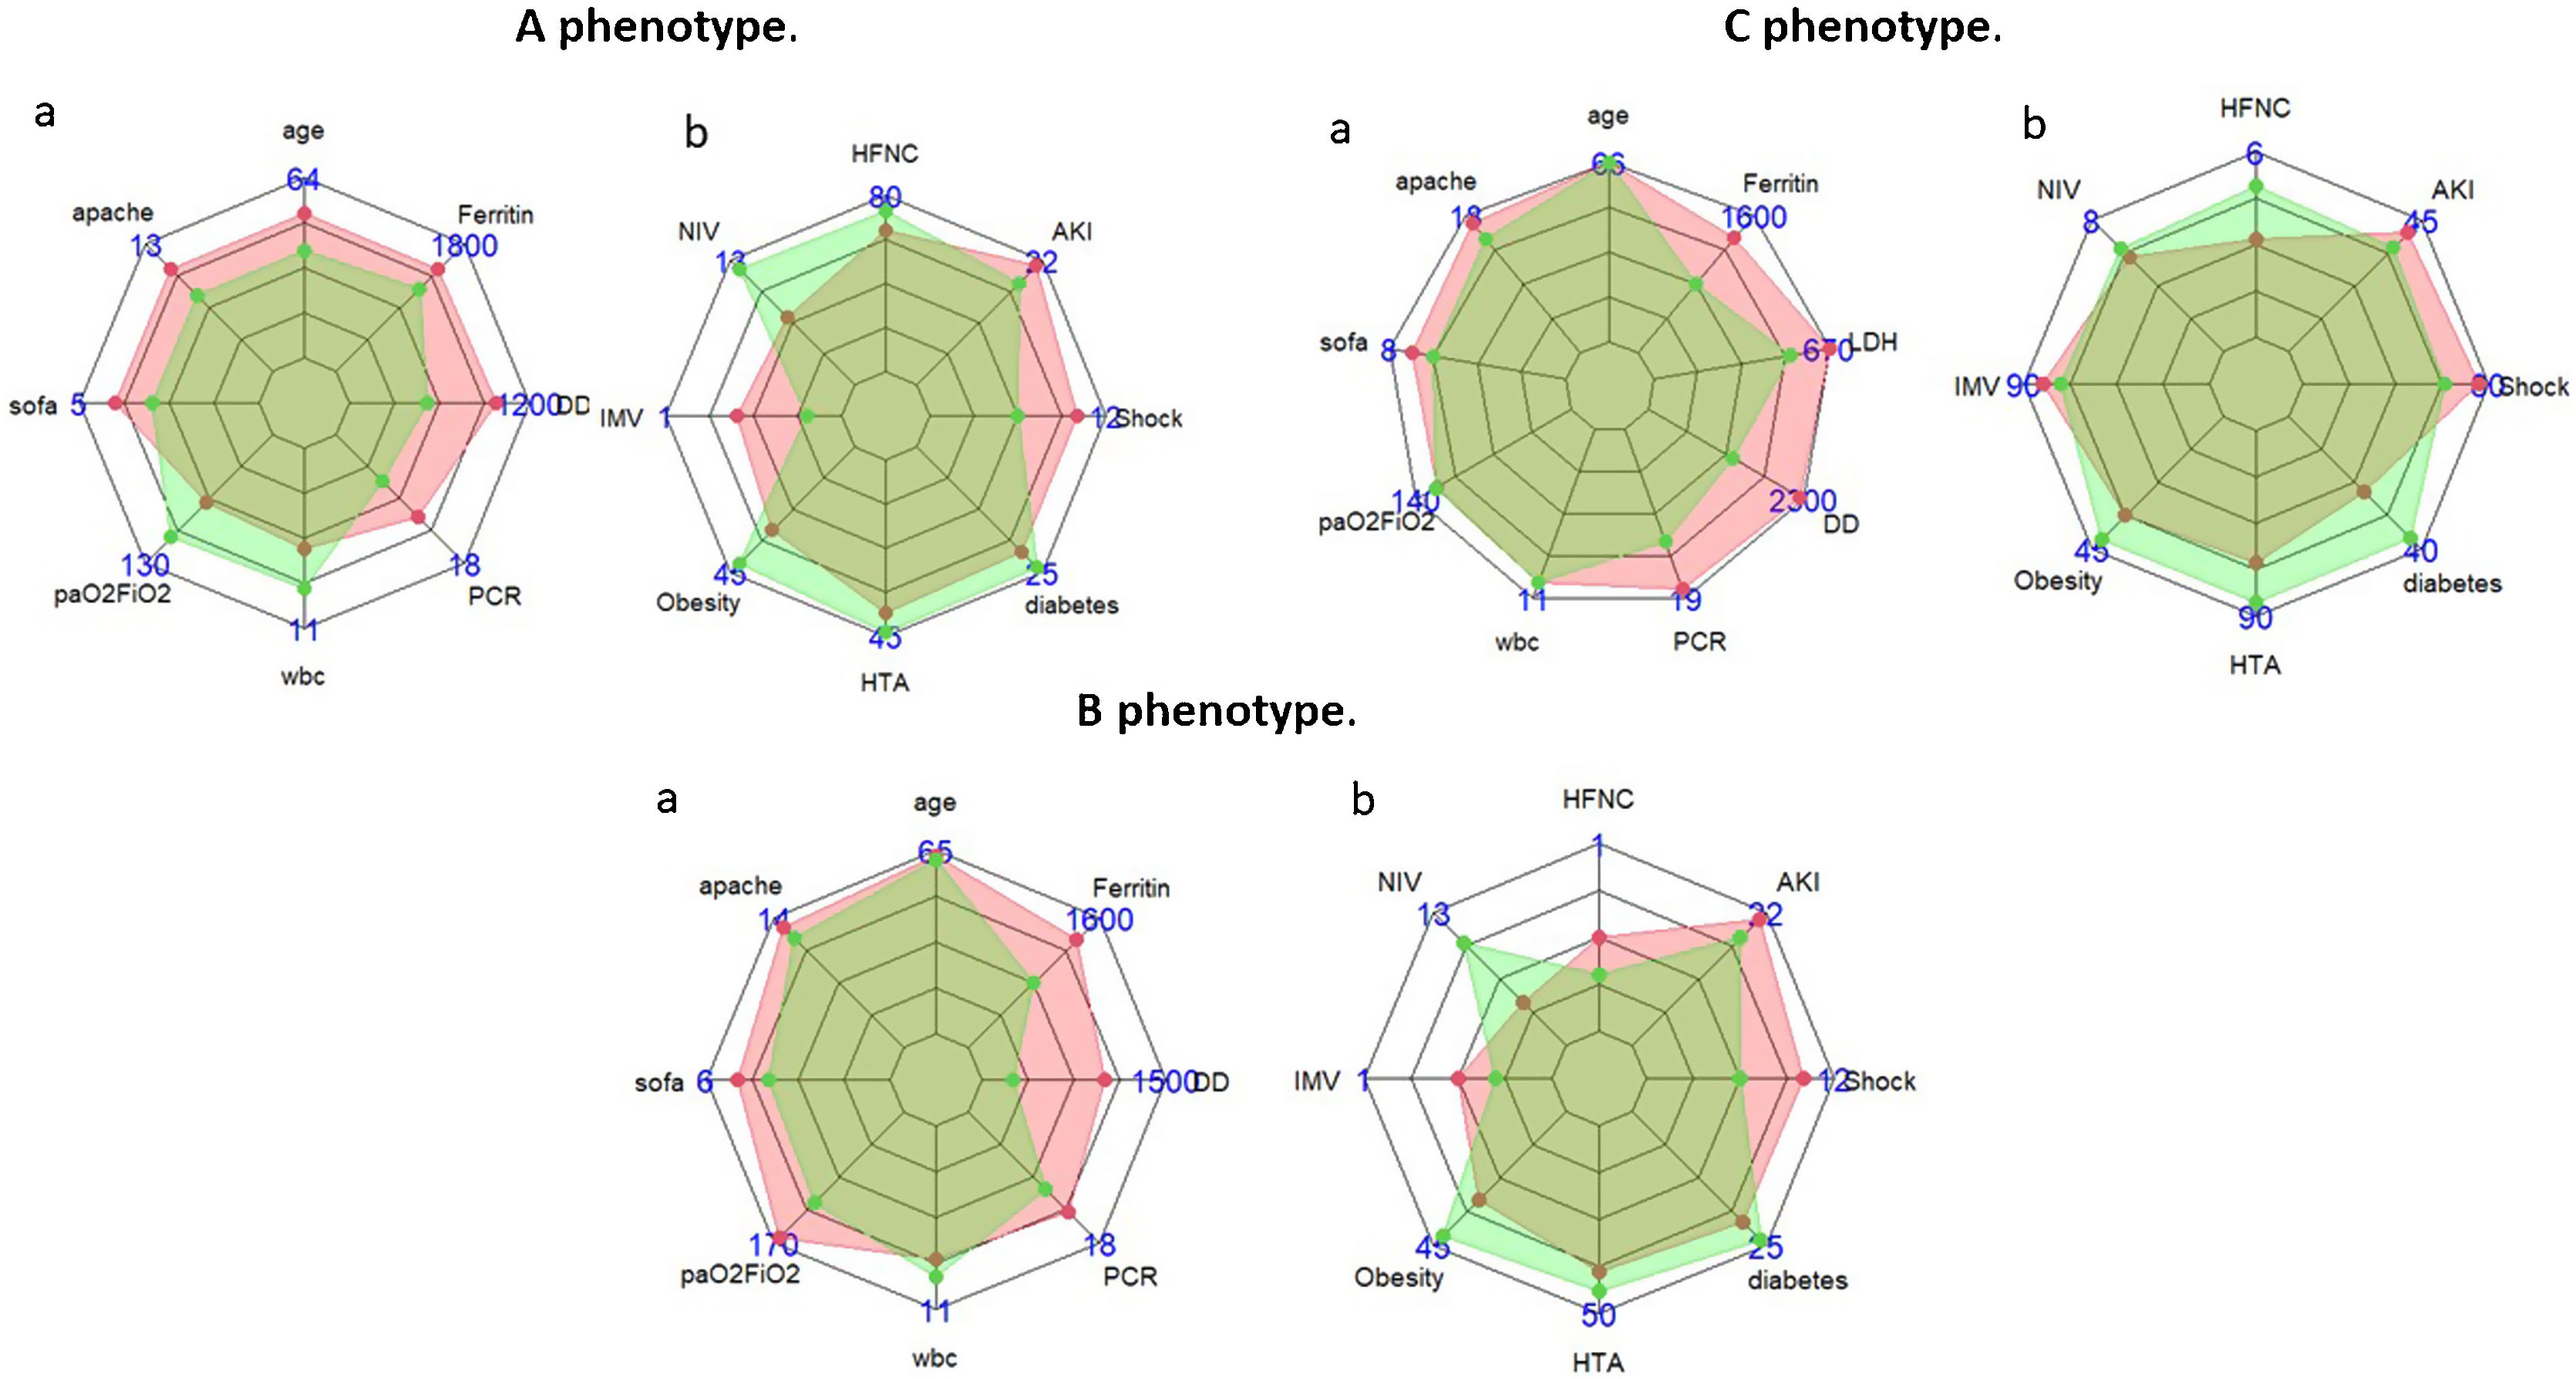
The 3 clinical phenotypes in the validation cohort in a lower dimensional space are shown in additional file (e-Fig. 9). The size and characteristics of the validation and original phenotypes in the 3-class model are shown in Table 1. The number of patients included in the validation phenotype A represented a significantly higher percentage of total of patients (59%) compared to the original phenotype A which only included 26.6% of the population (p < 0.001). Validation phenotype A patients were less severe, with lower levels of inflammation, less development of shock and similar frequency of comorbidities (except for obesity) compared to the original phenotype A patients (Table 1, Fig. 2, e-Figs. 3 and 4). Despite these differences, the crude ICU mortality of the validation phenotype A (20.9%) was not different from that of the original phenotype A (20.3%, p = 0.77).
 vs. validation (green area) cohort in A, B and C phenotype. (Data reported in median (a) or in percentage (b). (HFNC: high flow nasal cannula, AKI: acute kidney injury, SOFA: Sequential Organ Failure Assessment, APACHE II: Acute Physiology and Chronic Health Evaluation, HTA: arterial hypertension; DD: D dimer, PCR: reactive C-protein; NIV: non-invasive ventilation, IMV: invasive mechanical ventilation; LDH: lactic dehydrogenase; WBC: white blood cells).")
Characteristics of patients in original (pink area) vs. validation (green area) cohort in A, B and C phenotype. (Data reported in median (a) or in percentage (b). (HFNC: high flow nasal cannula, AKI: acute kidney injury, SOFA: Sequential Organ Failure Assessment, APACHE II: Acute Physiology and Chronic Health Evaluation, HTA: arterial hypertension; DD: D dimer, PCR: reactive C-protein; NIV: non-invasive ventilation, IMV: invasive mechanical ventilation; LDH: lactic dehydrogenase; WBC: white blood cells).
Patients classified within validation phenotype B represented a lower percentage of total of validation population (26.5%) compared to the original phenotype B (30.8, p < 0.001). Validation phenotype B patients were less severe, with lower levels of inflammation, less development of shock and similar frequency of comorbidities compared to the original phenotype B patients (Table 1, Fig. 2, e-Figs. 5 and 6). Despite these characteristics, no differences in crude ICU mortality were observed between the two phenotypes (25.5% vs 29.4%, p = 0.17 for phenotype B original and validation respectively). Finally, patients included in validation phenotype C represented a lower percentage of total of validation population (21.7%) respect of original phenotype C (42.5%, p < 0.001). Validation phenotype C patients were less severe, with lower levels of inflammation and less development of shock upon ICU admission. In contrast, the presence of hypertension, obesity, diabetes, chronic renal failure, coronary disease, chronic obstructive pulmonary disease, and asthma were more frequent in the validation C phenotype (Table 1, Fig. 2, e-Figs. 7 and 8). The ICU crude mortality was lower in validation C phenotype (39.5%) than original C phenotype (45.5%, p < 0.01).
The determination of the Si coefficient (silhouette analysis) allowed us to observe a mean value for the overall population of −0.007, with mean values of 0.4853490, −0.4575937 and −0.4109113 for phenotypes A, B and C respectively (Additional information in e-Tables 2 and 3 and e-Fig. 10). The graphical representation suggests that the classification performed is not adequate, since it has correctly classified only cluster A, but has misclassified 100% of the patients in clusters B and C. On the other hand, the graphical representation of the Si applied to the “Original” cohort (e-Fig. 10), although not optimal, shows that in each cluster there is a percentage of patients adequately classified.
Supervised predictive model validation- a)
Original GLM model
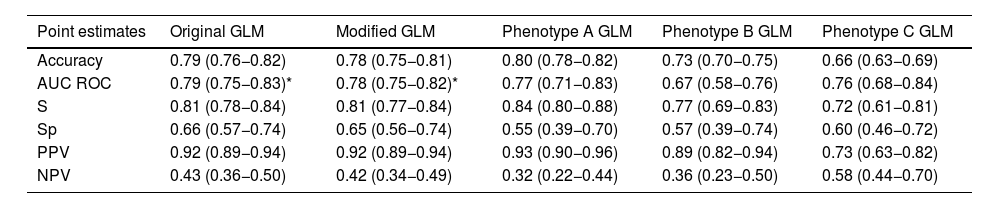
To further assess the robustness and usefulness of the new phenotypes developed, a GLM model was carried out. The 25 clinical and laboratory variables used for the clustering analysis were used as predictors in the original GLM (Additional file e-Tables 4 and 5). AKI (OR = 2.5 [1.9–4.4]), myocardial dysfunction (OR = 2.2 [1.4–3.3]), IMV (OR = 1.9 [1.4–2.6]), GAP–ICU (OR = 1.08 [1–03–1.12]), age (OR = 1.03 [1.02–1.05], RCP (OR = 1.02 [1.01–1.04] and PaO2/FiO2 (OR = 0.99 [0.99–1.0]) were variables associated with ICU mortality (Additional file e-Fig. 11). No collinearity was observed (Additional file e-Table 6) and the performance of the model are shown in Table 3 and Additional file (e-Table 7 and e-Fig. 12).
- b)
Modified GLM model with the inclusion of the phenotype classification.
Models (GLM) performance comparison.
| Point estimates | Original GLM | Modified GLM | Phenotype A GLM | Phenotype B GLM | Phenotype C GLM |
|---|---|---|---|---|---|
| Accuracy | 0.79 (0.76−0.82) | 0.78 (0.75−0.81) | 0.80 (0.78−0.82) | 0.73 (0.70−0.75) | 0.66 (0.63−0.69) |
| AUC ROC | 0.79 (0.75−0.83)* | 0.78 (0.75−0.82)* | 0.77 (0.71−0.83) | 0.67 (0.58−0.76) | 0.76 (0.68−0.84) |
| S | 0.81 (0.78−0.84) | 0.81 (0.77−0.84) | 0.84 (0.80−0.88) | 0.77 (0.69−0.83) | 0.72 (0.61−0.81) |
| Sp | 0.66 (0.57−0.74) | 0.65 (0.56−0.74) | 0.55 (0.39−0.70) | 0.57 (0.39−0.74) | 0.60 (0.46−0.72) |
| PPV | 0.92 (0.89−0.94) | 0.92 (0.89−0.94) | 0.93 (0.90−0.96) | 0.89 (0.82−0.94) | 0.73 (0.63−0.82) |
| NPV | 0.43 (0.36−0.50) | 0.42 (0.34−0.49) | 0.32 (0.22−0.44) | 0.36 (0.23−0.50) | 0.58 (0.44−0.70) |
AUC: area under curve, S: sensitivity, Sp: specificity, PPV: positive predictive value, NPV: negative predictive value.
When the phenotype variable was included in the model (modified GLM), it was observed that phenotype type was not associated with mortality, while the variables independently associated with mortality were the same as in the original GLM model (Additional file e-Table 8 and e-Fig. 13). No collinearity was observed (Additional file e-Table 9) and the performance of the model are shown in Table 3 and Additional file (e-Table 10 and e-Fig. 14).
- c)
GLM model in the A phenotype population
The characteristics of the patients classified within phenotype A according to the evolution in ICU can be seen in additional file (e-Table 11). When the GLM model was applied in this population (Additional file e-Table 12), it was observed that myocardial dysfunction (OR = 3.6 [1.8–7.2]), AKI (OR = 2.9 [1.8–4–6], age (OR = 1.03 [1.02–1.05]) and SOFA score (OR = 1.01 [1–1.01]) were variables associated with ICU mortality (Additional file e-Fig. 15). The performance of the model is shown in Table 3 and Additional file (e-Table 13 and e-Fig. 16).
- d)
GLM model in the B phenotype population
The characteristics of the patients classified within phenotype B according to the evolution in ICU can be seen in the additional file (e-Table 14). When the GLM model was applied in this population (Additional file e-Table 15), it was observed that presence of more than 3 quadrants infiltrates in chest X-ray (OR = 6.5 [1.1–37.7]), myocardial dysfunction (OR = 2.6 [1.05–6.8]), AKI (OR = 2.0 [1.08–3.8], arterial hypertension (OR = 1.9 [1.04–3.7]), age (OR = 1.04 [1.02–1.07]) and PCT (OR = 1.01 [1–1.01]) were variables associated with ICU mortality (Additional file e-Fig. 17). The performance of the model is shown in Table 3 and Additional file (e-Table 16 and e-Fig. 18).
- e)
GLM model in the C phenotype population
The characteristics of the patients classified within phenotype C according to the evolution in ICU can be seen in the additional file (e-Table 17). When the GLM model was applied in this population (Additional file e-Table 18), it was observed that AKI (OR = 4.4 [2.4–8.2], IMV (OR = 2.0 [1.06–3.9]), Angiotensin Converting Enzyme Inhibitors (ACEI) (OR = 1.9 [1.03–3.7]), GAP–ICU (OR = 1.1 [1.08–1.2]), age (OR = 1.05 [1.02–1.08]) and APACHE II (OR = 1.03 [1.01–1.05]) were variables associated with ICU mortality (Additional file e-Fig. 19). The performance of the model is shown in Table 3 and Additional file (e-Table 19 and e-Fig. 20).
Post-hoc analysisA detailed explanation of how to obtain the 2/3 wave cluster model can be found in the Supplementary material (Page 26). Although the appropriate number of clusters (3 clusters) is the same (e-Fig. 21), the classification of patients in each of the clusters was different (e-Fig. 22). Phenotypes A–C of the 2/3-wave model included 685 (29.4%), 1074 (46.1%) and 571 (24.5%) patients respectively instead of the 1206 (59.3%), 618 (30.4%) and 506 (24.3%) patients (24.3%) classified in phenotypes A, B and C by the validation model. Although ICU mortality increased significantly from phenotype A (19.9%), B (19.1%) to C (51.3%, p < 0.001 for all comparisons), this was similar to that observed for validation phenotype A (20.9, p = 0.58), but lower than that observed for validation phenotype B (29.4%, p < 0.001) and higher than that observed for validation phenotype C (39.5%, p < 0.001). The main characteristics of each phenotype of the 2/3 wave model are shown in the e-Table 22. Finally, the graphical representation of the silohuette coefficient showed that the classification was not adequate, but unlike what was observed for the validation model, the wave 2/3 model adequately classified a percentage of patients in each phenotype (e-Fig. 23).
DiscussionOur main finding was that the application of an unsupervised clustering model developed during the first pandemic wave of COVID-19 to a set of patients belonging to the second and third waves did not perform an adequate classification of patients within 3 original phenotypes. This is because the “Si” silhouette coefficients were close to or below zero and the characteristics of the new patients within each phenotype were significantly different from the original phenotypes. This strongly suggests the need to update models when new populations need to be considered.
Several authors have published the development of different immune and clinical phenotypes in patients with COVID-19 with a methodology similar to our study.4–12 Many of these studies have not validated the results5–9,11 and some of them4,10 have performed an external validation but with several limitations. Gutiérrez-Gutiérrez B et al.4 in an elegant study, which included 4035 consecutive adult patients admitted to 127 hospitals in Spain with COVID-19 (February 2–March 17, 2020) deploying 3 clinical phenotypes and performed external validation in a cohort of 2226 consecutive adult patients admitted from February 25 and April 19, 2020. Although the performance of the classification of validation patients within each phenotype was adequate (AUC ROC > 0.80), validation is performed in the same period corresponding to the first pandemic wave. The clinical characteristics of patients with COVID-19 and their evolution may vary over time, as observed in our study, either by the consequences of the change in management of the intensive care unit or by the variants of SARS-CoV-2 could affect the patient’s presentation, clinical course, and phenotypes of the patient. Therefore, these phenotypes should be validated again with populations of other pandemic waves.
To the best of our knowledge, only one study has validated phenotypes in 2 different waves. Wang et al.10 deploying 6 phenotypes in more than 20,000 patients with COVID-19 (not all hospitalised) during a period prior to August 28, 2020 (training sample — first wave) while validation was performed on patients collected between August 29 and October 31, 2020 (test sample — second wave). Although the authors conclude that the phenotypic latent class analysis (LCA) model was a better predictor of hospitalisation and progression to ICU admission or mortality than a risk assessment based solely on age and comorbidities, the concordance index in the test sample was as low as 0.56 and did not exceed 0.77 in any comparison. Suggesting, as observed in our study, that the non-inclusion of second wave patients in the original model results in inadequate model performance.
Patients affected by COVID-19, have great heterogeneity in their clinical presentation and high pathophysiological complexity. A thorough understanding of the complex biological systems present in these patients, requires conceptual and analytical strategies that respect this complexity. The identification of different clinical phenotypes emerges as a valid strategy that could provide guidance to personalise treatment and achieve the best outcomes.18 Unfortunately, machine learning methodologies for producing personalised diagnostics and therapeutics are still largely fragile, unexplainable, and often insufficiently validates.
As we observed in our study, the application of an unsupervised clustering model allows the classification of new patients into 3 different clinical phenotypes with different characteristics and evolution among them. The characteristics of the patients in each validation phenotype differ significantly from the phenotypes corresponding to the original classification. In addition, the characteristics of the patients in each validation cluster also differed from the cluster model specifically developed for the second and third waves in the post-hoc analysis.
The time frame of the study and restricted access to confounding factors involved in disease severity and clinical presentation need to be considered. In addition, morbidity and mortality could vary over time, either because of different treatments administered in the ICU, the strain circulating in a specific geographical area or the change in the recommended drug treatment for the disease. Finally, other recently described variants of SARS-CoV-26 could affect the presentation, clinical course, and phenotypes of patients. All these confounding factors, or as many as possible, should be included in the model if errors in risk classification of patients are to be avoided.
Even if artificial intelligence and machine learning are claimed to achieve indisputable results, they depend on the algorithms being defined accordingly and considering all confounding factors. It must be recognised that a small change in the characteristics of the test cases can have a considerable impact on the results of the model. As proposed by Feng et al.,19 machine learning (ML) and artificial intelligence (AI) algorithms have the potential to gain insights from clinical data and improve patient outcomes. However, these highly complex systems are sensitive to changes in the environment and can lose performance. Even after successful integration into clinical practice, ML/AI algorithms need to be continuously monitored and updated to ensure their long-term safety and effectiveness. Our results warn of the need for continuous validation of linear and non-linear models, as well as of the expiration of these models in the face of significant changes in the characteristics of the population.
In this context, many of the risk factors20–22 and treatment measures23,24 that clinicians are currently considering and administering to patients with COVID-19 were determined using patients from the first pandemic wave, without further validation. The importance of these variables may not be the same for patients from other pandemic waves, but, strikingly, the need to validate these important findings in new COVID-19 patient populations has not been raised.
Our study has several limitations that must be recognized. First, in the current study, we focus only on the data available on ICU admission, so we cannot exclude that a patient's clinical profile may change over time. However, our objective was to define the phenotypes at admission to the ICU because it is an opportune window to decide on eligibility for treatment. Second, we have only considered ICU patients and predominantly within a single country. Therefore, considering all the confounding variables that may vary between centres or regions, our results cannot be transferred without prior validation.
Thirdly, we cannot explain the differences observed between patients classified within each phenotype in the validation group because this classification is done by the model and in an unsupervised manner. However, the classification is better when a specific model is developed for new patients, and this is in favour of an inadequate classification when applying the original model in the validation population.
Fourth, we have only assessed mortality of phenotypes at ICU discharge, so these results cannot be transferred to in-hospital mortality. However, our aim was to evaluate phenotypes and their mortality in ICU.
Fifth, the observed clinical phenotypes could reflect different profiles of virus-host interactions, because of a different infectious viral load, a variable humoral and cellular immune response against SARS-CoV-2, or cellular receptor characteristics and expression, together with the genetic background of the host that have not been considered in our database. Although information on underlying immunological or virological mechanisms may be of great interest for phenotype development,5 at the time of patient admission to the ICU, these data are not available, therefore, rapid determination of clinical phenotypes retains its value and can help decide on treatment eligibility in clinical practice.
ConclusionOur results suggest that classification or risk models developed using machine learning techniques during the first pandemic wave cannot be applied with adequate performance to patients admitted in subsequent waves. Our study alerts researchers to the need to validate the results and continuously update the models to ensure adequate performance.
Trial registrationThe study was retrospectively registered (NCT 04948242) on June 30, 2021
Ethical approval and consent to participateThe study was approved by Institution’s Internal Review Board (Comitè Ètic d’Investigació amb Medicaments [CEIm] from Institut d’Investigació Sanitària Pere Virgili [IISPV] — IRB# CEIM/066/2020) and each participating site with a waiver of informed consent.
Availability of supporting dataThe data supporting the conclusions of this study are available from the Sociedad de Medicina Intensiva, Critica y Unidades Coronarias (SEMICYUC), but restrictions apply to the availability of these data, which were used under SEMICYUC authorization for the present study and are therefore not publicly available. However, the data can be obtained from the corresponding author (AR) upon reasonable request and with the permission of SEMICYUC.
FundingThis study was supported by the Spanish Intensive Care Society (SEMICYUC) and Ricardo Barri Casanovas Foundation (AR, MB). The study sponsors have no role in the study design, data collection, data analysis, data interpretation, or writing of the report.
Authors’ contributionsRA, GJ, FA, DE, SVJ, ZR, PE, SB, VM, JHM, AMA, CBA, dVOM, BJC, SCS, PLJC, EA, MLI and BM had substantial contributions to conception and design of the work.
RA, TS, GJ, DE and FA had substantial contribution for data acquisition.
RA, GJ, MLI, DE and BM had substantial contribution for data analysis and interpretation of data for the work.
RA, MLI, SVJ, DE and GJ drafting of the manuscript.
ZR, SB, AMA, CBA, SCS, LAL, EA and PLJC critically reviewed the draft manuscript.
The corresponding author (RA) had full access to all the data in the study and takes responsibility for the integrity of the data and the accuracy of the data analysis. All authors approved the final version of the manuscript. The views expressed in this article are those of the authors and not necessarily those of the SEMICYUC.
Conflict of interestThe authors declared no conflict of interest.
To Alexis Garduno for English manuscript edition and to the COVID-19 SEMICYUC Investigators listed in Appendix A.
The following are Supplementary data to this article:
articles