


Cystatin C is increasingly used as a marker of renal function as a complement to serum creatinine and glomerular filtration rate (GFR). We have assessed its efficacy as a predictor of mortality in a group of patients with increased cystatin C but GFR>60mL/min.
Design and methodsWe included 608 patients, 65.9% male, 34.6% had diabetes mellitus. The mean age was 58.5±14.5 years and a mean GFR of 64.1±33.5mL/min. Patients were divided into 3 groups: CONTROL (normal cystatin C and GFR>60mL/min, age 53.3±12.8 years, GFR 96.6±22.4mL/min, n=193), INCREASED CYSTATIN (cystatin C>1.03mg/L and GFR>60mL/min, age 58.9±13,1 years, GFR 72.2±10.4mL/min, n=40) and CKD (chronic kidney disease, increased cystatin C and GFR<60mL/min, age 61.4±14.8 years, GFR 36.0±12.7mL/min, n=160). The relationship with overall mortality was analyzed using the Kaplan–Meier method.
ResultsMean cystatin C was 0.75±0.13 versus 1.79±0.54 in CKD group and 1.14±0.14mg/L, p<0.001). In CONTROL group survival was 93.9% at 5 y, compared to 78.8% in the ERC group and 82.3% in the INCREASED CYSTATIN group (p<0.001) Five-year survival before renal replacement therapy was also different for the ERC group (73%, p<0.001 Log Rank) but not between the other two groups (CONTROL 99.0%, INCREASED CYSTATIN 94.3% p=0.08).
ConclusionsIncreased plasmatic levels of cystatin C in patients with GFR>60mL/min was a predictor of increased mortality but not of progression to end-stage renal failure. These results confirm the interest of routinely measuring cystatin C.
La cistatina C se utiliza cada vez más como marcador de la función renal como complemento de la creatinina sérica y la tasa de filtración glomerular (TFG). Hemos evaluado su eficacia como predictor de mortalidad en un grupo de pacientes con cistatina C aumentada, pero con TFG>60mL/min.
Diseño y métodosSe incluyeron 608 pacientes, 65,9% varones, 34,6% tenían diabetes mellitus. La edad media era de 58,5±14,5 años y el TFG medio de 64,1±33,5mL/min. Los pacientes se dividieron en tres grupos CONTROL (cistatina C normal y TFG>60mL/min, edad 53,3±12,8 años, TFG 96,6±22,4mL/min, n=193), CISTATINA AUMENTADA (cistatina C >1,03mg/L y TFG>60mL/min, edad 58, 9±13,1 años, TFG 72,2±10,4mL/min, n=40) y enfermedad renal crónica (ERC) (cistatina C aumentada y TFG<60mL/min, edad 61,4±14,8 años, TFG 36,0±12,7mL/min, n=160). La relación con la mortalidad global se analizó mediante el método de Kaplan-Meier.
ResultadosLa cistatina C media fue de 0,75±0,13 vs. 1,79±0,54 en el grupo ERC y 1,14±0,14mg/L, p<0,001). En el grupo CONTROL la supervivencia fue de 93,9% a los cinco años, vs. 78,8% en el grupo ERC y 82,3% en el grupo CISTATINA AUMENTADA (p<0,001). La supervivencia a los cinco años antes del tratamiento renal sustitutivo también fue diferente para el grupo ERC (73%, p<0,001 Log Rank) pero no entre los otros dos grupos (CONTROL 99,0%, CISTATINA AUMENTADA 94,3% p=0,08).
ConclusionesEl aumento de los niveles plasmáticos de cistatina C en pacientes con TFG>60mL/min fue un factor predictivo de mayor mortalidad, pero no de progresión a insuficiencia renal terminal. Estos resultados confirman el interés de medir sistemáticamente la cistatina C.
Chronic kidney disease (CKD) affects 10% of the world’s population and is among the top 10 non-communicable diseases contributing to morbidity and disability.1 Its incidence is increasing worldwide, and mortality due to CKD increased between 2005 and 2017 from 0.9 million to 1.2 million deaths annually.2
Serum creatinine and creatinine clearance were first used to assess renal function by the Danish physiologists Rehberg and Holten in the mid-1920s. Serum creatinine is the only renal plasma biomarker currently used in daily clinical practice to estimate glomerular filtration rate (GFR). However, interpreting serum creatinine results correctly can still prove difficult. Creatinine clearance is a relatively easy method to estimate GFR but has some important limitations (i.e. tubular creatinine secretion, which is variable from subject to subject). Creatinine clearance systematically overestimates the measured GFR and this overestimation is greatest at low GFR levels.3 Currently, creatinine-based equations, especially the Modification of Diet in Renal Disease (MDRD) and Chronic Kidney Disease Epidemiology Collaboration (CKD-EPI) equations, are used worldwide to estimate GFR.4
Cystatin C is an interesting new marker for estimating GFR. It offers several advantages over creatinine or other proteins of similar molecular weight. Cystatin C is produced by all nucleated cells in the human body and, since the protein is encoded by a housekeeping gene (i.e. a gene that expresses in both a constitutive and an unregulated manner), cystatin C is considered to be constantly produced.5 After being filtered without restriction by the glomeruli due to its low molecular mass and lack of protein binding, cystatin C is reabsorbed in its entirety by the proximal tubules, where it is almost entirely catabolised.6 The current Kidney Disease: Improving Global Outcomes (KDIGO) guidelines for CKD suggest measuring cystatin C in adults with a GFR of 45–59mL/min/1.73m2 with absence of kidney damage markers if confirmation of CKD is required.7
The proportion of patients with GFR-defined CKD who progress to end-stage renal disease is extremely small. The KDIGO guidelines recognised the importance of albuminuria and aetiological diagnosis as well as GFR. A table was designed to categorise risk in CKD populations using the GFR group and albuminuria severity, although the evidence was not graded.5 We have attempted to assess the value of isolated elevated plasma levels of cystatin C in patients with a normal plasma creatinine level and an estimated GFR greater than 60mL/min as a marker of renal risk.
Design and methodsA group of 608 patients were studied: 401 males and 207 females; mean age was 53.3±12.8 years; 34.6% had diabetes mellitus. Serum cystatin C was measured with a BNII nephelometer (Dade Behring Inc., Deerfield, IL, USA) using a particle-enhanced immunonephelometric assay (N Latex Cystatin-C). The range of the assay is 0.195–7.330mg/L, with the reference range for healthy young individuals being 0.53–0.95mg/L. Albuminuria was measured at 24-h urine collection and 18.5% showed increased urinary albumin excretion (≥30mg/day). GFR was estimated from serum creatinine using the CKD-EPI equation for each sex. Only Caucasian patients were included in the study, so race was not included in the calculation.
Patients were classified according to KDIGO stages of CKD: 13.6% were stage IV or V, 30.9% were stage III, and the remaining patients had a GFR greater than 60mL/min (39.1%). The cut-off point for the highest quartile of serum cystatin C distribution was 1.03mg/L. GFR was estimated from cystatin C using the CKD-EPI formulation for cystatin C. Microalbuminuria was defined as a urinary excretion of albumin >30 and <300mg/day; macroalbuminuria was diagnosed when albuminuria was equal to or greater than 300mg/day.
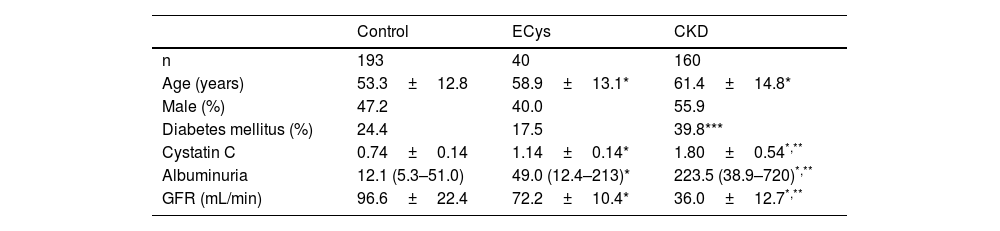
Patients were divided into three groups CONTROL (normal cystatin C levels and GFR>60mL/min, n=193), ELEVATED CYSTATIN (ECys) (cystatin C higher than 1.03mg/L, but GFR>60mL/min, n=40) and CKD (cystatin C higher than 1.03mg/g, but GFR>60mL/min, n=40) and CKD (cystatin C greater than 1.03mg/g and FG<60mL/min, n=160). Table 1 shows the characteristics of each group. Most of the patients in the CONTROL group were patients with no pathology detected or under follow-up for arterial hypertension or lithiasis without deterioration of renal function.
Demographic and Clinical Characteristics of the Groups.
All procedures performed in the studies with human participants conformed to the ethical standards of the institutional and/or national research committee and to the 1964 Helsinki declaration and its subsequent amendments or comparable ethical standards. Ethical approval was provided by the Ethics Committee of the University of Extremadura (#21/2014).
StatisticsResults are expressed as mean±1 standard deviation. All statistical tests were two-sided. p-Values less than 0.05 were considered significant. For comparisons between groups, the ANOVA test and Bonferroni post hoc analysis were used for continuous variables and the X-test2 for categorical variables. Since the Kolmogorov–Smirnov Z-test determined that albuminuria did not follow a normal distribution, the Kruskall-Wallis test was used to compare values. These parameters are expressed as median (interquartile range [IQR]).
Kaplan–Meier survival analysis was used to calculate survival before death and survival to CKD stage V according to KDIGO or renal replacement therapy. Associations between the three patient subgroups and the risk of death or of reaching renal replacement therapy were assessed using the Cox proportional hazards survival model. Hazard ratios (HRs) and corresponding 95% confidence intervals (CIs) were calculated, and a p-value<0.05 was considered statistically significant. All variables that reached a significance level of p<0.1 in the univariate analysis were considered for inclusion in the construction of the Cox model. Data were analysed with the IBM® SPSS® Statistics V.21 (IBM Corporation, Armonk, NY, USA).
ResultsMedian follow-up time was 72 months (IQR 60–76). Median plasma cystatin in the CONTROL group was 0.74±0.14mg/L, vs. 1.80±0.54 (CKD group) and 1.14±0.14mg/L (ECys group) (p<0.001 ANOVA). The control group was younger than the other groups (p<0.001, ANOVA). Urinary albumin excretion was higher in the CKD group than in the others (see Table 1 for values and significance). Mean GFR of cystatin C was 67.0±7.8mL/min for the ECys group, 107.1±22.6 for the control group (p<0.001 vs. other groups, ANOVA) and 44.1±13.2 for the CKD (p<0.001 vs. other groups, ANOVA); 18.1% of patients in the CONTROL group vs. 20% of patients in the ECys group had an inflammatory disease (glomerulonephritis or vasculitis type), the difference is not significant (X2 test).
In the CKD group, 63.1% (95% CI: 55.4–70.2) of patients were in KDIGO stage 3, 35.6% (95% CI: 28.6–43.3) in stage 4, and only two in stage 5 (1.25, 95% CI: 0.03–4.44). In the CONTROL group, 21.8% (95% CI: 16.5–28.4) of patients had microalbuminuria and 12.8% (95% CI: 8.7–18.3) macroalbuminuria; in CKD, 36.2% (95% CI: 29.0–44.1) of patients had microalbuminuria and 40.8% (95% CI: 33.3–48.8) macroalbuminuria; 8% (95% CI: 33.3–48.7); and in the ECys group 42.1% (95% CI: 27.9–57.8) of patients had microalbuminuria and 18.4% (95% CI: 9.2–33.4) macroalbuminuria (p<0.001, X2-test).
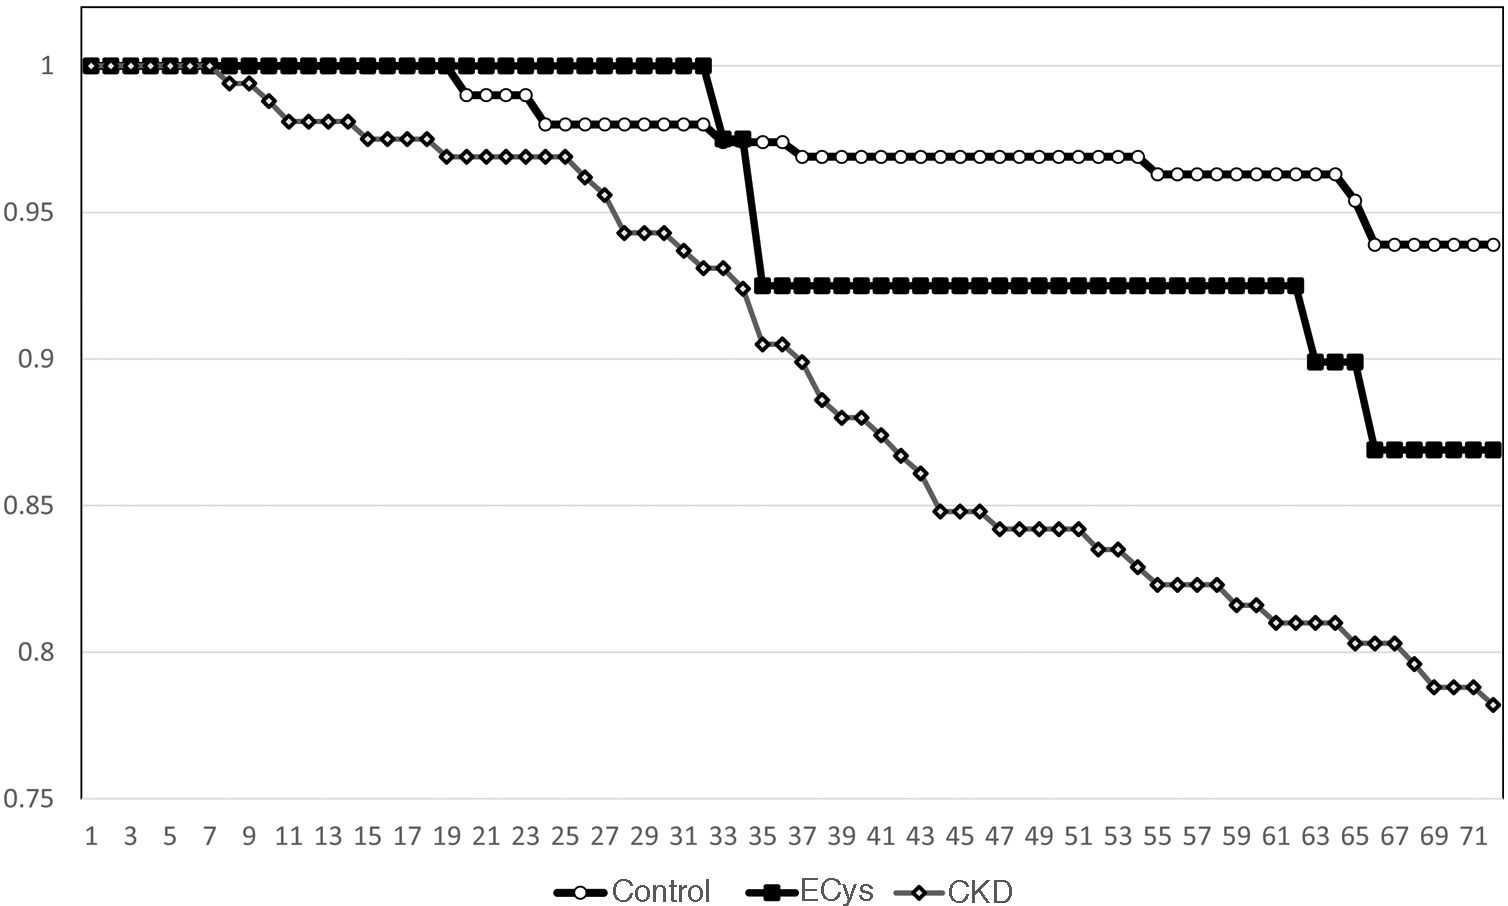
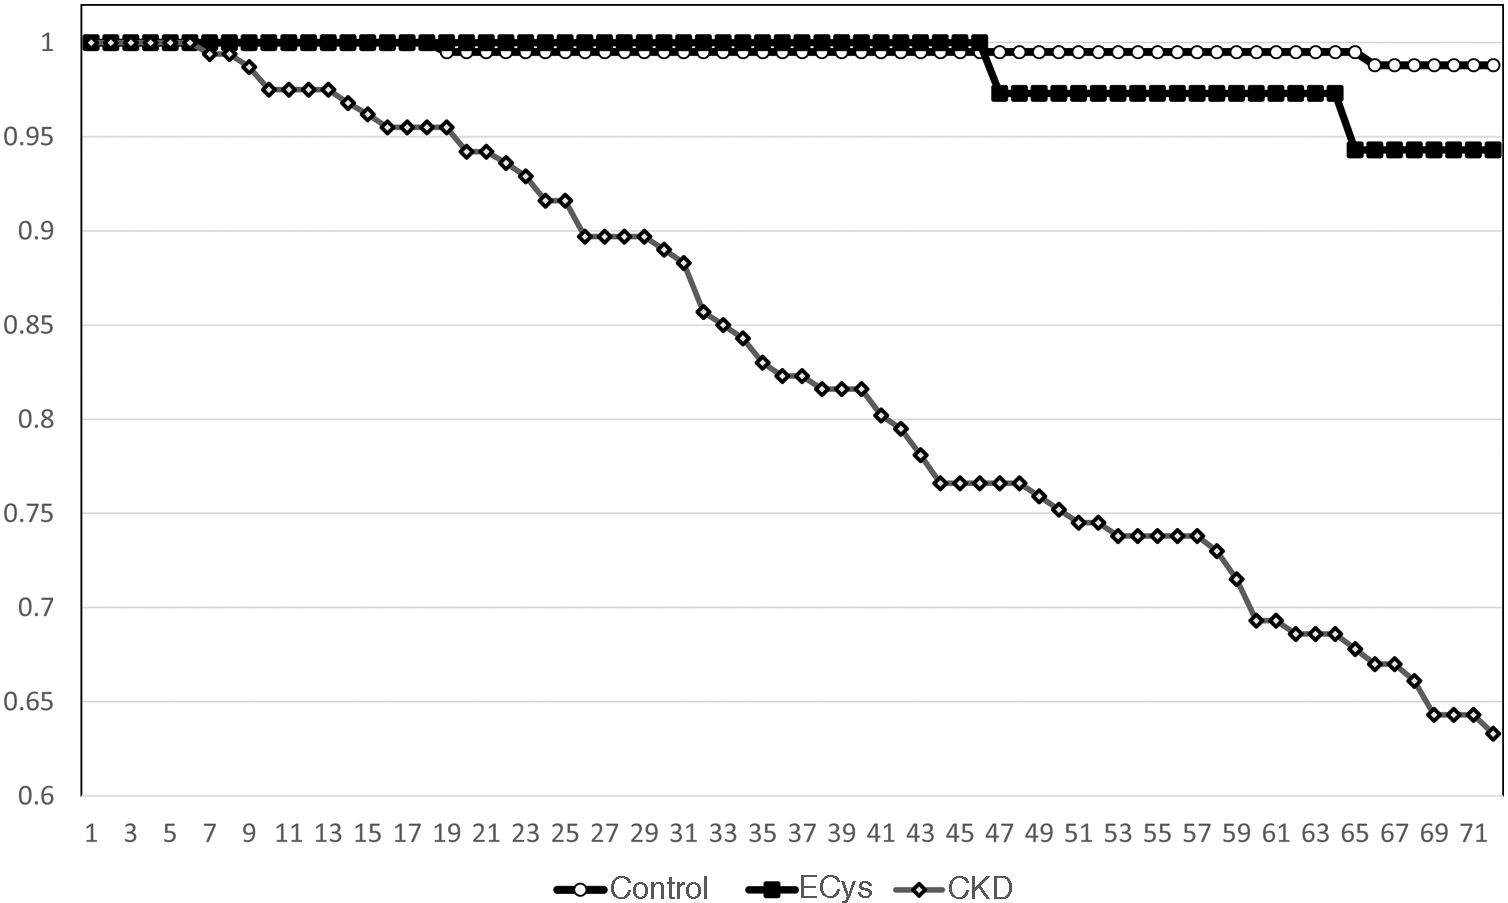
Kaplan–Meier survival for overall mortality at five years was 93.9% for the CONTROL group, 78.8% for the CKD group and 82.3% in the ECys group (p<0.001, Log Rank test for the difference between the CONTROL and ECys groups) (Fig. 1). Regarding survival before starting renal replacement therapy or reaching KDIGO stage V, the Kaplan–Meier method shows a 5-year survival of 99.0% for the CONTROL group, 73.0% for the CKD group and 94.3% in the ECys group (p<0.001 Log Rank for the CKD group, no difference between ECys and CONTROL, p=0.08) (Fig. 2). When a separate analysis was performed including only patients without albuminuria in the control group, 5-year survival increased to 97.0% (p<0.01, Log Rank).

.")
In the overall sample, after adjusting for potential confounders, Cox analysis showed a significant association of elevated cystatin C levels with mortality (p<0.001), only age and diabetes mellitus also showed a significant association (Table 2). In contrast, after adjusting for potential confounders, survival to renal replacement therapy was significantly associated with cystatin C levels (p=0.008), GFR measured by the CKD-EPI equation and urinary albumin excretion (see Table 3 for significance).
Cox analysis for survival before renal replacement therapy.
| B | Exp. B | Confidence interval | p | |
|---|---|---|---|---|
| Age (years) | −0.021 | 0.980 | 0.959–1001 | 0.064 |
| Male (%) | −0.296 | 0.744 | 0.426–1129 | 0.298 |
| Diabetes mellitus (%) | 0.478 | 1613 | 0.870–2993 | 0.129 |
| Cystatin C | 0.887 | 2.428 | 1333–4424 | 0.004 |
| TFG | −0.055 | 0.947 | 0.923–0.971 | <0.0001 |
| Albuminuria | 0.001 | 1001 | 1000 | <0.0001 |
We observed that in a group of patients with elevated plasma cystatin C levels and GFR greater than 60mL/min, mortality was higher than in patients with normal cystatin C levels and GFR>60mL/min. In contrast, the risk of CKD progression was not higher in the ECys group. Patients with elevated cystatin C levels and reduced GFR have the highest risk of mortality and progression to KDIGO stage V CKD or initiation of renal replacement therapy.
The renal system performs several physiological functions, but GFR is considered the best overall renal function parameter and for this reason its assessment has become an important tool in clinical practice. GFR cannot be measured directly but must be estimated by clearance of filtration markers.8 In any case, clinical assessment of GFR can help the clinician to estimate the degree of renal dysfunction and/or progression of established renal disease. Several creatinine-based equations have been developed in an attempt to improve the estimation of GFR from serum creatinine. The current KDIGO guidelines recommend the CKD-EPI equation,7 which is the one we have selected. In this regard, the current definition of CKD is a GFR<60mL/min for more than three months and this is the threshold that was selected to divide the study groups.9 The use of the combined CKD-EPI-creatinine-cystatin C equation is also recommended,7 The use of the combined CKD-EPI-creatinine-cystatin C equation is also recommended,7 however, we thought it advisable to avoid it in this study as it could introduce a degree of confounding when we were trying to differentiate the prognostic value of GFR measured by creatinine and plasma cystatin C levels.
Patients with CKD are at a significant risk of cardiovascular events: 50% of all patients with stage 4–5 CKD have cardiovascular disease and cardiovascular mortality accounts for 40%–50% of all deaths in patients with advanced CKD (stage 4) as well as end-stage renal disease (stage 5), compared to 26% in controls with normal renal function. Mortality from heart failure and valvular heart disease increased as GFR decreased, as did mortality from infectious diseases and other causes, while mortality from cancer decreased. The cut-off point used was, as in our study, a GFR<60mL/min, but mortality increases especially when GFR falls below 45mL/min.10 Therefore, it could explain why mortality is higher in the CKD group, but it cannot shed light on the relationship between higher plasma cystatin levels (and with a GFR above 60mL/min) and mortality.
Cystatin C is an interesting marker for estimating GFR. It offers several advantages over creatinine or other proteins of similar molecular weight. It is produced by all nucleated cells in the human body and is considered to be in constant production. After being unrestrictedly filtered by the glomeruli due to its low molecular mass and lack of protein binding, cystatin C is reabsorbed in its entirety by the proximal tubules, where it is almost entirely catabolised.6 Current KDIGO guidelines for CKD suggest measuring cystatin C in adults with a GFR of 45–59mL/min/1.73m2 who do not have markers of kidney damage if CKD needs to be confirmed.7 Cystatin C is also a marker of cardiovascular risk. This association persists even with further exclusion of people with CKD or microalbuminuria.11
However, these two cystatin C capacities do not seem to be correlated in our study. In fact, mortality was independently associated with cystatin C levels, but this relationship was not found with GFR or albuminuria. These results can be interpreted in several ways. First, people with elevated cystatin C levels but without CKD may have preclinical CKD and an associated high-risk factor burden similar to that of people with CKD. Due to the measurement error involved in GFR quantification, it is also possible that people with elevated cystatin C levels but with a GFR that is not in the CKD range are more accurately classified as renal patients using cystatin C levels.12 However, this hypothesis seems unlikely, as GFR calculated from cystatin C or creatinine yielded very close results. Furthermore, cystatin C – without a decrease in GFR – is not associated with CKD progression. Another possibility is that elevated cystatin C in people without CKD is the result of extra-renal sources of cystatin C variability and therefore unrelated to renal function. There is some evidence that serum cystatin C level is heritable and elevated serum cystatin C levels have been associated with most of the major cardiovascular risk factors.11
Increased urinary albumin excretion in diabetic patients is a predictor of progression of diabetic nephropathy and also a strong independent risk factor for cardiovascular morbidity and mortality.13–15 Urinary albumin excretion has been shown to predict cardiovascular events in non-diabetic hypertensive patients, and a continuous relationship between urinary albumin excretion and cardiovascular mortality as well as overall mortality has been demonstrated in a general population study.16–20 Therefore, it is now recommended to look for microalbuminuria, due to evidence that it may be a sensitive marker of target organ damage, not only in diabetes but also in hypertension.21,22 Therefore, the current KDIGO Clinical Practice Guidelines for the Evaluation and Management of CKD states that GFR and albuminuria should be assessed at least annually in people with CKD. In addition, GFR and albuminuria should be assessed more frequently in individuals at higher risk of progression and/or in cases where the measurement influences therapeutic decisions.5 Although a significant proportion of CONTROL and ECys subjects had increased urinary albumin excretion in our study, this was not associated with the risk of mortality, but was significantly related to CKD progression.
There are biological and clinical aspects that limit the use of cystatin C such as obesity, thyroid dysfunction, systemic inflammation and corticosteroid treatment.11 As noted above, the percentage of patients with inflammatory diseases, and therefore corticosteroid treatment, was similar between the CONTROL and elevated Cystatin C groups without GFR reduction. There is conflicting evidence regarding the possible effect of diabetes mellitus on serum cystatin C values. Although positively associated with an increased prevalence of diabetes in middle-aged and older adults, Magnusson et al.23,24 found an association of serum cystatin C with metabolic syndrome, but not with type 2 diabetes. However, causal associations with adverse outcomes could not be demonstrated in genome-wide association studies, indicating that elevated serum cystatin C concentrations mainly reflect renal damage.25 On the other hand, there was no difference in the percentage of diabetics between the CONTROL group and the isolated elevated cystatin C group.
The average limitation of this study is the small sample size with elevated cystatin C levels and GFR below 60mL/min. However, this type of patient is rare in clinical practice and therefore the resulting information is of greater importance for our results. In fact, few data have been reported on this issue. Shlipak et al.12 used data from the Cardiovascular Health Study in which, at baseline, 78% of participants had an estimated GFR> or =60mL/min. Cystatin C concentrations showed strong associations with death, cardiovascular death and major cardiovascular events among these participants. Serum creatinine concentrations had much weaker associations with each outcome and only predicted cardiovascular death. This study did not measure albuminuria, so our study, which included this parameter, provides valuable data on the relationship of cystatin C and mortality. Unfortunately, we were unable to include comorbidity indices in the study, which could have helped to clarify the value of isolated cystatin C as a risk factor, although it was probably slightly higher since there is a difference in age compared to the control group, but not compared to the group with reduced GFR.
The fact that we used patients with hypertension as controls, despite their higher cardiovascular risk, gives added strength to our results.
ConclusionsCystatin C is a good mortality marker in patients without kidney disease defined as a GFR less than 60mL/min. In this group of patients, neither GFR nor albuminuria showed an independent effect. In contrast, albuminuria and baseline GFR, as well as cystatin C, were prognostic markers of renal disease progression in CKD patients. Isolated plasma levels of cystatin C are a good marker of mortality but are not associated with an increased risk of CKD.
Conflict of interestThe authors declare that they have no conflicts of interest.
FundingThis work has been supported in part by grants PI18/00745, PI22/00181 and RD21/0005/0031 from the Instituto de Salud Carlos III, Madrid (Spain), funded by the European Union-NextGeneration EU, Recovery and Resilience Mechanism; grant GR21026 from the Junta de Extremadura, Mérida (Spain) and the European Regional Development Fund (ERDF) “A way for Europe”.
