


Hyperglycaemia in hospitalized patients with type 2 diabetes is preferably managed with insulin. We aimed to analyse the glycaemic efficacy, treatment simplicity, and safety of our hospital's antihyperglycemic regimens (linagliptin-basal insulin versus basal-bolus insulin) in patients with type 2 diabetes admitted for heart failure decompensation.
Patients and methodsIn this real-world study, we included patients with mild-to-moderate hyperglycaemia managed with our antihyperglycemic regimens between 2016 and 2018. To match patients who started one of the regimens, a propensity matching analysis was used.
ResultsAfter propensity matching, 146 patients were included in each group. There were no differences in mean blood glucose levels (163.6±21.2 vs 159.6±19.2mg/dl, p=.210). Patients on the linagliptin-basal insulin regimen had a lower total number of hypoglycaemic episodes (36 vs 64, p<.001), lower total insulin dose (24.1±5.3 vs 32.0±5.6 units, p<.001), and lower number of daily injections (2.4±.8 vs 4.0±.0, p<.001) than those on the basal-bolus regimen.
ConclusionsLinagliptin-basal insulin was a safe, simple, and efficacious regimen and could be considered standard of care for these vulnerable, high complex patients to simplify in-hospital management.
La hiperglucemia hospitalaria se maneja preferiblemente con insulina. Nuestro objetivo fue analizar la eficacia glucémica, simplificación del tratamiento y seguridad de los regímenes hospitalarios de manejo de la hiperglucemia (insulina basal-linagliptina versus insulina basal-bolo) en pacientes con diabetes mellitus de tipo 2 ingresados por insuficiencia cardíaca descompensada.
Material y métodosEn este estudio de vida real, se incluyó a pacientes con hiperglucemia leve/moderada manejados con nuestros regímenes entre 2016 y 2018. Para emparejar a los pacientes que comenzaban alguno de los regímenes se usó un análisis de propensiones.
ResultadosTras el análisis de propensiones, 146 pacientes fueron incluidos en cada grupo. No hubo diferencias en los niveles de glucosa medios (163,6±21,2 vs. 159,6±19,2mg/dl; p=0,210). Los pacientes con el régimen de insulina basal-linagliptina tuvieron menos hipoglucemias (36 vs. 64; p<0,001), menos insulina total (24,1±5,3 vs. 32±5,6 unidades; p<0,001) y menos inyecciones diarias (2,4±0,8 vs. 4±0; p<0,001) que los pacientes del régimen basal-bolo.
ConclusionesEl régimen de insulina basal-linagliptina fue seguro, simple y eficaz y podría ser considerado como tratamiento de referencia para estos pacientes vulnerables y con alta complejidad clínica, con lo que se simplificaría el manejo hospitalario.
Patients with type 2 diabetes (T2D) and heart failure (HF) are at high risk of adverse outcomes and hospitalization.1 Improved glycaemic control has been reported to reduce deaths and complications in hospitalized patients independently of the hemodynamic status.2
In non-critically ill patients with T2D, the multidose insulin regimen using once-daily basal insulin and bolus of rapid-acting insulin before meals is currently the preferred therapy for treating hyperglycaemia.3 Although this regimen has shown significant improvements in glycaemic control and reductions in complications,2 it is time- and labour-intensive and has been linked a higher risk of hypoglycaemia.4
The contraindications and relevant side effects of most non-insulin glucose-lowering drugs have limited their implementation in the hospital setting.3 However, in recent years, dipeptidyl peptidase-4 inhibitors (DPP-4i) alone or in combination with basal insulin have been demonstrated to be efficacious and safe.5–8 Based on this evidence and the fact that patients admitted for acute decompensated heart failure (ADHF) are more likely to suffer potential drug-related harm due to their polymorbididy and polypharmacy,9 we aimed to retrospectively analyze the glycemic efficacy (daily blood glucose (BG) levels during hospitalization), treatment simplifications (daily insulin dose, and number of daily insulin injections), and safety (hypoglycaemic episodes, and hospital complications) of the linagliptin-basal insulin regimen compared to basal-bolus insulin regimen in patients with T2D admitted for ADHF.
Patients and methodsWe conducted an observational, multicentre, real-world study on non-critically ill patients with T2D admitted for ADHF who were managed with our hospital's antihyperglycemic protocol between 2017 and 2019. This protocol, fully described in the Lina-Real-World Study,7 includes two possible regimens: (a) Basal-bolus insulin: recommended for all hospitalized patients as standard of care; (b) Linagliptin-basal insulin: only recommended for patients with mild-to-moderate hyperglycaemia – admission glycated haemoglobin<8% (64mmol/mol) and admission BG<240mg/dL – who are treated without at-home injectable therapies and who do not meet the exclusion criteria (acute diabetic complications, type 1 diabetes, treatment with systemic glucocorticoid, cardiac surgery, acute renal function impairment, clinically-relevant liver disease, blood dyscrasias, gastrointestinal obstruction, pregnancy, those expected to be without oral intake, history of pancreatitis or active gallbladder disease, or previous gastrointestinal surgeries that induce chronic malabsorption). The target of therapy is to maintain fasting and pre-prandial BG levels between 140mg/dL and 180mg/dL. When patients on the linagliptin-basal insulin regimen experience treatment failure – two consecutive measurements or a mean daily BG level>240mg/dL–, they are switched to the basal-bolus regimen. The choice of which protocol to use is made by physicians according to their own clinical judgment.
In order to match patients who started one of the two regimens in a 1:1 manner, a propensity matching (PM) analysis with a caliper of 0.2 and a greedy matching algorithm were used. The probability of starting the linagliptin-basal regimen (as opposed to the basal-bolus regimen) was estimated using a logistic regression model that included variables that could have affected the treatment assignment or outcomes as independent variables (gender, age, anthropometric characteristics, previous medical history, T2D and HF characteristics, and laboratory findings including admission blood glucose, glycated haemoglobin, serum creatinine, N-terminal pro-B-type natriuretic peptide, and transaminase levels). In order to assess the adequacy of PM, we used the standardized difference (SD) found in post-matching patient characteristics. A significant imbalance was considered if SD>10% between baseline variables.
Written informed consent for the consultation of patient medical records was obtained from all participants. The study was approved by the Institutional Research Ethics Committee of Málaga and conducted in accordance with the Declaration of Helsinki.
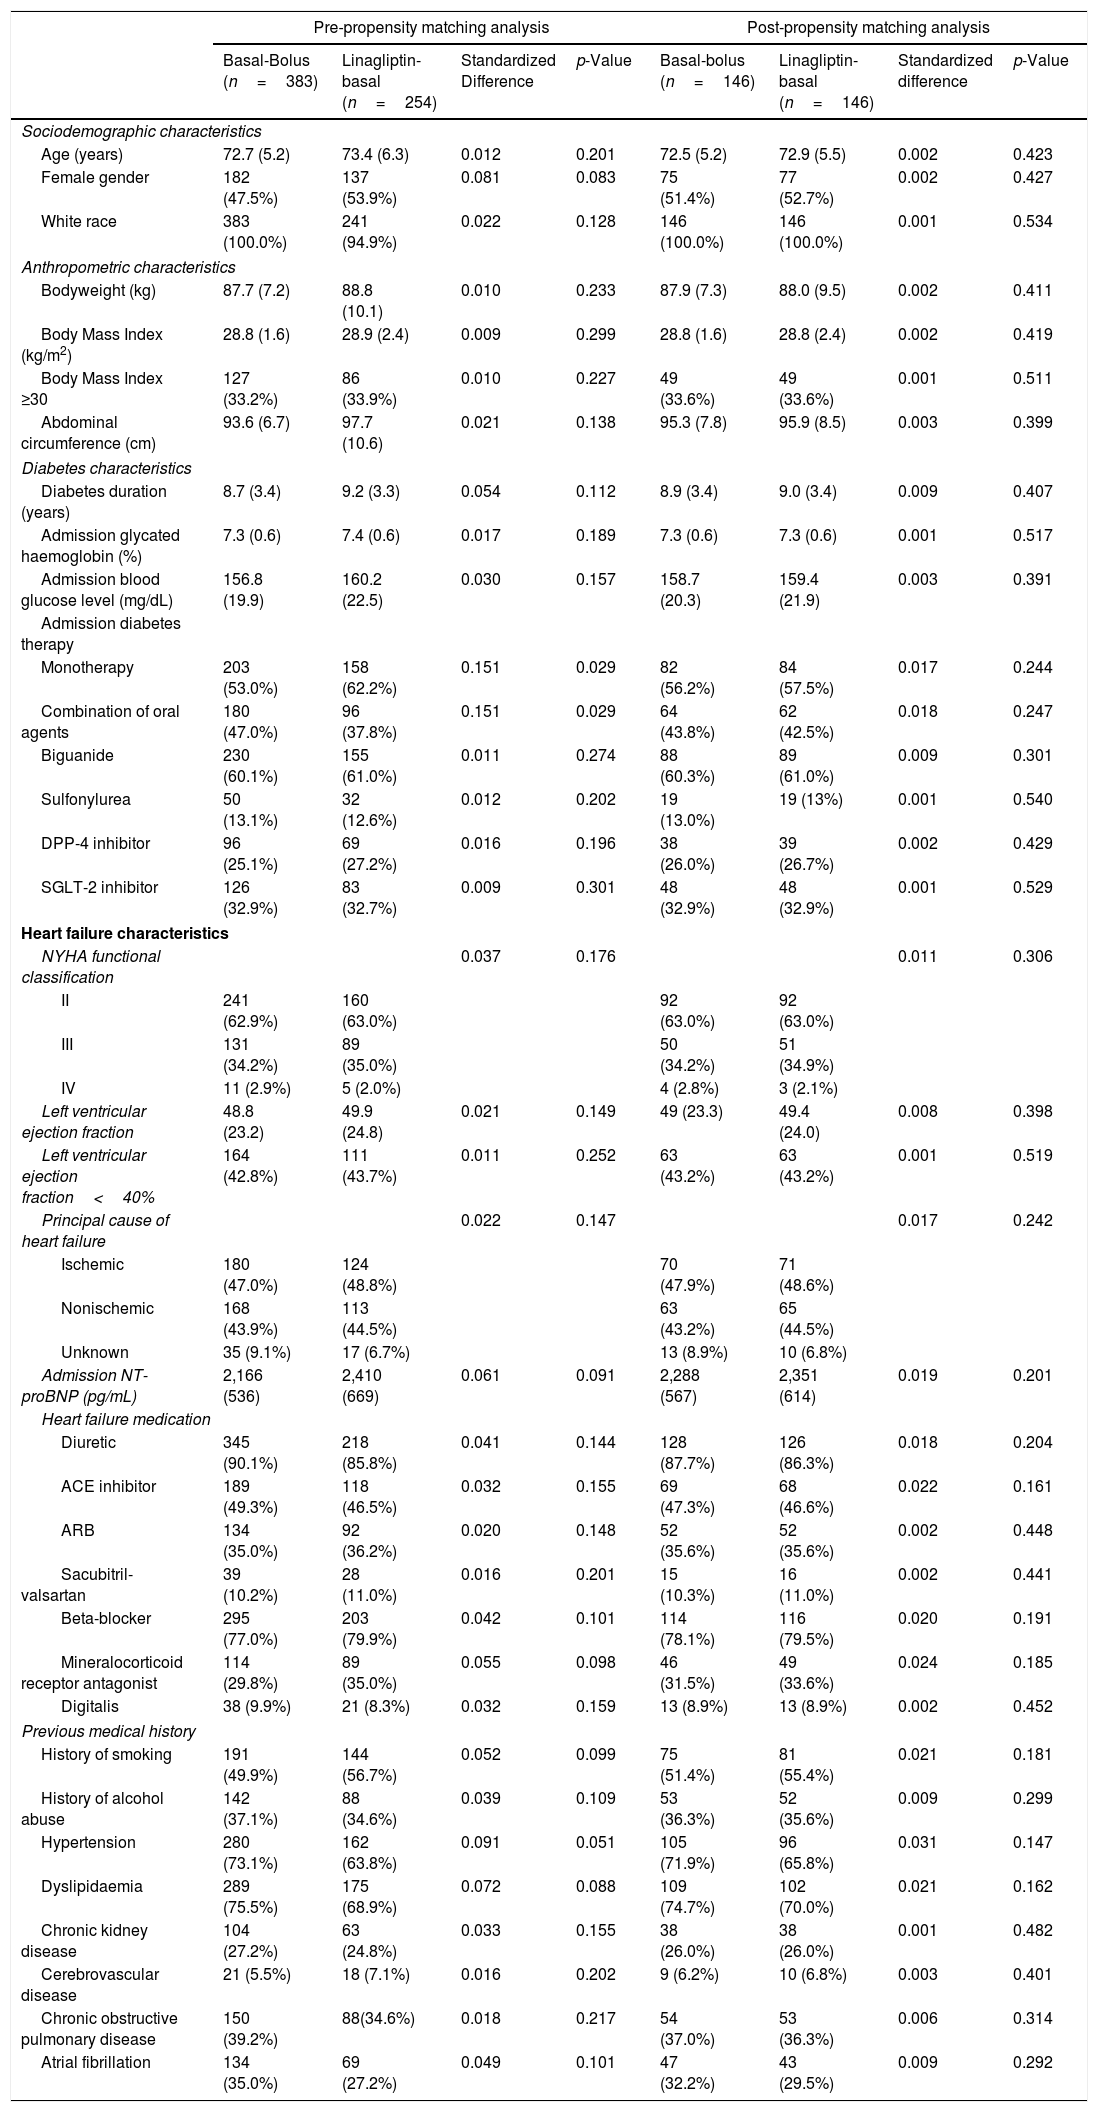
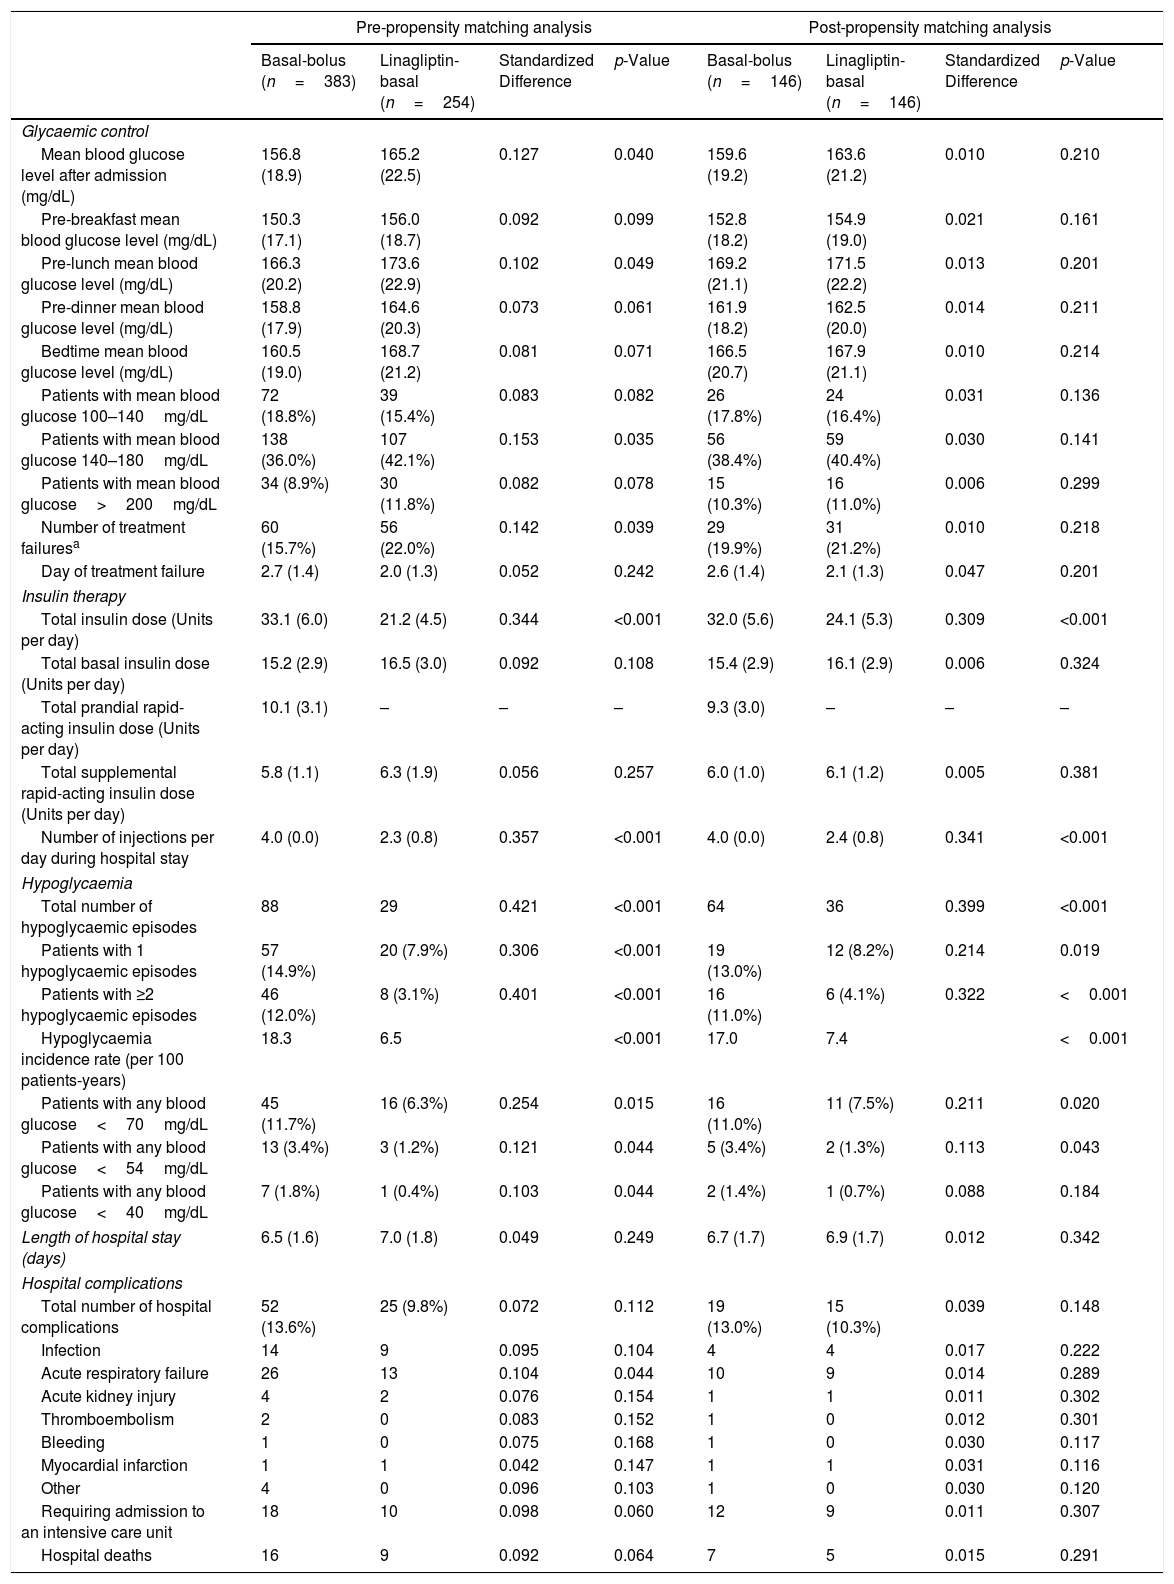
ResultsOf the total patients with T2D hospitalized for ADHF (n=1821), 637 (35%) met the criteria for treatment with the linagliptin-basal insulin regimen. Of these patients, 383 patients (60.6%) received the basal-bolus regimen and 254 (39.4%) received the lina-basal regimen. After PM, 146 patients were included in each regimen group. Sociodemographic, anthropometric, T2D, HF, and previous medical history data of patients according to antihyperglycaemic regimen before and after PM analysis are shown in Table 1. In regard to glycaemic control, there were no differences between treatment groups. However, total insulin dose and number of injections per day during hospital stay were significantly lower in the linagliptin-basal group. In addition, the linagliptin-basal insulin group had a lower total number of hypoglycaemic episodes, patients with 1 or ≥2 hypoglycaemic episodes, hypoglycaemia incidence rate, and patients with any BG<70 and <54mg/dL. All pre- and post-PM data are summarized in Table 2.
Sociodemographic, anthropometric, diabetes, heart failure, and previous medical history data of patients admitted for acute decompensated heart failure according to antihyperglycemic regimen: pre- and post-propensity matching analysis.
| Pre-propensity matching analysis | Post-propensity matching analysis | |||||||
|---|---|---|---|---|---|---|---|---|
| Basal-Bolus (n=383) | Linagliptin-basal (n=254) | Standardized Difference | p-Value | Basal-bolus (n=146) | Linagliptin-basal (n=146) | Standardized difference | p-Value | |
| Sociodemographic characteristics | ||||||||
| Age (years) | 72.7 (5.2) | 73.4 (6.3) | 0.012 | 0.201 | 72.5 (5.2) | 72.9 (5.5) | 0.002 | 0.423 |
| Female gender | 182 (47.5%) | 137 (53.9%) | 0.081 | 0.083 | 75 (51.4%) | 77 (52.7%) | 0.002 | 0.427 |
| White race | 383 (100.0%) | 241 (94.9%) | 0.022 | 0.128 | 146 (100.0%) | 146 (100.0%) | 0.001 | 0.534 |
| Anthropometric characteristics | ||||||||
| Bodyweight (kg) | 87.7 (7.2) | 88.8 (10.1) | 0.010 | 0.233 | 87.9 (7.3) | 88.0 (9.5) | 0.002 | 0.411 |
| Body Mass Index (kg/m2) | 28.8 (1.6) | 28.9 (2.4) | 0.009 | 0.299 | 28.8 (1.6) | 28.8 (2.4) | 0.002 | 0.419 |
| Body Mass Index ≥30 | 127 (33.2%) | 86 (33.9%) | 0.010 | 0.227 | 49 (33.6%) | 49 (33.6%) | 0.001 | 0.511 |
| Abdominal circumference (cm) | 93.6 (6.7) | 97.7 (10.6) | 0.021 | 0.138 | 95.3 (7.8) | 95.9 (8.5) | 0.003 | 0.399 |
| Diabetes characteristics | ||||||||
| Diabetes duration (years) | 8.7 (3.4) | 9.2 (3.3) | 0.054 | 0.112 | 8.9 (3.4) | 9.0 (3.4) | 0.009 | 0.407 |
| Admission glycated haemoglobin (%) | 7.3 (0.6) | 7.4 (0.6) | 0.017 | 0.189 | 7.3 (0.6) | 7.3 (0.6) | 0.001 | 0.517 |
| Admission blood glucose level (mg/dL) | 156.8 (19.9) | 160.2 (22.5) | 0.030 | 0.157 | 158.7 (20.3) | 159.4 (21.9) | 0.003 | 0.391 |
| Admission diabetes therapy | ||||||||
| Monotherapy | 203 (53.0%) | 158 (62.2%) | 0.151 | 0.029 | 82 (56.2%) | 84 (57.5%) | 0.017 | 0.244 |
| Combination of oral agents | 180 (47.0%) | 96 (37.8%) | 0.151 | 0.029 | 64 (43.8%) | 62 (42.5%) | 0.018 | 0.247 |
| Biguanide | 230 (60.1%) | 155 (61.0%) | 0.011 | 0.274 | 88 (60.3%) | 89 (61.0%) | 0.009 | 0.301 |
| Sulfonylurea | 50 (13.1%) | 32 (12.6%) | 0.012 | 0.202 | 19 (13.0%) | 19 (13%) | 0.001 | 0.540 |
| DPP-4 inhibitor | 96 (25.1%) | 69 (27.2%) | 0.016 | 0.196 | 38 (26.0%) | 39 (26.7%) | 0.002 | 0.429 |
| SGLT-2 inhibitor | 126 (32.9%) | 83 (32.7%) | 0.009 | 0.301 | 48 (32.9%) | 48 (32.9%) | 0.001 | 0.529 |
| Heart failure characteristics | ||||||||
| NYHA functional classification | 0.037 | 0.176 | 0.011 | 0.306 | ||||
| II | 241 (62.9%) | 160 (63.0%) | 92 (63.0%) | 92 (63.0%) | ||||
| III | 131 (34.2%) | 89 (35.0%) | 50 (34.2%) | 51 (34.9%) | ||||
| IV | 11 (2.9%) | 5 (2.0%) | 4 (2.8%) | 3 (2.1%) | ||||
| Left ventricular ejection fraction | 48.8 (23.2) | 49.9 (24.8) | 0.021 | 0.149 | 49 (23.3) | 49.4 (24.0) | 0.008 | 0.398 |
| Left ventricular ejection fraction<40% | 164 (42.8%) | 111 (43.7%) | 0.011 | 0.252 | 63 (43.2%) | 63 (43.2%) | 0.001 | 0.519 |
| Principal cause of heart failure | 0.022 | 0.147 | 0.017 | 0.242 | ||||
| Ischemic | 180 (47.0%) | 124 (48.8%) | 70 (47.9%) | 71 (48.6%) | ||||
| Nonischemic | 168 (43.9%) | 113 (44.5%) | 63 (43.2%) | 65 (44.5%) | ||||
| Unknown | 35 (9.1%) | 17 (6.7%) | 13 (8.9%) | 10 (6.8%) | ||||
| Admission NT-proBNP (pg/mL) | 2,166 (536) | 2,410 (669) | 0.061 | 0.091 | 2,288 (567) | 2,351 (614) | 0.019 | 0.201 |
| Heart failure medication | ||||||||
| Diuretic | 345 (90.1%) | 218 (85.8%) | 0.041 | 0.144 | 128 (87.7%) | 126 (86.3%) | 0.018 | 0.204 |
| ACE inhibitor | 189 (49.3%) | 118 (46.5%) | 0.032 | 0.155 | 69 (47.3%) | 68 (46.6%) | 0.022 | 0.161 |
| ARB | 134 (35.0%) | 92 (36.2%) | 0.020 | 0.148 | 52 (35.6%) | 52 (35.6%) | 0.002 | 0.448 |
| Sacubitril-valsartan | 39 (10.2%) | 28 (11.0%) | 0.016 | 0.201 | 15 (10.3%) | 16 (11.0%) | 0.002 | 0.441 |
| Beta-blocker | 295 (77.0%) | 203 (79.9%) | 0.042 | 0.101 | 114 (78.1%) | 116 (79.5%) | 0.020 | 0.191 |
| Mineralocorticoid receptor antagonist | 114 (29.8%) | 89 (35.0%) | 0.055 | 0.098 | 46 (31.5%) | 49 (33.6%) | 0.024 | 0.185 |
| Digitalis | 38 (9.9%) | 21 (8.3%) | 0.032 | 0.159 | 13 (8.9%) | 13 (8.9%) | 0.002 | 0.452 |
| Previous medical history | ||||||||
| History of smoking | 191 (49.9%) | 144 (56.7%) | 0.052 | 0.099 | 75 (51.4%) | 81 (55.4%) | 0.021 | 0.181 |
| History of alcohol abuse | 142 (37.1%) | 88 (34.6%) | 0.039 | 0.109 | 53 (36.3%) | 52 (35.6%) | 0.009 | 0.299 |
| Hypertension | 280 (73.1%) | 162 (63.8%) | 0.091 | 0.051 | 105 (71.9%) | 96 (65.8%) | 0.031 | 0.147 |
| Dyslipidaemia | 289 (75.5%) | 175 (68.9%) | 0.072 | 0.088 | 109 (74.7%) | 102 (70.0%) | 0.021 | 0.162 |
| Chronic kidney disease | 104 (27.2%) | 63 (24.8%) | 0.033 | 0.155 | 38 (26.0%) | 38 (26.0%) | 0.001 | 0.482 |
| Cerebrovascular disease | 21 (5.5%) | 18 (7.1%) | 0.016 | 0.202 | 9 (6.2%) | 10 (6.8%) | 0.003 | 0.401 |
| Chronic obstructive pulmonary disease | 150 (39.2%) | 88(34.6%) | 0.018 | 0.217 | 54 (37.0%) | 53 (36.3%) | 0.006 | 0.314 |
| Atrial fibrillation | 134 (35.0%) | 69 (27.2%) | 0.049 | 0.101 | 47 (32.2%) | 43 (29.5%) | 0.009 | 0.292 |
Values are shown as mean (standard deviations), absolute values, and percentages. Standardized difference>10% (>0.1) is considered to represent a non-negligible difference. Values were considered to be statistically significant when p<0.05 in the comparison analysis.
ACE: angiotensin-converting enzyme; ARB: angiotensin-receptor blocker; cm: centimetre; DPP-4: dipeptidyl peptidase-4; kg: kilogram; m2: square meter; mg/dL: milligram/decilitre; NT-proBNP: N-terminal pro-B-type natriuretic peptide; NYHA: New York Heart Association; pg/dL: picogram/decilitre; SGLT-2: sodium-glucose transporter 2.
Glycaemic control, insulin therapy, hypoglycaemia, length of hospital stay, and hospital complications outcomes of patients admitted for acute decompensated heart failure by antihyperglycaemic regimen: pre- and post-propensity matching analysis.
| Pre-propensity matching analysis | Post-propensity matching analysis | |||||||
|---|---|---|---|---|---|---|---|---|
| Basal-bolus (n=383) | Linagliptin-basal (n=254) | Standardized Difference | p-Value | Basal-bolus (n=146) | Linagliptin-basal (n=146) | Standardized Difference | p-Value | |
| Glycaemic control | ||||||||
| Mean blood glucose level after admission (mg/dL) | 156.8 (18.9) | 165.2 (22.5) | 0.127 | 0.040 | 159.6 (19.2) | 163.6 (21.2) | 0.010 | 0.210 |
| Pre-breakfast mean blood glucose level (mg/dL) | 150.3 (17.1) | 156.0 (18.7) | 0.092 | 0.099 | 152.8 (18.2) | 154.9 (19.0) | 0.021 | 0.161 |
| Pre-lunch mean blood glucose level (mg/dL) | 166.3 (20.2) | 173.6 (22.9) | 0.102 | 0.049 | 169.2 (21.1) | 171.5 (22.2) | 0.013 | 0.201 |
| Pre-dinner mean blood glucose level (mg/dL) | 158.8 (17.9) | 164.6 (20.3) | 0.073 | 0.061 | 161.9 (18.2) | 162.5 (20.0) | 0.014 | 0.211 |
| Bedtime mean blood glucose level (mg/dL) | 160.5 (19.0) | 168.7 (21.2) | 0.081 | 0.071 | 166.5 (20.7) | 167.9 (21.1) | 0.010 | 0.214 |
| Patients with mean blood glucose 100–140mg/dL | 72 (18.8%) | 39 (15.4%) | 0.083 | 0.082 | 26 (17.8%) | 24 (16.4%) | 0.031 | 0.136 |
| Patients with mean blood glucose 140–180mg/dL | 138 (36.0%) | 107 (42.1%) | 0.153 | 0.035 | 56 (38.4%) | 59 (40.4%) | 0.030 | 0.141 |
| Patients with mean blood glucose>200mg/dL | 34 (8.9%) | 30 (11.8%) | 0.082 | 0.078 | 15 (10.3%) | 16 (11.0%) | 0.006 | 0.299 |
| Number of treatment failuresa | 60 (15.7%) | 56 (22.0%) | 0.142 | 0.039 | 29 (19.9%) | 31 (21.2%) | 0.010 | 0.218 |
| Day of treatment failure | 2.7 (1.4) | 2.0 (1.3) | 0.052 | 0.242 | 2.6 (1.4) | 2.1 (1.3) | 0.047 | 0.201 |
| Insulin therapy | ||||||||
| Total insulin dose (Units per day) | 33.1 (6.0) | 21.2 (4.5) | 0.344 | <0.001 | 32.0 (5.6) | 24.1 (5.3) | 0.309 | <0.001 |
| Total basal insulin dose (Units per day) | 15.2 (2.9) | 16.5 (3.0) | 0.092 | 0.108 | 15.4 (2.9) | 16.1 (2.9) | 0.006 | 0.324 |
| Total prandial rapid-acting insulin dose (Units per day) | 10.1 (3.1) | – | – | – | 9.3 (3.0) | – | – | – |
| Total supplemental rapid-acting insulin dose (Units per day) | 5.8 (1.1) | 6.3 (1.9) | 0.056 | 0.257 | 6.0 (1.0) | 6.1 (1.2) | 0.005 | 0.381 |
| Number of injections per day during hospital stay | 4.0 (0.0) | 2.3 (0.8) | 0.357 | <0.001 | 4.0 (0.0) | 2.4 (0.8) | 0.341 | <0.001 |
| Hypoglycaemia | ||||||||
| Total number of hypoglycaemic episodes | 88 | 29 | 0.421 | <0.001 | 64 | 36 | 0.399 | <0.001 |
| Patients with 1 hypoglycaemic episodes | 57 (14.9%) | 20 (7.9%) | 0.306 | <0.001 | 19 (13.0%) | 12 (8.2%) | 0.214 | 0.019 |
| Patients with ≥2 hypoglycaemic episodes | 46 (12.0%) | 8 (3.1%) | 0.401 | <0.001 | 16 (11.0%) | 6 (4.1%) | 0.322 | <0.001 |
| Hypoglycaemia incidence rate (per 100 patients-years) | 18.3 | 6.5 | <0.001 | 17.0 | 7.4 | <0.001 | ||
| Patients with any blood glucose<70mg/dL | 45 (11.7%) | 16 (6.3%) | 0.254 | 0.015 | 16 (11.0%) | 11 (7.5%) | 0.211 | 0.020 |
| Patients with any blood glucose<54mg/dL | 13 (3.4%) | 3 (1.2%) | 0.121 | 0.044 | 5 (3.4%) | 2 (1.3%) | 0.113 | 0.043 |
| Patients with any blood glucose<40mg/dL | 7 (1.8%) | 1 (0.4%) | 0.103 | 0.044 | 2 (1.4%) | 1 (0.7%) | 0.088 | 0.184 |
| Length of hospital stay (days) | 6.5 (1.6) | 7.0 (1.8) | 0.049 | 0.249 | 6.7 (1.7) | 6.9 (1.7) | 0.012 | 0.342 |
| Hospital complications | ||||||||
| Total number of hospital complications | 52 (13.6%) | 25 (9.8%) | 0.072 | 0.112 | 19 (13.0%) | 15 (10.3%) | 0.039 | 0.148 |
| Infection | 14 | 9 | 0.095 | 0.104 | 4 | 4 | 0.017 | 0.222 |
| Acute respiratory failure | 26 | 13 | 0.104 | 0.044 | 10 | 9 | 0.014 | 0.289 |
| Acute kidney injury | 4 | 2 | 0.076 | 0.154 | 1 | 1 | 0.011 | 0.302 |
| Thromboembolism | 2 | 0 | 0.083 | 0.152 | 1 | 0 | 0.012 | 0.301 |
| Bleeding | 1 | 0 | 0.075 | 0.168 | 1 | 0 | 0.030 | 0.117 |
| Myocardial infarction | 1 | 1 | 0.042 | 0.147 | 1 | 1 | 0.031 | 0.116 |
| Other | 4 | 0 | 0.096 | 0.103 | 1 | 0 | 0.030 | 0.120 |
| Requiring admission to an intensive care unit | 18 | 10 | 0.098 | 0.060 | 12 | 9 | 0.011 | 0.307 |
| Hospital deaths | 16 | 9 | 0.092 | 0.064 | 7 | 5 | 0.015 | 0.291 |
Values are shown as mean (standard deviations), absolute values, and percentages. Standardized difference of>10% (>0.1) is considered to represent a non-negligible difference. Values were considered to be statistically significant when p<0.05 in the comparison analysis. mg/dL: Milligram/decilitre.
This real-world study found that the hospital antihyperglycemic regimen with linagliptin and basal insulin was found to be safer, as there were fewer hypoglycemic episodes; simpler, as there was a lower total daily insulin dose and fewer number of injections per day; and as efficacious in regards to glycemic control as a multidose basal-bolus insulin regimen in non-critically ill patients with mild-to-moderate hyperglycemia control who are treated at home without injectable therapies and who were admitted for ADHF.
As a result of the association between HF and T2D, patients are normally subjected to higher risk of hospitalization, poorer cardiovascular outcome, and polypharmacy, making the therapeutic approach very complex.10
In non-critically ill patients with T2D, the basal-bolus insulin regimen, which includes once-daily basal insulin and bolus of rapid-acting insulin before meals, is currently the preferred therapy for treating in-hospital hyperglycemia. This intensive regimen is used regardless of the age, the diabetes characteristics, admitting diagnosis, or the presence of multimorbidity and polypharmacy.2,3 In recent years, several studies have shown that the use of antihyperglycaemic regimens with DPP-4i were as efficacious and safe as multidose insulin regimens, and made easier the management of hyperglycaemia in hospitalized patients.5–8 However, all these studies have included general medicine and surgery patients and no subgroup analysis has been performed in any of them. Our study is the first to focus on patients with T2D admitted for ADHF. Patients benefited from a regimen including linagliptin, which led to a reduced insulin dose and fewer daily injection, maintaining the glycaemic efficacy. We also found a relevant reduction in hypoglycemic episodes, providing important data in regards to in-hospital safety. This reduction has been previously reported in general medicine and surgery patients with T2D.6–8 It is known that hypoglycemia can be more frequently induced in patients with a vulnerable profile who receive multidose insulin regimens.2,3,8
Limited evidence on the in-hospital use of other non-insulin glucose-lowering drugs exists. Although sodium-glucose transporter 2 inhibitors have shown clear benefits on HF outcomes, current evidence recommends avoiding routine in-hospital use until safety and effectiveness are established.3
Although our findings are important, we acknowledge several potential limitations. Firstly, the use of PM cannot exclude the possibility of unmeasured confounding factors due to the retrospective nature of our data. Secondly, we used a protocol that is not fully implemented in our area. Thirdly, due to the relatively low number of events or complications, their relationship to the antihyperglycemic regimen could not be conclusively determined. Fourthly, in our local protocol for the treatment of hospitalized T2D patients, only linagliptin is used. The reasons that underlie its use in our protocol are that there is no need for dose titration according to renal function and that its safety has been demonstrated in several studies.6–8 Thus, our findings cannot be extrapolated to other DPP-4 inhibitors. Finally, we only selected patients admitted for ADHF, though the reduction in hypoglycemic events could be extrapolated to other subgroups of T2D patients at high risk of drug-related harms, such as those with chronic hepatic, kidney impairment, or dementia.3,4 Further research is required in order to confirm these results and to provide more evidence.
In conclusion, we found that the in-hospital linagliptin-basal insulin regimen was safer and simpler than basal-bolus insulin regimen. It led to similar glycemic control in non-critically ill patients with mild-to-moderate glycemic control who were treated at home without injectable therapies and who were admitted for ADHF. A Linagliptin-basal insulin regimen could be considered standard of care for these vulnerable, high complex patients in order to simplify in-hospital management.
Funding sourcesThis work was funded by grants from Internal Medicine Department, cofounded by the Fondo Europeo de Desarrollo Regional-FEDER (CIBER, CB06/03/0018).
Conflict of interestNone declared.
We thank Claire Conrad for her help with the final English-language version.
