


Our purpose was to establish different cut-off points based on the lung ultrasound score (LUS) to classify COVID-19 pneumonia severity.
MethodsInitially, we conducted a systematic review among previously proposed LUS cut-off points. Then, these results were validated by a single-centre prospective cohort study of adult patients with confirmed SARS-CoV-2 infection. Studied variables were poor outcome (ventilation support, intensive care unit admission or 28-days mortality) and 28-days mortality.
ResultsFrom 510 articles, 11 articles were included. Among the cut-off points proposed in the articles included, only the LUS>15 cut-off point could be validated for its original endpoint, demonstrating also the strongest relation with poor outcome (odds ratio [OR]=3.636, confidence interval [CI] 1.411–9.374). Regarding our cohort, 127 patients were admitted. In these patients, LUS was statistically associated with poor outcome (OR=1.303, CI 1.137–1.493), and with 28-days mortality (OR=1.024, CI 1.006–1.042). LUS>15 showed the best diagnostic performance when choosing a single cut-off point in our cohort (area under the curve 0.650). LUS≤7 showed high sensitivity to rule out poor outcome (0.89, CI 0.695–0.955), while LUS>20 revealed high specificity to predict poor outcome (0.86, CI 0.776–0.917).
ConclusionsLUS is a good predictor of poor outcome and 28-days mortality in COVID-19. LUS≤7 cut-off point is associated with mild pneumonia, LUS 8–20 with moderate pneumonia and ≥20 with severe pneumonia. If a single cut-off point were used, LUS>15 would be the point which better discriminates mild from severe disease.
Establecer diferentes puntos de corte basados en el Lung Ultrasound Score (LUS) para clasificar la gravedad de la neumonía COVID-19.
MétodosInicialmente, realizamos una revisión sistemática entre los puntos de corte LUS propuestos previamente. Estos resultados fueron validados por una cohorte prospectiva unicéntrica de pacientes adultos con infección confirmada por SARS-CoV-2. Las variables analizadas fueron la mala evolución y la mortalidad a los 28 días.
ResultadosDe 510 artículos, se incluyeron 11. Entre los puntos de corte propuestos en los artículos incluidos, solo LUS>15 pudo ser validado para su objetivo original, demostrando también la relación más fuerte con mala evolución (odds ratio [OR]=3,636, intervalo de confianza [IC] 1,411-9,374). Respecto a nuestra cohorte, se incluyeron 127 pacientes. En estos pacientes, el LUS se asoció estadísticamente con mala evolución (OR=1,303, IC 1,137-1,493) y con mortalidad a los 28 días (OR=1,024, IC 1,006-1,042). LUS>15 mostró el mejor rendimiento diagnóstico al elegir un único punto de corte en nuestra cohorte (área bajo la curva 0,650). LUS≤7 mostró una alta sensibilidad para descartar mal resultado (0,89, IC 0,695-0,955), mientras que LUS>20 reveló gran especificidad para predecir mala evolución (0,86, IC 0,776-0,917).
ConclusionesLUS es un buen predictor de mala evolución y mortalidad a 28 días en COVID-19. LUS≤7 se asocia con neumonía leve, LUS 8-20 con neumonía moderada y ≥20 con neumonía grave. Si se utilizara un único punto de corte, LUS>15 sería el que mejor discriminaría la enfermedad leve de la grave.
From the beginning of the SARS-CoV-2 pandemic, there is a growing interest in the role of lung ultrasound as a diagnostic tool.1 It is an easy-to-learn, non-ionising and repeatable technique, which makes it a fast and safe diagnostic device in the evaluation of patients with COVID-19 pneumonia.2 Moreover, lung ultrasound in COVID-19 has proven to be superior to chest X-ray and similar to chest computer tomography as a diagnostic tool.3,4
Several assessment protocols have been developed for lung ultrasound.5 Among them, the lung ultrasound score (LUS) proposed by Soldati et al., based on previous work by Rouby and Soummer, is the most recognised for COVID-19 pneumonia evaluation.6–8 This protocol establishes a score of lung involvement according to the degree of impairment in each of the 12 fields examined. The performance of LUS in the evaluation of COVID-19 patients has been validated in subsequent independent studies.9,10 However, no benchmark points have yet been addressed nor agreed as the optimal cut-off points for determining the disease severity.11
In order to assess treatment decision-making, the purpose of this study is to validate already published results in order to establish the best cut-off points based on LUS punctuation to sort out COVID-19 patients into mild, moderate, and severe degree of pulmonary impairment.
Material and methodsStudy design and settingIn order to establish two LUS cut-off points to classify COVID-19 patients according to their pneumonia severity into mild, moderate and severe cases, we conducted a two steps study. At first, we carried out a systematic review of the different severity thresholds of the LUS score published in the literature. Afterwards, in a second step, we validated these results in our own prospective patient cohort. In this cohort, we hypothesised the usefulness of lung ultrasound, and in particular the LUS score, to predict poor outcome in early inpatients with SARS-CoV-2 pneumonia.
The systematic review was carried out according to the 2020 Preferred Reporting Items for Systematic review and Meta-Analysis (PRISMA) guidelines (Appendix A), although it was not previously registered or established a prior protocol.12 Template data collection forms and data extracted from included studies are available upon request to the authors. The study protocol was approved by the regional ethics committee with the code 0259-N-21, and informed consent for the study was obtained from all participants. We wrote this article in accordance with the Transparent Reporting of a multivariable prediction model for Individual Prognosis Or Diagnosis (TRIPOD) statement for risk prediction models and the Standards for Reporting Diagnostic Accuracy (STARD) statement (Appendices B and C).13,14 Some of these patients have been included in previous articles of our workgroup.15
LUS cut-off points selectionWe performed an electronic search in PubMed, Embase, Scopus, Coronavirus Research Database and Cochrane Database of Systematic Reviews databases to extract the data required for this article. The search strategy was based on MeSH and associated terms (pneumonia, ultrasonography, covid 19) along with other methodological terms (LUS, score), which resulted as follows: (Ultrasonography OR Ultrasonics OR “Lung Ultrasound” OR LUS OR LUSS OR Echography) AND (Pneumonia OR “Respiratory Distress Syndrome” OR Lung OR “Lung Injury” OR “Interstitial Lung Diseases”) AND (Covid-19 OR SARS-CoV-2) AND (Score). This search strategy has been enhanced by analysing the bibliography of relevant studies, in order to add new publications.
The included studies cover the time period between 31st of December 2019 and 31st of December 2021. Every article included was consistent with the design of our own cohort, that is studies conducted in adult hospitalized inpatients, evaluating the LUS score, and using as measured outcomes mortality and poor outcomes (invasive mechanical ventilation, intensive care unit admission) or a combination of them (critical disease). Therefore, we excluded those studies conducted in a different setting than our research (e.g. ICU or emergency department), in unrelated reference population (e.g. paediatric of less than 18 years, pregnant women), using different protocols (e.g. different from 12-fields and/or Soldati severity score) or that measured outcomes different from ours (e.g. association of LUS with severity scales or CT).6 Articles with missing or unclear information were included if they provide enough data to asses that they are compatible with our cohort design, as explained.
Two independent operators (M.M. and A.B.) performed the literature search, selection and inclusion of data, without any results communication between them along the process. The search process was conducted using the systematic review screening software Rayyan® and the word processing software Microsoft Word®.16 Our first screening was based on title and abstract, and then a second phase was performed based on full text. The discrepancies between the two researchers were resolved by a third (J.G.).
At last, we used the Quality Assessment of Diagnostic Accuracy Studies (QUADAS-2) tool to establish the quality of the included articles.17 In this review, the same two independent reviewers (M.M. and A.B.) assessed the risk of bias in the included studies, and disagreements were then discussed and resolved with a senior reviewer (J.G.). Each domain's definitions and judgement criteria was established according to the guidelines in the “Cochrane Handbook of Systematic Reviews of Interventions” of the Cochrane Collaboration.18 High risk was defined in each of the four domains assessed by QUADAS-2 as follows. A high risk of bias was assigned to domain 1 (patient selection) in case of a case-control study design or non-consecutive enrolment, as well as high risk regarding applicability if the setting of the study or the degree of COVID-19 disease in all patients of the study were unclear. Based on the study approach, domain 2 (index test) was established as high risk of bias if LUS images were analysed without blinding to other imaging techniques or clinical information, or if thresholds that were not pre-determined were used; and high risk of applicability if the method of LUS acquisition and analysis was not clear or variable. As for Domain 3 (reference standard), a high risk of bias was determined if the reference standard was unlikely to accurately classify COVID-19 patients; and a high risk regarding application if any changes were made to the definition of a positive SARS-CoV-2 PCR (regarding cycle threshold or any other). Domain 4 (flow and timing) was categorised as high risk of bias if the LUS acquisition did not take place within 5 days of the reference standard.
Meta-analyses could not be undertaken due to the heterogeneity of outcome measures. No synthesis of the results was made either, as the results were interpreted by comparison with the findings from the self-reported cohort. For presentation, we tabulated the results of individual studies. There, the combined outcomes reported in the articles were grouped into different definitions of “critical illness” according to their composition.
Participant selectionOur patient cohort was constituted at the San Cecilio University Hospital in Granada (Spain). The included participants were consecutive adult patients (age 18 years or older) in the first 24h of admission to the COVID-19 inpatient ward by quota sampling, with confirmed infection by real-time reverse transcription–polymerase chain reaction (RT-PCR) SARS-CoV-2, from 1st January 2021 to 12th August 2021.19
As excluding criteria, patients with suspected or confirmed bacterial pulmonary superinfection, those unable to cooperate with the examination (for physical or cognitive reasons) and those who voluntarily refused to participate, were missed out from the study. We provided to all patients an informed consent and study summary form, with a revocation option for those who signed it.
Patient characteristics and clinical outcomesThe variables collected from each participant included in the study were as follows: registration data, anthropometric variables, symptoms and onset date, comorbidities, vital signs, radiological severity, analytical data, and ultrasound lung involvement. Analytical data were requested at first hospital contact, whereas clinical variables and missing data were collected by the researches on the COVID-19 transitional hospitalisation ward at the time of evaluation.
Outcomes measured were non-invasive mechanical ventilation or high-flow nasal oxygen therapy (NIMV), invasive mechanical ventilation (IMV), intensive care unit (ICU) admission and 28-days mortality. We also elaborated the combined variables NIMV or IMV, and NIMV or IMV or ICU admission or 28-days mortality. The primary endpoint of our study was “poor outcome”, defined as the event of any or several of the following: NIMV or IMV or ICU admission or 28-days mortality. The secondary outcome was 28-days mortality. Based on these outcomes, we established the definitions of mild pneumonia if it has a low probability of a negative outcome (poor outcome), severe pneumonia if it has a high probability of a negative outcome, and moderate pneumonia if it has an intermediate probability of a negative outcome.
Image acquisitionUltrasound imaging was performed with an ultrasound scanner PHILIPS® SPARQ (Koninklijke Philips N.V; Amsterdam, Netherlands). We established the predefined lung preset, using a curved array transducer of 6–2MHz. The images were acquired by eight Internal Medicine and Infectious Diseases physicians, trained in lung ultrasound by the Clinical Care Ultrasound Group of the hospital. Assuming the existence of an inherent observer bias in ultrasound scanning, we performed the scans with at least two simultaneous examiners always involved in image acquisition and interpretation. This way, we tried to reduce the potential bias associated with the inter-individual variability of ultrasound examination. Prior consultation of the patient's history was avoided, in order to prevent the conditioning of the image acquisition.
We followed the 12 lung-field protocol since it is the most efficient strategy between diagnostic accuracy and acquisition time,20 although it differs from the analysis of 14 fields proposed by Soldati. This 12 lung-field protocol divided each hemithorax by the anterior and posterior axillary line into anterior, lateral and posterior fields. Subsequently, we divided each area into upper and lower fields, resulting in six fields for each hemithorax.
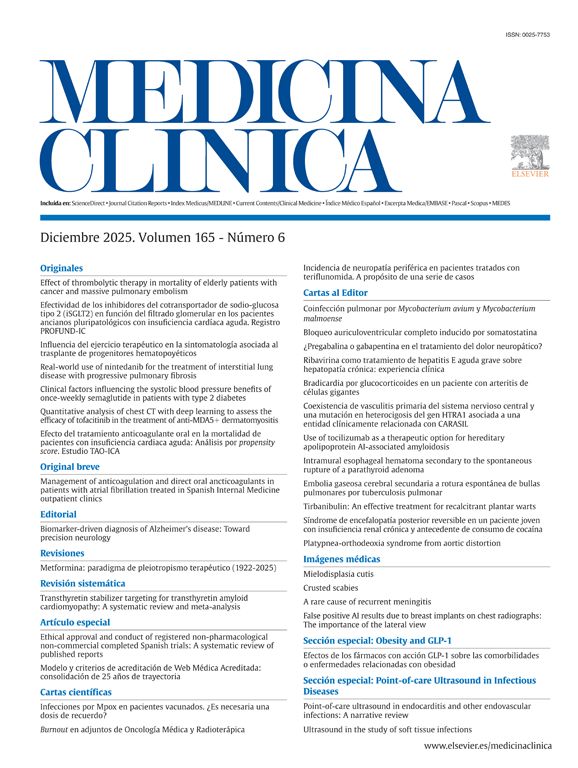
For all the analysed fields, we recorded the observed ultrasound signs in a template common to all investigators. These signs were the presence of >3 B-lines, coalescing B-lines, subpleural consolidation, pulmonary consolidation, pleural thickening, pleural irregularity and pleural effusion. We also determined the lung ultrasound score (LUS) for each of the 12 fields as well as the total LUS summed over them.6 The description of the LUS is illustrated in Fig. 1.
Analysis![Lung areas distribution and LUS (a) 0 points [normal A-lines pattern]; (b) 1 point [> 3 B-lines]; (c) 2 points [coalescing B-lines and/or subpleural consolidation]; (d) 3 points [pulmonary consolidation or “with lung”].](https://static.elsevier.es/multimedia/23870206/0000016000000012/v1_202306191131/S2387020623002206/v1_202306191131/en/main.assets/gr1.jpeg?xkr=ue/ImdikoIMrsJoerZ+w997EogCnBdOOD93cPFbanNeMnx59J5MZq19QkIYapO3CoXPIHEt4aMOh6XAgqwqOdus6BRxZfOUg0SNFBUtGU+DlT0ia2RMfj47gJ4Gi1BiyJZIBmiPJ3p58RKJYhPxvTvxD3pltzbaZsmgZlf/Nc7AQd6EGtbEwETIZQmuKjJjGPXtXn0OWpDN9DnuxblmHvkbQlVY0dIr3LjtQi/BxvsCAHH3t+0jI5ImEcAf8MK9iPQou9eGb/U2HiiGaBu9wcow2GYBzdVCOQvU/9HWB27w= "Lung areas distribution and LUS (a) 0 points [normal A-lines pattern]; (b) 1 point [> 3 B-lines]; (c) 2 points [coalescing B-lines and/or subpleural consolidation]; (d) 3 points [pulmonary consolidation or “with lung”].")
For the descriptive analysis of the included patients, quantitative variables were described by means and standard deviations (SD) or median and interquartile range (IQR), with corresponding 95% confidence interval (CI), while qualitative variables were described by proportions. The sample size was the one estimated in previous studies and, if an outcome was missing, the patient was excluded from the analysis.15
Regarding the cut-off points proposed in the included articles of the systematic review, we validated their performance for their original endpoint in our cohort determining the Chi-square test. Furthermore, we also analysed their value as poor outcome and 28-days mortality predictors. We conducted a Cox proportional hazards regression model to establish the association between LUS and the endpoints “poor outcome” and “28-days mortality” in our patients cohort, with the resulting determination of the odds ratio (OR). According to our primary endpoint, and based on the subresults of a previous sample of our cohort, different cut-off points were established.15 We analysed as high sensitivity cut-off points≤7, 8–15 and >15; and as high specificity cut-off points ≤ 15, 15–20 and> 20. The differences between these subgroups were analysed using the Chi-square test. In addition, we also calculated the ROC curve and the area under the curve (AUC) for the LUS>15 cut-off point referred to poor outcome. All analyses were performed with version 24 of the SPSS software package (IBM, Armonk, NY, USA).
ResultsCharacteristics of included articlesBased on the literature search criteria described above, we found 510 articles in the five databases selected. 228 duplicate articles were removed and, from the remaining 282 articles, 254 were excluded based on their titles and abstracts. Finally, from the 28 full-text articles considered eligible for qualitative analysis, 11 articles were included and 17 were excluded as described in Fig. 2.

Flow diagram for article selection according to PRISMA 2020 guidelines.12
The 17 articles were excluded as described in the flow diagram. 11 of these studies were ruled out because they used different LUS protocol than our 12 LUS protocol: Skopljanac et al., Falster et al. and Perrone et al. used a 14 LUS protocol; Hernández-Píriz et al. a 13 LUS protocol; Torres-Macho et al., Zhu et al. and Brahier et al. a 10 LUS protocol; Casella et al. a 11 LUS protocol; Ramos-Hernández et al. an 8 and 14 LUS protocol; and Espersen et al. and Deng et al. an 8 LUS protocol.21–31 Four studies were excluded because of different outcomes: Ji et al. measured as primary outcome in-hospital mortality and acute respiratory distress syndrome as second outcome; Bosso et al. measured as primary outcome the role of LUS in diagnosis and, as secondary, the LUS utility in predicting severity and outcome (survival/death); Sumbul et al. measured LUS score to determine the severity of pneumonia within three groups (mild/moderate, severe and critically ill patients); and Rubio-García et al. measured as primary outcome in-hospital death and/or admission to the intensive care unit for invasive mechanical ventilation and, as secondary the total length of hospital stay, increase of oxygen flow and escalation of medical treatment during the first 72h.32–35 One study, Tombini et al. was excluded because of different outcomes and different setting, since, carried out at the emergency department, the first outcome was a composite of death and need for mechanical ventilation, and the secondary was safe discharge from the emergency department.36 Finally, another study, Lai et al., was excluded because of different outcome; LUS and correlation to respiratory parameters of pO2/FiO2, rate of intubation and mortality, and wrong study design; a systematic review published at the special issue of the 2021 annual meeting of the Society of Academic Emergency Medicine.37
The included studies characteristics are described in detail in Table 1. The aggregate population of the included articles accounts for a total of 1308 hospitalised patients with COVID-19 pneumonia. Among the 11 articles, 5 of them assessed the LUS cut-off point for mortality (with variable definitions), 4 the need for invasive mechanical ventilation, 4 elaborated prognostic endpoints with one or more of the outcomes collected in our cohort, and only 1 assessed intensive care unit admission isolated. 4 of the 11 articles were multi-centre studies, while the other 7 were single-centre projects.
Performance of the included articles cut-off points for their measured outcome, poor outcome and 28-days mortality.
| Author and publication date | Population studied | Measured outcome and LUS cut-off points | Performance for the measured outcome (p value vs. no measured outcome) | Performance for poor outcome (p value vs. no poor outcome) | Performance for 28-days mortality (p value vs. no mortality) |
|---|---|---|---|---|---|
| Lichter,4028/08/2020 | 120 COVID-19 hospitalized patients | a) Mortality (30-days): >18b) IMV: >18 | a) p=0.435b) p=0.669 | a) p=0.308b) p<0.001 | a) p=0.435b) p=0.716 |
| Recinella,4103/12/2020 | 37 COVID-19 hospitalized patients (elderly) | Mortality (intrahospital): ≥17 | p=0.288 | p=0.023 | p=0.288 |
| Alencar,4211/01/2021 | 180 COVID-19 hospitalized patients | a) Mortality (variable): ≥26b) ICU: ≥25c) IMV: ≥25 | a) p=0.354b) p=0.562c) p=0.750 | a) ≥26: p=0.198b) ≥25: p=0.287c) p<0.001 | a) p=0.354b) p=0.964c) p=0.716 |
| Boero,3824/01/2021 | 157 COVID-19 hospitalized patients | Critical disease 1 (IMV, ICU or mortality 30-days): >15 | p=0.006 | p=0.006 | p=0.396 |
| Seiler,4326/01/2021 | 50 COVID-19 hospitalized patients (O2 demand≥4L/min) | IMV: >19 | p=0.579 | p=0.666 | p=0.472 |
| Xian,4402/2021 | 31 COVID-19 hospitalized patients | Critical disease 2 (IMV or ICU): >9 | p=0.698 | p=0.698 | p=0.845 |
| Yasukawa,4504/02/2021 | 105 COVID-19 hospitalized patients | IMV (NPV): <5 | p=0.250 | p=0.287 | p=0.423 |
| Lieveld,4601/05/2021 | 37 COVID-19 hospitalized patients | Critical disease 3 (ICU or mortality 30-days): ≥12 | p=0.341 | p=0.058 | p=0.804 |
| Trias-Sabrià,4718/05/2021 | 36 COVID-19 hospitalized patients | Critical disease 3 (ICU or mortality): ≥24 | p=0.143 | p=0.607 | p=0.056 |
| Sun,1025/05/2021 | 402 COVID-19 hospitalized patients | Mortality (variable): >15 | p=0.396 | p=0.006 | p=0.396 |
| Tana,4831/08/2021 | 153 COVID-19 hospitalized patients | Mortality (intrahospital): ≥20 | p=0.387 | p=0.552 | p=0.387 |
IMV: invasive mechanical ventilation; ICU: intensive care unit admission; NPV: negative predicting value; poor outcome: non-IMV or IMV or ICU or 28-days mortality.
Appendices D and E provide an overview of the quality of included studies, as determined by QUADAS-2. There were no high risks of bias or applicability concerns in any of the domains. All studies were considered as low-risk in the index test domain, since LUS score protocol was pre-specified and researchers were blinded to reference standard if used. Highest risk of bias was found in flow and timing domain as a reference standard was not accomplished in every patients.
Characteristics of included patientsBetween 1st January and 12th August 2021, 1205 patients were admitted to the COVID-19 ward of the San Cecilio University Hospital with positive SARS-CoV-2 PCR. 1028 of them presented COVID-19 pneumonia, of which 310 had one or more of the exclusion criteria previously described. At last, from the eligible 718 patients, 127 consecutive patients were included in the study, depending on the availability of human and material resources. Patient selection process is represented in Fig. 3.

Participant flow diagram according to TRIPOD 2015 guidelines.13
Detailed description of the baseline characteristics of the patients is provided in Appendix F. Overall cohort were further subdivided into “poor outcome” and “28-days mortality” subgroups, and each of them based on whether or not the patients reported the outcome. The mean age of the overall cohort was 61 (IQR 48–73), being higher within the 28-days mortality group (58 vs. 78, p<0.001). There were also a higher proportion of male patients (63%) in the global cohort. Among patients’ previous comorbidities, there were statistically differences within the 28-days mortality subgroup in the proportion of chronic obstructive pulmonary disease (30.7% vs. 5.3%, p=0.001), chronic renal disease (38.5% vs. 11.4%, p=0.008), diabetes mellitus (61.5% vs. 20.2%, p=0.001), neoplasia (30.8% vs. 9.6%, p=0.025), cerebrovascular disease (23.1% vs. 6.1%, p=0.032), heart failure (23.1% vs. 3.5%, p=0.003; as in the poor outcome subgroup, 14.8% vs. 3%, p=0.017) and number of comorbidities (3 vs. 1, p=0.003). More frequent predictors for both poor outcome and 28-days mortality were mean SaO2 and PaO2–FiO2 ratio at admission. In addition, other significant differences within the poor outcome subgroup were the need for supplementary oxygen and the respiratory rate; while the estimated glomerular filtration rate was associated to 28-days mortality. Total LUS (17.1% vs. 14.8%, p=0.048) and the percentage of patients with LUS>15 (74.1% vs. 44%, p=0.006) was statistically higher in poor outcome group, but neither of them for 28-days mortality. We have not included a comparison of the baseline characteristics of our cohort against the included studies for feasibility reasons.
Analysis of the results from the articles included and its applicability in our cohortTable 1 synthesised the results of the included articles cut-off point analysis. For the cut-off points of the original endpoints reported in the articles, only the LUS>15 cut-off point for the critical disease 1 outcome reached statistical significance when validated in our cohort (p=0.006).38 However, both the >15 cut-off point (OR=3.636; CI 1.411–9.374, p=0.006) and the ≥17 cut-off point (OR=2.701; CI 1.131–6.452, p=0.023) showed a good performance when they were tested for poor outcome in our cohort. The ≥12 cut-off point showed a clear positive trend, but did not reach statistical significance. None of the proposed cut-off points were statistically significant for the prediction of 28-days mortality, although ≥24 also presented a positive trend.
Analysis of the results from our cohort of patientsThe Cox regression model assessed the direct association between LUS and poor outcome (OR 1.303; CI 1.137–1.493, p<0.001). We also observed this result in the association between LUS and 28-days mortality (OR 1.024; CI 1.006–1.042, p=0.003). Both associations are graphically demonstrated in Fig. 4.
 LUS and poor outcome, and (b) LUS and 28-days mortality.")
Additionally, the LUS cut-off point>15 shows the best diagnostic performance when choosing a single cut-off point in our cohort. The ROC curve calculation of the LUS cut-off point>15 according to the poor outcome variable shows an AUC=0.650, sensitivity=0.7407 (CI 0.5532–0.8683), specificity=0.56 (CI 0.4604–0.6551), negative predictive value=0.8889 (CI 0.7826–0.9505) and positive predictive value=0.3125 (CI 0.2719–0.3744).
The results of the cut-off point analysis among the included patients of our cohort are described in Table 2. The calculated sensitivity of the LUS≤7 cut-off point for poor outcome prediction is 0.89 (CI 0.695–0.955), while the specificity of the LUS> 20 cut-off point is 0.86 (CI 0.776–0.917). We also found statistically differences between the three subgroups defined by the high sensitivity cut-off points (p=0.005), as well as the high specificity subgroups (p=0.018), for poor outcome.
Performance of (a) high sensitivity and (b) high specificity cut-off points for poor outcome and 28-days mortality in our cohort.
| ≤7 | 8–15 | >15 | Total | Differences between subgroups | |
|---|---|---|---|---|---|
| Poor outcome (n, %) | |||||
| No | 6 (6.0%) | 50 (50.0%) | 44 (44.0%) | 100 (100.0%) | p=0.005 |
| Yes | 3 (11.1%) | 4 (14.8%) | 20 (74.1%) | 27 (100.0%) | |
| 28-Days mortality (n, %) | |||||
| No | 7 (6.1%) | 51 (44.7%) | 56 (49.1%) | 114 (100.0%) | p=0.217 |
| Yes | 2 (15.4%) | 3 (23.1%) | 8 (61.5%) | 13 (100.0%) | |
| Total (n, %) | 9 (7.1%) | 54 (42.5%) | 64 (50.4%) | 127 (100.0%) | |
| ≤15 | 16–20 | >20 | Total | Differences between subgroups | |
|---|---|---|---|---|---|
| Poor outcome (n, %) | |||||
| No | 56 (56.0%) | 30 (30.0%) | 14 (14.0%) | 100 (100.0%) | p=0.018 |
| Yes | 7 (25.9%) | 15 (55.6%) | 5 (18.5%) | 27 (100.0%) | |
| 28-Days mortality (n, %) | |||||
| No | 58 (50.9%) | 40 (35.1%) | 16 (14.0%) | 114 (100.0%) | p=0.595 |
| Yes | 5 (38.5%) | 5 (38.5%) | 3 (23.1%) | 13 (100.0%) | |
| Total (n, %) | 63 (49.6%) | 45 (35.4%) | 19 (15.0%) | 127 (100.0%) | |
Poor outcome: non-IMV or IMV or ICU or 28-days mortality.
The lack of reference cut-off points for LUS in clinical practice is one of the most challenging features of lung ultrasound evaluation in patients with COVID-19. This deficit precludes an evidence-based support for decisions such as the choice of treatment, the initiation of ventilatory support or the transfer to the ICU. This is the first study to establish reference cut-off points for the lung ultrasound score in COVID-19 pneumonia, since other studies described the data without proposing any consensus cut-off points.9
Among the cut-off points proposed in the articles included from our systematic review, in most of them their usefulness could not be reproduced in our cohort. Only the cut-off point LUS>15 proposed by Boero et al. for critical illness 2 (IMV, ICU or 30-days mortality) could be reproduced.38 This cut-off point also showed a good ability to predict poor outcome in our cohort, demonstrating that patients with LUS>15 are 3.636 times more likely to have a poor outcome, consistent with the preliminary analysis of this cohort.15 However, this association could not be proved for 28-days mortality prognosis. The LUS≥17 cut-off point also showed positive results, with a 2.701-fold increased risk of poor outcome, though the magnitude of this effect was more modest and neither reached statistical significance for 28-days mortality.
According to the results derived from our patient cohort, we can conclude that lung ultrasound is a good predictor of COVID-19 pneumonia prognosis. The LUS scale is associated with the likelihood of a poor outcome or 28-days mortality, revealing a magnitude of the effect that can be classified as “high”.39 For each point increase in LUS, the probability of suffering a poor outcome is increased by 30.3%, while the probability of suffering 28-days mortality increases by 2.4%. The LUS≤7 cut-off point is associated with a high sensitivity for ruling out severe COVID-19 pneumonia (0.89), which could be categorised as mild pneumonia. Between LUS 8 and 20 cut-off points poor outcome might occur, which would correspond to moderate pneumonia. This range could be subdivided into mild-moderate pneumonia between LUS 8–15 and moderate-severe pneumonia between LUS 16–20, based on the LUS>15 cut-off point. A LUS≥20 is associated with a notable specificity for poor outcome (0.86), corresponding to severe pneumonia. The classification of COVID-19 pneumonia into these three categories will provide the responsible physician with immediate information on the prognosis of the patient in order to decide the most appropriate treatment and the potential need for ventilatory support or transfer to intensive care.
In our cohort, however, these cut-off points could not be reproduced for 28-days mortality. There may be two possible explanations for this result. The first one, patients with 28-days mortality had a higher number of previous comorbidities, but they did not have a higher supplemental oxygen requirement and did not have a higher severity of pneumonia according to LUS. This may suggest that the patients who died were due to their comorbidities, rather than to the severity of COVID-19 pneumonia. The other possible explanation is the limited sample size of our cohort. Although we were able to demonstrate a statistically significant association between LUS and mortality, the differences obtained had a positive trend but did not reach statistical significance.
This study has some limitations to mention. Concerning the systematic review, the main limitation arose in relation to the inclusion criteria. Given the need to subsequently validate in our patient cohort the data obtained, we only included articles that had been carried out in a population and with outcomes similar to ours. This fact limits the external validity of the results, requiring further studies to assess these results in other settings (e.g. emergency department or ICU). Besides, although the sample size of each included article was larger than 30 patients, the limitation that only 4 of the 11 articles were multicentre may raise doubts about the existence of population bias in the included samples. Regarding our patient cohort, our limited sample size (18% of the eligible patients were included) may have conditioned our results, despite quota sampling selection. Hence, this may have influenced in the absence of statistically significant results in the 28-days mortality subgroup, but also in the external validation of the cut-off points proposed in the selected articles. Likewise, the exclusion criteria of patients unable to cooperate could represent a selection bias, as it does not include patients in a fragile situation who may be more susceptible of poor outcome. A primary goal of the study was to overcome the limitation of being an operator dependent technique, which required at least two operators to be simultaneously present during image acquire and interpretation. Nevertheless, we cannot conclude that the risk of observer bias has been completely excluded.
ConclusionsLung ultrasound is a good predictor of prognosis in COVID-19 pneumonia, being significantly associated with both the likelihood of poor outcome and 28-days mortality. The LUS≤7 cut-off point is associated with mild pneumonia, LUS 8–20 with moderate pneumonia (subclassified in mild-moderate pneumonia by LUS 8–15 and moderate-severe pneumonia by LUS 16–20) and LUS≥20 with severe pneumonia. If a single cut-off point were to be used, the LUS cut-off point with the highest diagnostic performance to discriminate mild from severe disease would be LUS>15. This categorisation will make possible to establish an early prognosis for the patient, and to guide the most appropriate treatment on an individual basis.
FundingThis research did not receive any specific grant from funding agencies in the public, commercial, or not-for-profit sectors.
Conflict of interestNone.
To Valme Sánchez Cabrera for her support in managing the database, to Camila Higueras Callejón and the “Escuela Andaluza de Salud Pública” for their support in the systematic review, and to all the healthcare professionals involved in COVID-19 assistance.
The following are the supplementary data to this article:
