


The 2019 coronavirus disease (COVID-19) has become a significant health and social challenge. Ever since it was declared a pandemic, the number of people infected by its causing virus, the severe acute respiratory syndrome coronavirus 2 (SARS-CoV-2), and deceased as a result of the disease has increased steadily. We are currently in the midst of a second wave of the epidemic, which is characterized by a significant increase in Emergency Room visits and hospital admissions, where it is not only necessary to meet the healthcare demand caused by COVID-19, but also to continue to provide care for patients with other pathological processes not related to SARS-CoV-2.
The polymerase chain reaction (PCR)–based molecular detection technique continues to be the most widely used diagnostic method for classifying a person as infected by the virus.1 In addition, this technique is also very useful for monitoring the evolution of the pandemic.2 However, we have not found any article evaluating the number of hospital admissions based on the rate of newly infected individuals. The main objective of this study is to determine whether there is an association between the percentage of individuals with a positive PCR test within a given population and the number of hospital admissions due to a SARS-CoV-2 infection, as well as to analyze the delayed influence over the following ten days.
To this end, a temporal analysis of the total number of PCR tests performed between 15 May 2020 and 1 November 2020 compared with the known number of SARS-CoV-2 infections was carried out. For this purpose, the daily percentage of new positive PCR tests and that of admissions from the Emergency Room due to a diagnosis of SARS-CoV-2 infection were taken into consideration.
A generalized linear regression model with a Poisson distribution was used to analyze the correlation between both variables, adjusting it based on the daily number of emergencies attended. To evaluate the possible delayed influence of the percentage of positive PCR tests, their percentages were analyzed in relation to the admissions that took place on the same day and up to ten days later (delay of 0 to 10 days). In addition, the relative risk (RR) of the number of daily admissions was calculated per every 1% or 5% daily increase in new positive PCR tests. The impact of this percentage on the number of daily admissions was quantified by calculating the attributable fraction (AF). Akaike’s information criterion was used to select the optimal model. A confidence level of 95% was deemed significant in all cases (p < 0.05).
A total of 81 497 PCR tests were performed during the study period, with 7 849 (9.63%) of them corresponding to new positives. The total number of emergencies attended throughout this period was 35 970, with a total of 6 726 resulting in hospital admissions. The daily mean number of admissions of patients with a SARS-CoV-2 infection was 4.71 (standard deviation [SD:] 6.33). The percentage of positive tests evolved unevenly as of epidemiological week 34, reaching a positivity rate of 18.17% at week 44, with a 39.84% increase in the number of hospital admissions at this point.
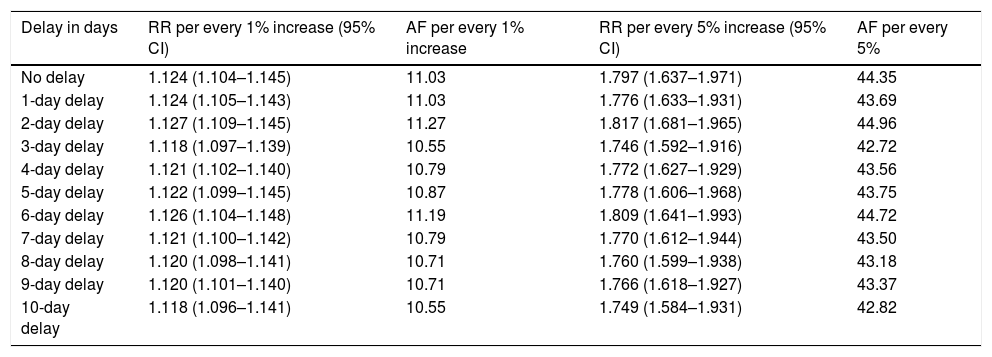
A significant association was detected between the number of daily admissions and the percentage of new daily positives (p < 0.001). This association was maintained throughout the ten days during which these variables were analyzed, although it was greater on the second and third days (Table 1).
Attributable fraction and relative risk of admission due to COVID-19 per every 1% and 5% increase in the number of new positive PCR tests and daily delay.
| Delay in days | RR per every 1% increase (95% CI) | AF per every 1% increase | RR per every 5% increase (95% CI) | AF per every 5% |
|---|---|---|---|---|
| No delay | 1.124 (1.104–1.145) | 11.03 | 1.797 (1.637–1.971) | 44.35 |
| 1-day delay | 1.124 (1.105–1.143) | 11.03 | 1.776 (1.633–1.931) | 43.69 |
| 2-day delay | 1.127 (1.109–1.145) | 11.27 | 1.817 (1.681–1.965) | 44.96 |
| 3-day delay | 1.118 (1.097–1.139) | 10.55 | 1.746 (1.592–1.916) | 42.72 |
| 4-day delay | 1.121 (1.102–1.140) | 10.79 | 1.772 (1.627–1.929) | 43.56 |
| 5-day delay | 1.122 (1.099–1.145) | 10.87 | 1.778 (1.606–1.968) | 43.75 |
| 6-day delay | 1.126 (1.104–1.148) | 11.19 | 1.809 (1.641–1.993) | 44.72 |
| 7-day delay | 1.121 (1.100–1.142) | 10.79 | 1.770 (1.612–1.944) | 43.50 |
| 8-day delay | 1.120 (1.098–1.141) | 10.71 | 1.760 (1.599–1.938) | 43.18 |
| 9-day delay | 1.120 (1.101–1.140) | 10.71 | 1.766 (1.618–1.927) | 43.37 |
| 10-day delay | 1.118 (1.096–1.141) | 10.55 | 1.749 (1.584–1.931) | 42.82 |
%: percentage; AF: attributable fraction; CI: confidence interval; RR: relative risk.
Our study confirms the existence of an association between the percentage of positive PCR tests obtained and the number of daily hospital admissions due to a SARS-CoV-2 infection. The greatest impact was observed on the second day, when the percentage of admissions reached 44.9% per every 5% increase in the number of positive tests. It has been suggested that epidemic curves of positive cases do not always accurately reflect the epidemic growth rate, as the performance rates of this technique may be influenced by its diagnostic capacity.3 In this sense, given that the number of hospital admissions is less affected and can better reflect the epidemiological situation, we have considered it to be a superior metric.4,5 The ability to estimate the likelihood of hospital admissions based on the percentage of positive PCR tests can aid in managing hospital resources more efficiently within the context of the pandemic.
FundingThis research was supported by the Network Center for Biomedical Research on Bioengineering, Biomaterials, and Nanomedicine (CIBER–BNN, Centro de Investigación Biomédica en Red de Bioingeniería. Biomateriales y Nanomedicina) through the Carlos III Institute (Instituto Carlos III) and the Regional Health Management Department of Castile and León (Gerencia Regional de Salud de Castilla y León) through its intensification program.
Please cite this article as: López-Izquierdo R, del Campo F, Eiros JM. Influencia de PCR SARS-CoV-2 positivas en los ingresos hospitalarios por COVID-19 en un área de salud española. Med Clin (Barc). 2021;156:407–408.
