


The global burden of disease (GBD) project measures the health of populations worldwide on an annual basis, and results are available by country. We used the estimates of the GBD to summarise the state of health in Spain in 2016 and report trends in mortality and morbidity from 1990 to 2016.
Material and methodsGBD 2016 estimated disease burden due to 333 diseases and injuries, and 84 risk factors. The GBD list of causes is hierarchical and includes 3 top level categories, namely: (1) communicable, maternal, neonatal, and nutritional diseases; (2) non-communicable diseases (NCDs), and (3) injuries. Mortality and disability-adjusted life-years (DALYs), risk factors, and progress towards the sustainable development goals (SDGs) are presented based on the GBD 2016 data in Spain.
ResultsThere were 418,516 deaths in Spain in 2016, from a total population of 46.5 million, and 80.5% of them occurred in those aged 70 years and older. Overall, NCDs were the main cause of death: 388,617 (95% uncertainty interval 374,959–402,486), corresponding to 92.8% of all deaths. They were followed by 3.6% due to injuries with 15,052 (13,902–17,107) deaths, and 3.5% communicable diseases with 14,847 (13,208–16,482) deaths. The 5 leading specific causes of death were ischaemic heart disease (IHD, 14.6% of all deaths), Alzheimer disease and other dementias (13.6%), stroke (7.1%), chronic obstructive pulmonary disease (6.9%), and lung cancer (5.0%). Remarkable increases in mortality from 1990 to 2016 were observed in other cancers, lower respiratory infections, chronic kidney disease, and other cardiovascular disease, among others. On the contrary, road injuries moved down from 8th to 32nd position, and diabetes from 6th to 10th. Low back and neck pain became the number one cause of DALYs in Spain in 2016, just surpassing IHD, while Alzheimer disease moved from 9th to 3rd position. The greatest changes in DALYs were observed for road injuries dropping from 4th to 16th position, and congenital disorders from 17th to 35th; conversely, oral disorders rose from 25th to 17th. Overall, smoking is by far the most relevant risk factor in Spain, followed by high blood pressure, high body mass index, alcohol use, and high fasting plasma glucose. Finally, Spain scored 74.3 of 100 points in the SDG index classification in 2016, and the main national drivers of detrimental health in SDGs were alcohol consumption, smoking and child obesity. An increase to 80.3 points is projected in 2030.
ConclusionLow back and neck pain was the most important contributor of disability in Spain in 2016. There has seen a remarkable increase in the burden due to Alzheimer disease and other dementias. Tobacco remains the most important health issue to address in Spain.
El estudio de la carga global de las enfermedades, conocido como GBD por sus siglas en inglés (global burden of disease), mide la salud poblacional en todo el mundo de forma anual y sus resultados están disponibles por país. Utilizamos las estimaciones GBD para resumir el estado de salud poblacional en España en 2016 y describir las tendencias en morbimortalidad de 1990 a 2016.
Material y métodosGBD 2016 estima la carga debida a 333 enfermedades y lesiones, y a 84 factores de riesgo. La lista de causas de GBD es jerárquica e incluye 3 categorías de nivel superior: 1) enfermedades transmisibles, maternas, neonatales y nutricionales; 2) enfermedades no transmisibles (ENT), y 3) accidentes. Se presentan la mortalidad, los años de vida ajustados por discapacidad (AVAD), los factores de riesgo y el progreso hacia los objetivos de desarrollo sostenible (ODS) a partir de los datos de GBD 2016 en España.
ResultadosEn 2016 en España hubo 418.516 muertes, de una población total de 46,5 millones, y el 80,5% de ellas ocurrieron en personas de 70 años o más. Las ENT fueron la principal causa de muerte (92,8%), con 388.617 (intervalo de incertidumbre del 95% 374.959–402.486), seguidas de los accidentes (3,6%), con 15.052 (13.902–17.107), y de las enfermedades transmisibles (3,5%), con 14.847 (13.208–16.482) muertes. Las 5 principales causas específicas de muerte fueron la cardiopatía isquémica (CI), con el 14,6% de todas las muertes, la enfermedad de Alzheimer y otras demencias (13,6%), el accidente cerebrovascular (7,1%), la enfermedad pulmonar obstructiva crónica (6,9%) y el cáncer de pulmón (5,0%). Se observaron incrementos notables en la mortalidad de 1990 a 2016 en otros cánceres, infecciones respiratorias del tracto inferior, enfermedad renal crónica y otras enfermedades cardiovasculares, entre otros. Por el contrario, los accidentes de tráfico bajaron del puesto 8 al 32 y la diabetes del 6 al 10. Los dolores de espalda y cervicales se convirtieron en la causa principal de AVAD en España en 2016, superando a la CI, mientras que la enfermedad de Alzheimer pasó del puesto 9 al 3. Los mayores cambios en AVAD se observaron para accidentes de tráfico, que cayeron de la posición 4 a la posición 16, y los trastornos congénitos, de la 17 a la 35; por el contrario, los trastornos orales aumentaron, pasando del puesto 25 al 17. En general, fumar es, con mucho, el factor de riesgo más relevante en España, seguido de presión arterial alta, índice de masa corporal alto, consumo de alcohol y glucemia alta en ayunas. Finalmente, España obtuvo 74,3 sobre 100 puntos en la clasificación del índice ODS en 2016, y los principales determinantes de salud nacionales relacionados con los ODS fueron el consumo de alcohol, el tabaquismo y la obesidad infantil. Se proyecta un aumento a 80,3 puntos en 2030.
ConclusiónLos dolores de espalda y cervical fueron el contribuyente más importante de discapacidad en España en 2016. Hubo un aumento notable de la carga poblacional debida a la enfermedad de Alzheimer y otras demencias. El tabaco sigue siendo el riesgo para la salud más importante que debe abordarse en España.
The first Global Burden of Disease (GBD) report was published in 1997,1 and it now measures the health of populations worldwide on an annual basis.2 GBD produces age-, sex-, and country-specific estimates (including selected subnational units) of cause-specific mortality and morbidity, risk factor exposure, mortality and morbidity attributable to these risks, and a range of health system characteristics, from 1990 to the most recent year available. Various summary measures are computed, including disability-adjusted life-years (DALYs) and healthy life expectancy (see Box for related terms and their definitions). GBD uses highly standardised, validated approaches, which are applied to all available data sources and adjusted for major sources of bias. Further details on GBD 2016, which covers 1990–2016, are available elsewhere.3 As with all iterations of the GBD study, GBD 2016 provides an update of the full-time series based on methodological improvements and newly identified data sources. Further information on recent changes and future improvements of the GBD initiative are available elsewhere.4
The GBD 2016 report, published in September 2017, represents a unique opportunity for studies addressing health metrics and their determinants in a given country, using a standardised methodology for the correction of contextual issues at the national level, depending on the quality of available statistics. Although the GBD initiative constitutes a source of internationally comparable information on the burden of disease and its determinants, the availability of such information at the national level with a greater degree of geographic disaggregation is an important asset for the development and implementation of health policies. In recent years, countries such as Brazil, Ethiopia, Japan, India, England, Mexico, Sweden, the USA, and others have developed the GBD nationally and sub-nationally, and their experience provides a useful basis to extend this practice to other countries. Elsewhere, there are already several GBD national-specific papers,5–9 including some focused on specific diseases.10,11 that already provided relevant insights of health states and changes over time.
Spain does not yet have a national burden of disease initiative, but there are other sources of information that provide similar information. Regarding morbidity, since 1987, and every five years since, the Ministry of Health in Spain comprehensively surveys health indicators through the Encuesta Nacional de Salud (The National Health Interview Survey of Spain).12 The latest available is the 2011/12 report,13 which collected health information relative to the population resident in Spain from a representative sampling of 21,508 households. Several of the 17 autonomous communities of Spain also produce comprehensive regional reports, available elsewhere.14 In addition, the European Health Interview Surveys (EHIS),15 coordinated by EUROSTAT, was updated in 2014 with health information on Spain. However, none of these morbidity data comprehensively covers all health conditions.
Assessment of attributable risk factors is an important component of public health policies. However, the information is much more scarce and partial regarding risk factors in Spain, only available for some periods and areas.16 Indeed, the current information systems in Spain do not provide systematic comparative risk assessment of the main health determinants, which is an important limitation.
A previous analysis, based on GBD 2010, was reported of Spain in 2014,17 and the country profile of Spain has been updated with GBD 2016 data.18 To date, there are also two additional Spain reports using GBD methodology,19,20 and one reporting disease burden in the autonomous region of Comunidad Valenciana.21
This study presents GBD 2016 results focused on Spain, mirroring the template of the recent GBD 2016 capstone papers.3,22 In particular, we further explored Spain's performance on the Sustainable Development Goals (SDGs).23 The SDGs were established by the United Nations (UN) General Assembly on September 2015, including 17 universal goals, 169 targets, and 230 indicators leading up to 2030.24
The main objectives of this paper are to use the estimates of the GBD 2016 study to provide an updated description of the current state of health in Spain, and to report trends in mortality and morbidity from 1990 to 2016. Ultimately, it should contribute to set up and prioritise public health interventions, including current and future unmet needs in the country.
MethodsBefore the GBD project was initiated in 1991, no comprehensive assessments of human health had been carried out. GBD is a global comparative risk assessment exercise, with the first preliminary results (for base year 1990) published in the World Development Report 1993.25 This international collaborative effort is currently led by the Institute for Health Metrics and Evaluation (IHME) in Seattle, Washington, USA.2 This analysis complies with the Guidelines for Accurate and Transparent Health Estimates Reporting (GATHER).26 The GBD 2016 initiative includes 400.8 million condition-age-sex-location-years data points, which produce more than 3.5 billion estimated quantities.4 Although most of them are available from the IHME website,2 this information needs to be filtered and interpreted in a coherent, consistent way, for its presentation and eventual use and implementation, at its global, national and other granularity levels.
In Spain, the main source of mortality data is the Mortality Information System.27 The GBD uses methodologies for correcting the underreporting of deaths and garbage codes. Correction of the codes uses evidence from the medical literature, expert opinions and statistical techniques to designate each item to the most probable causes of death.22
After addressing data quality issues, the GBD 2016 study employed a variety of statistical models to determine the number of deaths from each cause, through the cause of death ensemble model (CODEm) algorithm. To ensure that the number of deaths per cause did not exceed the total number of estimated deaths, a correction technique called CoCorrect was used. This technique ensures that estimates of the number of deaths from each cause do not total more than 100% of deaths in a given year, age band, and sex strata.28 After producing estimates for the number of deaths from each of the 264 fatal outcomes included in the list of causes of the GBD 2016 study, the years of life lost (YLLs) due to premature death were calculated. For every death due to a particular cause, the number of years lost was estimated based on the highest life expectancy in the deceased individual's age group.29,30 The GBD study used a list of causes that placed 333 causes of death within a four-level hierarchy. The first level divided causes into three groups: communicable, maternal, neonatal, and nutritional diseases (CMNNDs); non-communicable diseases (NCDs), and injuries. The second level consisted of 20 major causes of diseases such as neonatal disorders, cardiovascular diseases and traffic injuries. The third level subdivided level 2 into types such as neonatal preterm birth complications, cerebrovascular disease and traffic injuries; and the fourth level further subdivided those types in some cases, for example: ischaemic stroke and haemorrhagic stroke; and pedestrian road injuries, cyclist road injuries, motorcyclist road injuries, motor vehicle road injuries and other road injuries. All specific GBD codes in ICD9 and/or ICD10 for each disease and condition are available at: http://www.healthdata.org/sites/default/files/files/data_for_download/2012/IHME_GBD2010_CauseListandICD.pdf. Just as a token, there are 194 data sources on neck pain http://www.ghdx.healthdata.org/keyword/neck-pain and 730 data sources on back pain http://www.ghdx.healthdata.org/keyword/back-pain.
The redistribution of impossible or non-underlying causes of death (so-called “garbage codes”), was conducted according GBD methodology, as explained elsewhere.3 Uncertainty in GBD estimates is attributable to cause-specific model specifications; varied availability of data by age, sex, location, or year; and variability of sample size within data sources. Therefore, this uncertainty estimation considers time lags in some data, the absence of data from specific conditions, age groups, or time periods, or unreliability in the data that are available.
The study used the concept of premature mortality, as previously employed by the World Health Organization (WHO) and the UN, respectively in the Global Plan for NCDs (2013) and in the SDGs for NCDs (2015). Although there is no consensus on the definitions of preventable versus premature death, the WHO proposes using premature deaths to define those that occur before age 70, or deaths that occur before the average age of death in a population. As the World population is taken as a GBD reference, and its life expectancy was 71.4 years in 2016, it could be approximated that premature deaths worldwide and in Spain are those that occur at age 70 years or younger. A full explanation is available via these links: https://www.cancer.gov/publications/dictionaries/cancer-terms/def/premature-death and http://www.who.int/gho/mortality_burden_disease/life_tables/situation_trends/en. The 20 leading causes of death were analysed using the level 3 aggregation of causes of death from the GBD 2016 study, in the age group from 30 to 69 years. The results were compared between the years 1990, 2006 and 2016.
Information on risk factors and their attributable DALYs can be found elsewhere.31 Briefly, GBD uses the comparative risk assessment framework developed for previous iterations to estimate levels and trends in exposure, attributable deaths, and attributable DALYs, by age group, sex, year, and location for 84 behavioural, environmental and occupational, and metabolic risks or clusters of risks from 1990 to 2016. The GBD study included 481 risk-outcome pairs that met the GBD study criteria for convincing or probable evidence of causation. The IHME extracted relative risk (RR) and exposure estimates from 22,717 randomised controlled trials, cohorts, pooled cohorts, household surveys, census data, satellite data, and other sources, according to the GBD 2016 source counting methods. Using the counterfactual scenario of theoretical minimum risk exposure level, the portion of deaths and DALYs that could be attributed to a given risk were estimated.
SDGs were further explored in Spain, both in GBD 2015,32 and also in GBD 2016.33 The 17 SDGs and their 169 targets were formally adopted by all UN member states in September 2015. There are 50 health-related indicators (i.e.: indicators that directly involve health services, health outcomes, and risk factors with well-established causal connections to health). They are part of the 29 health-related targets and 11 goals, including SDG 3, which aims to “ensure healthy lives and promote wellbeing for all at all ages”.
All GBD research is conducted on a public-domain secondary database, without nominal identification, in accordance with US Decree No. 7724 of May 16, 2012, and Resolution No. 510 of April 7, 2016; thus, there was no need to submit this study to a research ethics committee, neither in the USA nor in Spain, as no ethics approval was required.
Statistical analysisInformation about the data sources, estimation methods, computational tools, and statistical analysis used in the derivation of GBD estimates are available elsewhere.3 All calculations are presented with 95% bootstrapped uncertainty intervals (UI), modelled by resampling the sample data and performing inference about a sample from resampled data, calculated using the R boot package (with 1000 iterations) which is implemented in R,34 an open-source statistical software.35 The 95% UIs were calculated using the 2.5th and 97.5th percentiles, and point estimates were calculated from the mean of the draws; they take into account the uncertainty in the epidemiological parameters used to estimate YLLs, YLDs and DALYs.
ResultsIn 2016, the total population of Spain was 46.5 million (23.7 million women, and 22.8 million men). The distribution by age and sex of the Spanish population (Fig. 1) has shifted from 1990 to 2006 and then to 2016, to substantially older age groups in both women and men, with significant population ageing accordingly, particularly in women. These changes in size, sex and age distribution, and other demographic trends, affect the health burden and determine health-related trends, as reported below by mortality and DALYs; risk factors; and the SDGs. To facilitate comparison, some estimates are reported as age-standardised. Assessing trends in any health indicator based on absolute, relative, or adjusted data by age and other variables, often produces different, even opposite results, which require careful interpretation. Commonly, the use and users of each of these trends are diverse: for practicing physicians, especially in Primary Care, the absolute and crude number of cases of any given disease helps to determine the volume of work needed now and in the future; on the contrary, percentages and relative rates are very useful for managers, health administrators and politicians, to allocate resources, always limited, and distribute them by specialty, level of care, and interventions/programmes; finally, epidemiologists use standardised rates by age (and by sex, comorbidities, geography,...) to explore the causes and determinants of disease, and establishing trends taking into account any changes in the structure of the population pyramid, migration, and other factors.
Mortality and DALYs in 1990, 2006 and 2016.")
The main causes of death and YLLs in Spain in 2016 by age group and by sex are shown in Table 1. Overall, it is estimated that there were 418,516 deaths in Spain in 2016; 80.5% of all deaths occurred in those aged 70 years and older. NCDs were the main cause of death: 388,617, 95% UI (374,959–402,486), with 92.8%. They were followed by 3.6% due to injuries with 15,052 (13,902–17,107) deaths, and 3.5% CMNNDs with 14,847 (13,208–16,482) deaths.
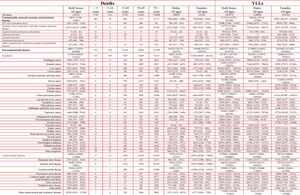
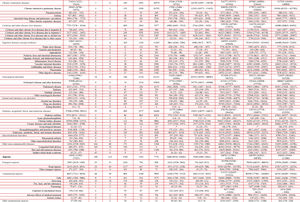

The ranking of specific causes of death was led by ischaemic heart disease (IHD) 60,983 (57,094–65,803), second Alzheimer's disease and other dementias with 57,098 (49,114–65,392), third cerebrovascular disease 29,646 (26,209–33,330), and fourth chronic obstructive pulmonary disease (COPD) 28,945 (26,786–31,071). Within communicable diseases, diarrhoea, lower respiratory, and other common infectious disease accounted for 12,203 (10,612–13,860) deaths, while HIV/AIDS and tuberculosis totalled 1091 (1028–1156). Overall, lung cancer (plus tracheal and bronchus) were the most frequent in cancer deaths with 20,891 (19,418–22,539), followed by colon and rectum cancers with 15,984 (14,712–17,503). By sex, breast cancer accounted for 6949 (6291–7661) deaths, with 6793 (6125–7496) deaths in women and 156 (96–188) deaths in men; and, there were 7355 (6272–10,647) prostate cancer deaths.
Similarly expressed as before, total YLLs were 5,428,970, made of 3,188,866 in men and 2,240,104 in women. Of them, 88.9% of YLLs were due to NCDs, that is 4,826,975 (4,628,334–5,032,975), followed by 6.8% due to injuries with 368,761 (339,861–419,015), and by 4.3% due to CMNNDs with 233,235 (210,259–259,358) YLLs. YLLs due to injury were nearly double in men than in women, 8.4% vs 4.5%, respectively, being YLLs for females were 1.8% of total YLLs or 27.1% of YLLs due to injuries, while YLLs for males were 4.9% of total YLLs or 72.9% of YLLs due to injuries.
Further to Table 1, a graphical treemap presentation of causes of death in 2016 can be seen in Fig. 2a. The five leading specific causes of death were: 1. IHD with 14.6% (13.8–15.5%) of all deaths and with an annual change of −1.1% from 1990; 2. Alzheimer disease and other dementias with 13.6% (11.8–15.6%) of all deaths and with a highly positive annual increase of 2.6%; 3. stroke with 7.1% (6.3–7.9%) of all deaths and with an annual change of −1.6%; 4. COPD with 6.9% (6.5–7.4%) of all deaths and with an annual change of 1.1%; and 5. lung cancer (5.0% (4.7–5.3%) of all deaths and with an annual change of 0.6%. Diseases are also represented as YLDs (Fig. 2b), and as DALYs (Fig. 2c), where % change is shown in for both measures too.
, YLDs (b), and DALYs (c).")
Changes in ranking of causes of death from 1990 to 2006 to 2016 for both age-standardised and all ages are explored in Fig. 3, where no changes were observed in the top five causes of deaths per 100,000 rates since 1990 as IHD, stroke, Alzheimer disease, COPD and lung cancer, except from a switch of positions in 2006 in Alzheimer disease per stroke. The most remarkable increase in ranking was atrial fibrillation (from 1990 to 2016), pancreatic cancer, and Parkinson's disease. Remarkable increases in the ranking of causes of death were also observed in other cancers, lower respiratory infections, chronic kidney disease (CKD), and other CVD, among others. The main communicable cause of death, lower respiratory tract infection moved up in this ranking from 10th to 7th already from 2006, and CKD disease climbed to the top ten causes of death, from 11th to 8th. On the opposite trend, road injuries moved down from position 8th to 32nd, and diabetes from 6th to 10th.

As compared to crude deaths, YLD and DALYS show a very different picture of the disease burden. Change in trends in YLDs and DALYs from 1990 to 2006 to 2016 are also presented in Figs. 4 and 5. In Fig. 4, it can be seen that low back and neck pain remained the number one cause of YLDs in Spain during the entire period, while sense organ diseases overcame migraine as the second most frequent cause of YLDs from 2006. Completing the top 5 causes of YLDs from 1990 to 2016 were in 4th position skin diseases and 5th depressive disorders. It can be seen in Fig. 5 that low back and neck pain became the number one cause of DALYs in Spain from 2006, just surpassing IHD in the ranking, while Alzheimer disease moved from 9th to 3rd position. The greatest changes were observed in DALYs for road injuries dropping from 4th to 16th position, and congenital disorders from 17th to 35th; on an opposite trend, oral disorders raised from 25th to 17th.


In Fig. 6, the sex differences in YLD rates per 100,000 for 21 Level 2 causes by age for 2016 are compared. Apart from differences in sex-specific disorders, like prostate or breast cancers, there were no large differences in the distribution of male and female YLDs.
 Male; (b) Female.")
The relationship of global age-standardised YLD rates per 100,000 in 2016 and the annualised rate of change in age-standardised YLD rates for each Level 3 cause, from 2006 to 2016 in Spain for both sexes is presented in Fig. 7. It indicates that the conditions with the largest YLD rates per 100,000 in 2016, such as back and neck disorders, migraine, skin disorders, depression and anxiety increased in burden from 2006, while sense disorders and migraine did not materially change. Other musculoskeletal conditions, and other cancers also increased, although with less YLD burden in 2016. Significant decreases were observed for a number of infectious diseases (leishmaniosis, whooping cough, tuberculosis, diphtheria and other neglected tropical diseases) as well as for epilepsy and road injuries.
 are excluded. A Fib: atrial fibrillation and flutter; ADHD: attention-deficit/hyperactivity disorder; AGN: acute glomerulonephritis; ALS: motor neuron disease; ASD: autistic spectrum disorders; Afr Tryp: African trypanosomiasis; Alcohol: alcohol use disorders; Alzheimer: Alzheimer disease and other dementias; Animal: animal contact; Anxiety: anxiety disorders; Appendicit: appendicitis; Asthma: asthma; Back+Neck: low back and neck pain; Bipolar: bipolar disorder; Bladder C: bladder cancer; Brain C: brain and nervous system cancer; Breast C: breast cancer; CKD: chronic kidney disease; CMP: cardiomyopathy and myocarditis; COPD: chronic obstructive pulmonary disease; Cervix C: cervical cancer; Chagas: Chagas disease; Cirr Alc: cirrhosis and other chronic liver diseases due to alcohol use; Cirr HepB: cirrhosis and other chronic liver diseases due to hepatitis B; Cirr HepC: cirrhosis and other chronic liver diseases due to hepatitis C; Colorect C: colon and rectum cancer; Comp Abort: maternal abortion, miscarriage, and ectopic pregnancy; Conduct: conduct disorder; Conflict Terror: conflict and terrorism; Congenital: congenital birth defects; Cysticer: cysticercosis; Dengue: dengue; Depression: depressive disorders; Diabetes: diabetes mellitus; Diarrhea: diarrheal diseases; Diphtheria: diphtheria; Disaster: exposure to forces of nature; Drown: drowning; Drugs: drug use disorders; Eating: eating disorders; Ebola: Ebola; Echino: cystic echinococcosis; Encepha: encephalitis; Endocar: endocarditis; Endocrine: endocrine, metabolic, blood, and immune disorders; Epilepsy: epilepsy; Esophag C: esophageal cancer; Exec & Police: executions and police conflict; F Body: foreign body; FB Trema: food-borne trematodiases; Falls: falls; Fire: fire, heat, and hot substances; GWD: Guinea worm disease; Gall Bile: gallbladder and biliary diseases; Gallblad C: gallbladder and biliary tract cancer; Gastritis: gastritis and duodenitis; Gout: gout; Gyne: gynecological diseases; HIV: HIV/AIDS; HTN HD: hypertensive heart disease; Heat+cold: environmental heat and cold exposure; Hemog: hemoglobinopathies and hemolytic anemias; Hep: acute hepatitis; Hernia: inguinal, femoral, and abdominal hernia; Hodgkin: Hodgkin lymphoma; IBD: inflammatory bowel disease; ID: idiopathic developmental intellectual disability; IHD: ischemic heart disease; ILD: interstitial lung disease and pulmonary sarcoidosis; Ileus: paralytic ileus and intestinal obstruction; Intest Inf: intestinal infectious diseases; Iodine: iodine deficiency; Iron: iron-deficiency anemia; Kidney C: kidney cancer; LF: lymphatic filariasis; LRI: lower respiratory infections; Larynx C: larynx cancer; Leish: leishmaniasis; Leprosy: leprosy; Leukemia: leukemia; Lip Oral C: lip and oral cavity cancer; Liver C: liver cancer; Lung C: tracheal, bronchus, and lung cancer; Lymphoma: non-Hodgkin lymphoma; MS: multiple sclerosis; Malaria: malaria; Mat HTN: maternal hypertensive disorders; Mat Hem: maternal hemorrhage; Mat Sepsis: maternal sepsis and other maternal infections; Measles: measles; Mech: exposure to mechanical forces; Med Treat: adverse effects of medical treatment; Melanoma: malignant skin melanoma; Meningitis: meningitis; Mesothel: mesothelioma; Migraine: migraine; Myeloma: multiple myeloma; NN Enceph: neonatal encephalopathy due to birth asphyxia and trauma; NN Hemol: hemolytic disease and other neonatal jaundice; NN Preterm: neonatal preterm birth complications; NN Sepsis: neonatal sepsis and other neonatal infections; Nasoph C: nasopharynx cancer; Nematode: intestinal nematode infections; Obst Labor: maternal obstructed labor and uterine rupture; Oncho: onchocerciasis; Oral: oral disorders; Osteoarth: osteoarthritis; Oth Cardio: other cardiovascular and circulatory diseases; Oth Cirr: cirrhosis and other chronic liver diseases due to other causes; Oth Digest: other digestive diseases; Oth MSK: other musculoskeletal disorders; Oth Mat: other maternal disorders; Oth Ment: other mental and substance use disorders; Oth NN: other neonatal disorders; Oth NTD: other neglected tropical diseases; Oth Neopla: other neoplasms; Oth Neuro: other neurological disorders; Oth Nutr: other nutritional deficiencies; Oth Phar C: other pharynx cancer; Oth Resp: other chronic respiratory diseases; Oth Trans: other transport injuries; Oth Un Inf: other unspecified infectious diseases; Oth Unint: other unintentional injuries; Otitis: otitis media; Ovary C: ovarian cancer; PAD: peripheral artery disease; PEM: protein-energy malnutrition; PUD: peptic ulcer disease; Pancreas C: pancreatic cancer; Pancreatit: pancreatitis; Parkinson: Parkinson disease; Pneumocon: pneumoconiosis; Poison: poisonings; Prostate C: prostate cancer; RHD: rheumatic heart disease; Rabies: rabies; Rheu Arth: rheumatoid arthritis; Road Inj: road injuries; STD: sexually transmitted diseases excluding HIV; Schisto: schistosomiasis; Schiz: schizophrenia; Self Harm: self-harm; Sense: sense organ diseases; Skin: skin and subcutaneous diseases; Skin C: non-melanoma skin cancer; Stomach C: stomach cancer; Stroke: stroke; TB: tuberculosis; Tens Head: tension-type headache; Testis C: testicular cancer; Tetanus: tetanus; Thyroid C: thyroid cancer; Trachoma: trachoma; URI: upper respiratory infections; Urinary: urinary diseases and male infertility; Uterus C: uterine cancer; Varicella: varicella and herpes zoster; Vasc Intest: vascular intestinal disorders; Violence: interpersonal violence; Vit A: vitamin A deficiency; Whooping: whooping cough; Yellow Fev: yellow fever; Zika: zika virus.")
Relationship of global age-standardised YLD rates per 100,000 in 2016 and the annualised rate of change in age-standardised YLD rates for each Level 3 cause, 2006–2016, Spain both sexes.
For both sexes combined. Age-standardized YLD rates are represented on a logarithmic scale on the x-axis. Causes for which the annualised rate of change is not significant are listed in italics. Level 3 causes related to shocks (conflict and terrorism, state actor violence, and exposures to forces of nature) are excluded. A Fib: atrial fibrillation and flutter; ADHD: attention-deficit/hyperactivity disorder; AGN: acute glomerulonephritis; ALS: motor neuron disease; ASD: autistic spectrum disorders; Afr Tryp: African trypanosomiasis; Alcohol: alcohol use disorders; Alzheimer: Alzheimer disease and other dementias; Animal: animal contact; Anxiety: anxiety disorders; Appendicit: appendicitis; Asthma: asthma; Back+Neck: low back and neck pain; Bipolar: bipolar disorder; Bladder C: bladder cancer; Brain C: brain and nervous system cancer; Breast C: breast cancer; CKD: chronic kidney disease; CMP: cardiomyopathy and myocarditis; COPD: chronic obstructive pulmonary disease; Cervix C: cervical cancer; Chagas: Chagas disease; Cirr Alc: cirrhosis and other chronic liver diseases due to alcohol use; Cirr HepB: cirrhosis and other chronic liver diseases due to hepatitis B; Cirr HepC: cirrhosis and other chronic liver diseases due to hepatitis C; Colorect C: colon and rectum cancer; Comp Abort: maternal abortion, miscarriage, and ectopic pregnancy; Conduct: conduct disorder; Conflict Terror: conflict and terrorism; Congenital: congenital birth defects; Cysticer: cysticercosis; Dengue: dengue; Depression: depressive disorders; Diabetes: diabetes mellitus; Diarrhea: diarrheal diseases; Diphtheria: diphtheria; Disaster: exposure to forces of nature; Drown: drowning; Drugs: drug use disorders; Eating: eating disorders; Ebola: Ebola; Echino: cystic echinococcosis; Encepha: encephalitis; Endocar: endocarditis; Endocrine: endocrine, metabolic, blood, and immune disorders; Epilepsy: epilepsy; Esophag C: esophageal cancer; Exec & Police: executions and police conflict; F Body: foreign body; FB Trema: food-borne trematodiases; Falls: falls; Fire: fire, heat, and hot substances; GWD: Guinea worm disease; Gall Bile: gallbladder and biliary diseases; Gallblad C: gallbladder and biliary tract cancer; Gastritis: gastritis and duodenitis; Gout: gout; Gyne: gynecological diseases; HIV: HIV/AIDS; HTN HD: hypertensive heart disease; Heat+cold: environmental heat and cold exposure; Hemog: hemoglobinopathies and hemolytic anemias; Hep: acute hepatitis; Hernia: inguinal, femoral, and abdominal hernia; Hodgkin: Hodgkin lymphoma; IBD: inflammatory bowel disease; ID: idiopathic developmental intellectual disability; IHD: ischemic heart disease; ILD: interstitial lung disease and pulmonary sarcoidosis; Ileus: paralytic ileus and intestinal obstruction; Intest Inf: intestinal infectious diseases; Iodine: iodine deficiency; Iron: iron-deficiency anemia; Kidney C: kidney cancer; LF: lymphatic filariasis; LRI: lower respiratory infections; Larynx C: larynx cancer; Leish: leishmaniasis; Leprosy: leprosy; Leukemia: leukemia; Lip Oral C: lip and oral cavity cancer; Liver C: liver cancer; Lung C: tracheal, bronchus, and lung cancer; Lymphoma: non-Hodgkin lymphoma; MS: multiple sclerosis; Malaria: malaria; Mat HTN: maternal hypertensive disorders; Mat Hem: maternal hemorrhage; Mat Sepsis: maternal sepsis and other maternal infections; Measles: measles; Mech: exposure to mechanical forces; Med Treat: adverse effects of medical treatment; Melanoma: malignant skin melanoma; Meningitis: meningitis; Mesothel: mesothelioma; Migraine: migraine; Myeloma: multiple myeloma; NN Enceph: neonatal encephalopathy due to birth asphyxia and trauma; NN Hemol: hemolytic disease and other neonatal jaundice; NN Preterm: neonatal preterm birth complications; NN Sepsis: neonatal sepsis and other neonatal infections; Nasoph C: nasopharynx cancer; Nematode: intestinal nematode infections; Obst Labor: maternal obstructed labor and uterine rupture; Oncho: onchocerciasis; Oral: oral disorders; Osteoarth: osteoarthritis; Oth Cardio: other cardiovascular and circulatory diseases; Oth Cirr: cirrhosis and other chronic liver diseases due to other causes; Oth Digest: other digestive diseases; Oth MSK: other musculoskeletal disorders; Oth Mat: other maternal disorders; Oth Ment: other mental and substance use disorders; Oth NN: other neonatal disorders; Oth NTD: other neglected tropical diseases; Oth Neopla: other neoplasms; Oth Neuro: other neurological disorders; Oth Nutr: other nutritional deficiencies; Oth Phar C: other pharynx cancer; Oth Resp: other chronic respiratory diseases; Oth Trans: other transport injuries; Oth Un Inf: other unspecified infectious diseases; Oth Unint: other unintentional injuries; Otitis: otitis media; Ovary C: ovarian cancer; PAD: peripheral artery disease; PEM: protein-energy malnutrition; PUD: peptic ulcer disease; Pancreas C: pancreatic cancer; Pancreatit: pancreatitis; Parkinson: Parkinson disease; Pneumocon: pneumoconiosis; Poison: poisonings; Prostate C: prostate cancer; RHD: rheumatic heart disease; Rabies: rabies; Rheu Arth: rheumatoid arthritis; Road Inj: road injuries; STD: sexually transmitted diseases excluding HIV; Schisto: schistosomiasis; Schiz: schizophrenia; Self Harm: self-harm; Sense: sense organ diseases; Skin: skin and subcutaneous diseases; Skin C: non-melanoma skin cancer; Stomach C: stomach cancer; Stroke: stroke; TB: tuberculosis; Tens Head: tension-type headache; Testis C: testicular cancer; Tetanus: tetanus; Thyroid C: thyroid cancer; Trachoma: trachoma; URI: upper respiratory infections; Urinary: urinary diseases and male infertility; Uterus C: uterine cancer; Varicella: varicella and herpes zoster; Vasc Intest: vascular intestinal disorders; Violence: interpersonal violence; Vit A: vitamin A deficiency; Whooping: whooping cough; Yellow Fev: yellow fever; Zika: zika virus.
Finally, in Fig. 8 DALYs by sex in all ages for Spain in 2016, are compared with Western Europe and the World. While the total number of DALYs was lower for Spain, their overall distribution in Spain mirrors the one of Western Europe by sex, particularly for the low rates of communicable diseases and also injuries in both males and females, which are disproportionally greater globally; also transport injuries in males appear to be much lower in Western Europe and Spain compared with global rates. Au contraire, DALYs by sex in Spain due to NCDs appear equally distributed as it happens at the global level.
Risk factors
Standardised rates of DALYs (Level 3) attributable to major risk factors in Spain in 2016 are shown in Fig. 9. Overall, smoking is the most relevant risk factor in Spain contributing to 2363.96 (2161.83–2569.73) DALYs per 100,000, mostly due to cancer, CVD and then chronic respiratory diseases. Next in the ranking of risk factors were high blood pressure, high body mass index (BMI), alcohol use, high fasting plasma glucose, high total cholesterol, impaired kidney function, low nuts and seeds, low whole grains and ambient particulate matter. Among the environmental risk factors included in GBD 2016, ambient particulate matter (10th), occupational carcinogens (12th), low physical activity (13th) and occupational, ergonomic risk factors (20th) were among the top 20.
 attributable to major risk factors in Spain in 2016.")
The top risk factors contributing to DALYs in percentage in 2016, by sex are presented in Fig. 10A and B. In Spanish males, smoking continues to be the leading risk factor followed by alcohol and drug use, high-systolic blood pressure and then dietary risks. In females, high BMI comes as the first risk factor, followed by high-systolic blood pressure, dietary risks, high fasting plasma glucose, alcohol and drug use, and tobacco; air pollution appears in the 10th position of risk factors in both genders. In Fig. 11, changes in mortality attributable to major risk factors according to population-level determinants from 1990, 2006 to 2016 were relatively minor, with behavioural and metabolic risk factors dominating the rankings with few changes from 2006 to 2016. Smoking was the number one risk factor in this regard, and high blood pressure was second from 1990 to 2016, while high BMI switched with alcohol from 4th to 3rd cause of DALYs since 2006.


Finally, Fig. 12 shows several estimators of smoking in Spain. Historically, the percentage of daily smokers declined from 1980 to 2016, with a higher decline in men (from 41% to 26%) than in women (from 21% to 17%), in whom there is an apparent stagnation from 2005 onwards. Interestingly, in 2015 the prevalence of daily smoking is higher in men than in women in all ages, except the younger. Namely, for adolescents they are nearly even: 19% (95%UI: 13–28%) in young females and 18% (95%UI: 12–26%) in young males. And most worryingly, smoking prevalence in children (10-14years) is already higher in girls 4.5% (2.5–7.7%) than in boys 2.6% (1.4–4.4%).
Sustainable Development Goals.")
In 2016, Spain scored 74.3 (UI 67.9–81.3) of 100 points in the SDG index classification, ranking 23rd globally,33 and with a significant decline from its 7th position in 2015.32 From 2016 a further (but slow) increase to 80.3 points (70.5–86.7) in 2030 is projected (Fig. 13). An analysis of the components of the SDG index in Spain based upon GBD 2016 (Fig. 14) indicates that the main national drivers of detrimental health in SDGs were alcohol consumption, as measured by the health indicator summary exposure value (SEV) for alcohol use, with only 10.1 (UI 0.0–34.9) points out of 100; 24.9 (UI 20.2.–29.5) points for smoking (age-standardised prevalence of daily smoking among those aged 10 years and older); and 35.7 (UI 19.6–31.2) points for child obesity (prevalence of overweight among children 2 to 4 years). Further, with a score of 48.9 (UI 39.7–59.0), sexual violence in adults 18–29 yrs who experienced sexual violence by age 18 did not pass. Finally, the rate per 1000 of reported new HIV infections, with 51.0 (UI 44.3–58.7) points, was borderline no-pass. Historically, the health indicators of Spain in the SDG index have had upward trends, increasing from 51.8 points (48.6–54.1) in 1990 to the current estimate of 74.3 points (67.9–81.3). In spite of this increases, it is projected that in 2030 alcohol use with 21 (UI 0.0–54.6) points, child overweight with 28 points (UI 0.0–55.7), smoking prevalence with 36 (UI 27.3–44.1) points), and child sex abuse with 49 (UI 38.8–59.6) points) will remain fails, well below 50 out of 100 points.
Discussion

During the past 26 years, substantial changes have taken place in the burden of diseases in Spain. Low back and neck pain are the major driver of disability in Spain in 2016, while tobacco remains the most relevant risk factor overall. The country has seen a remarkable increase in the burden due to Alzheimer disease and other dementias. Overall, mortality and disability in Spain have become even more linked to non-communicable diseases over the last years, following worldwide trends. Cardiovascular and circulatory diseases, cancers, mental and behavioural disorders, and neurological disorders are the leading causes of DALYs, as already observed in GBD 2010.17
Comparing the burden of disease in 2016 in Spain with neighbouring countries such as Portugal, France, and within Western Europe, the top 10 causes in DALYs per 100,000 are very similar, with the exception of neurological disorders that in Spain are listed as the 4th cause while in Western Europe, Portugal and France are the 6th cause. Actually, from 1990 and 2006 the top ten leading causes showed a similar trend in Spain, and the above mentioned countries. Globally the main risk factor is high blood pressure, followed by smoking, low birth weight, and short gestation,31 this last one ranking number 29th as risk factor in Spain.
This analysis of Spain within the 2016 GBD study provides a detailed overall assessment of the main causes of death and disability, and its leading risk factors. Considering DALYS as the overarching marker of health burden, the five leading diseases were low back and neck pain, IHD, Alzheimer, sense organ diseases, and lung cancer, whereas the five leading risk factors were smoking, alcohol & drug use, high blood pressure, high BMI, and dietary risks. As above mentioned, this pattern is again similar to Portugal and France, as well as to all Western Europe. This similarity has been maintained during the 26 years of the study period. One of the few significant differences is alcohol abuse, which ranks 1st in Portugal, but 4th in Spain.
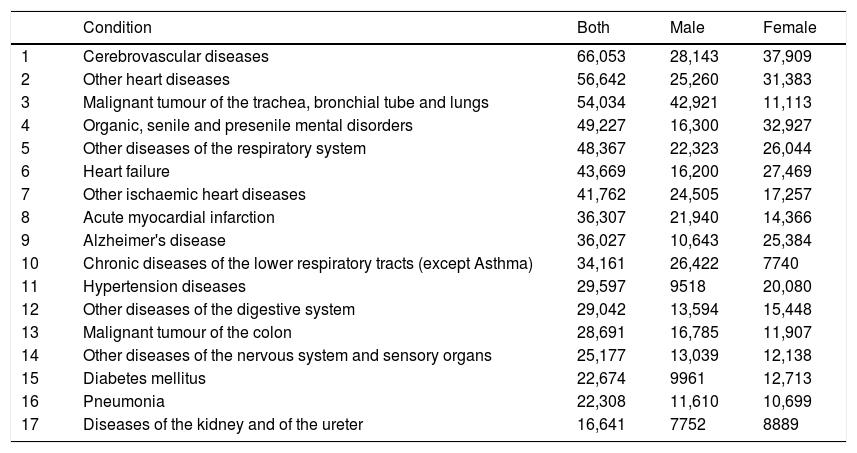
There are some discrepancies between causes of death for Spain GBD 2016 and data from the Instituto Nacional de Estadística (INE, for National Institute of Statistics),36 the official Spanish statistics organism, which is used to guide public policy, and follows the ICD-10 cause of death list. Top causes of death in 2016 (both sex combined) according to INE are shown in Online Table 1. Although definitions differ (e.g. IHD is represented by two different categories in INE, that is “Acute myocardial infarction” and “Other ischaemic heart diseases”, hypertension is considered a garbage code in GBD and is redistributed to other causes of death. Several items labelled “other”, representing several different conditions, made it into the top ten list in INE. Overall, all conditions except one in the top ten causes according to GBD 2016 can be recognised in the INE list, the sole exception being CKD. The discrepancies between INE and GBD may depend on the different definitions used. In INE, the closest term to CKD, at position seventeen, is a wider category of “diseases of the kidney and of the ureter”. The fact that one of the top ten causes of death, according to the GBD 2016 methodology, is hidden from the view of policy makers may be considered room for improvement in the INE information system (Table 2).
Most common causes of death in Spain in 2016 according to Basic cause of death. INE-Instituto Nacional de Estadística [as per http://www.ine.es/dynt3/inebase/en/index.htm?padre=4321∩sel=4322 [accessed January 20, 2018].
| Condition | Both | Male | Female | |
|---|---|---|---|---|
| 1 | Cerebrovascular diseases | 66,053 | 28,143 | 37,909 |
| 2 | Other heart diseases | 56,642 | 25,260 | 31,383 |
| 3 | Malignant tumour of the trachea, bronchial tube and lungs | 54,034 | 42,921 | 11,113 |
| 4 | Organic, senile and presenile mental disorders | 49,227 | 16,300 | 32,927 |
| 5 | Other diseases of the respiratory system | 48,367 | 22,323 | 26,044 |
| 6 | Heart failure | 43,669 | 16,200 | 27,469 |
| 7 | Other ischaemic heart diseases | 41,762 | 24,505 | 17,257 |
| 8 | Acute myocardial infarction | 36,307 | 21,940 | 14,366 |
| 9 | Alzheimer's disease | 36,027 | 10,643 | 25,384 |
| 10 | Chronic diseases of the lower respiratory tracts (except Asthma) | 34,161 | 26,422 | 7740 |
| 11 | Hypertension diseases | 29,597 | 9518 | 20,080 |
| 12 | Other diseases of the digestive system | 29,042 | 13,594 | 15,448 |
| 13 | Malignant tumour of the colon | 28,691 | 16,785 | 11,907 |
| 14 | Other diseases of the nervous system and sensory organs | 25,177 | 13,039 | 12,138 |
| 15 | Diabetes mellitus | 22,674 | 9961 | 12,713 |
| 16 | Pneumonia | 22,308 | 11,610 | 10,699 |
| 17 | Diseases of the kidney and of the ureter | 16,641 | 7752 | 8889 |
The top ten leading risk factors in Spain in 2016 are smoking, high systolic blood pressure, high BMI, alcohol use, high fasting plasma glucose, high total cholesterol, impaired kidney function, diet low in seed, nuts and whole grains, and finally ambient air pollution. Among these top ten risk factors according to impact on DALYs, seven, that is smoking, alcohol use, high blood pressure, high BMI, high fasting plasma glucose and high total cholesterol, are subject to lifestyle modifications.
All of them may be improved through public health and education campaigns in order to both decrease DALYs and achieve the SDG goals.37 The implementation of tobacco control policies (mainly taxation, health warnings as plain packaging, and support for smoking cessation), food policies (taxation and availability), or physical activity (promotion) are key interventions to positively intervene the future burden of disease in Spain. Additionally, high blood pressure, high fasting plasma glucose and high total cholesterol, may be responsive to changes in weight and physical activity, and also to pharmacological intervention. There is also margin for improvement on this from the primary care point of view. In a recent study, undiagnosed hypertension was identified in 37% of patients and well-controlled blood pressure was found in only 24% of patients in Spain.38 Impaired kidney function merits a specific comment. Despite its high prevalence, estimated as much as 10% of the adult population in Spain, as the GBD 2016 definition included both decreased glomerular filtration rate or the presence of pathological albuminuria,39 impaired kidney function is not directly related to lifestyle changes. Further, there is little awareness of its risk factor consideration, both among the general population and among physicians, despite statements by scientific societies.40 Together with its growing contribution to mortality, kidney disorders require a major focused effort on the part of health authorities.
Ambient air pollution is the only environmental risk factor within the top ten risk factors in Spain, which is also a leading risk factor globally. Policies and regulations to reduce main emission sources of ambient air pollution are also urgently needed. Specific interventions to reduce motorised transport use, with interventions such as reducing public parking space for cars, increasing the availability and efficiency of public transport, and promoting walking and cycling, are good examples for effective interventions in urban areas.
There were major sex differences on the impact of risk factors on DALYs, both in their ranking and percent contribution. In women, no single risk factor contributed more than 10% of DALYs, and only four contributed more than 5%. By contrast, in men six contributed more than 5% and two more than 15%, and the latter being behaviour-related (tobacco and alcohol/drug use). Moreover, with the exception of high BMI and impaired kidney function, the contribution to DALYS of the other ten leading risk factors in Spain was substantially larger in males than in females. The latter was particularly evident for tobacco (16% in male vs 4.5% in female) and alcohol and drug use (13% in male vs 5% in female). This finding suggests the need for targeting gender issues in any public health policies of the burden of health and its risk factors. Public policy campaigns should specifically target men, with the potential exception of tobacco use, since projected prevalence for 2025 indicate a decrease except for women aged 40–64 years.41 Correction of these differences in risk behaviour may help further closing the gap in mortality between Spanish men and women. A better understanding of gender differences in the burden of diseases should also involve the identification and assessment of potential gender biases, both in the identification of risk factors and the assessment of their effects.
Occupational risk factors deserve particular attention, as causes of loss of productivity, frequent sickness absence and high economic cost, since they rank among the top-ten leading factors in both men and women, and there is a recognised deficit in occupational health policies in Spain.42,43 Ongoing challenges are coordination within Autonomous Communities and centralised regulators, and wider collaboration of different institutes and administrations.
In terms of SDGs, the health-related index provided by GBD is a very useful tool to track advances and accomplishment of SDGs in Spain. Out of a total of 188 countries evaluated according to the SDGs, Spain fell from position 7th in 2015 to 23rd in 2016.32,33 Spain achieved 74 points, eight less than in 2016, and the worst score, ten out of 100, was related with consumption of alcohol (the previous year it obtained a mere pass with 57 points, although the way of measuring this factor had been slightly modified.33 The second and third worst scores referred to tobacco use (25 out of 100) and childhood obesity (36 out of 100). On incidence of HIV and child abuse, Spain barely reached a pass. The goals included in the index are based on the SDG agreements signed by individual countries (Spain included) to be achieved by 2030. The SDG index estimations forecast that, assuming current trends, Spain is not expected to achieve these goals by 2030, when is estimated to reach only 84 points out of 100. The top worse performing goals for Spain are alcohol use, smoking, childhood overweight, child health abuse, and HIV incidence. Stronger and effective interventions, and inter-sectorial policies to improve those health indicators are needed.
Strengths and limitationsAmong the many inherent strengths of this study are novelty, being the first, unique, comparable, consistent assessment of health, morbidity and mortality, and risk factors in Spain, and also comparable within our European neighbours and globally. The systematic, independent and regularly updated evaluation of the original information sources is one of the strengths of the GBD initiative. In addition, each of the new GBD iterations incorporates new sources and updates existing ones, and therefore substitutes previously published estimates. The list of original data sources for Spain on risk factors, demographics, morbidity-mortality, use of health services and other estimators is available on the server http://www.ghdx.healthdata.org. For example, as of April 11, 2017 GBD uses 1587 different sources of information on Spain, including sources from the Spanish National Institute of Statistics (INE), different Ministries, WHO-Europe, Autonomous Communities, and other (http://www.ghdx.healthdata.org/geography/spain).”
However, a number of limitations must be considered, perhaps in future iteration of GBD Spain. First, although Spain follows the European Statistics Code of Practice and data is collected in a consistent way across the country, there are a number of issues that should be considered when interpreting mortality results. The GBD project defined a number of garbage codes, which are causes of death that should not be identified as underlying causes of death on death certificates. Garbage codes were substituted by IHME with other underlying causes based on pathophysiology. The fraction of garbage codes in Spain was within the expected average, rated with four out of five stars.3 Second, calculation of disability weights was based on surveys including several countries, and not just Spain. Third, demographic trends, especially of migrants on fertility and other epidemiological estimators, and global climate uncertainties,44 may significantly change current assumptions of SDGs in Spain up to 2030 and beyond. Given the decentralised health system in Spain, with most Medicine and Public Health budgets managed separately by the 17 different Autonomous Communities, there likely is great heterogeneity regionally and by smaller areas in many of the estimates presented only nationally in here. Accordingly, further efforts should be explored to perform a sub-national GBD study in Spain.
Modelling of data and extrapolation to the most recent years, overcoming the usual one- or two-year gap of data unavailability due to internal processing, could be considered one of the GBD strengths. As referred in all previous iterations of the GBD study,2 Bayesian statistical models were used to estimate prevalence of conditions in each country by age, sex, and year. The nature of this estimation process implies that, in some cases, depending on the covariates, the estimated variance might be smaller than the real variance across countries in a region, and in some other cases, uncertainty intervals for a specific estimate might be exaggerated. Furthermore, the calculation of uncertainty intervals throughout the Bayesian model analysis has provided some information on the extent of available information for Spain. However, the nature of the estimation process for causes of death and the prevalence of sequelae more generally may lead to exaggerated uncertainty intervals in a high-income country such as Spain.
Impact of the economic crisisSpain experienced a great economic crisis, which began in 2008 during the world financial crisis of 2007–2008. The main cause of Spain's crisis was the housing bubble and the accompanying unsustainably high GDP growth rate. Regidor et al.45 described that all-cause mortality in Spain decreased more during the economic crisis than before, especially in low socioeconomic groups, probably due to the decreased exposure to risk factors. It has been argued that this study oversimplified the economic crisis, which was a long-term occurrence, particularly given that austerity in Spain mostly started after a constitutional reform in 2011 to prioritise budget deficit control over social expenditures.46 Additionally, children younger than 10 years and adults older than 74 years were excluded from that analysis, despite being highly susceptible social groups.47 Similar to Regidor et al.,46 others reported that in European countries in general and especially in those most affected by the crisis (i.e.: Greece,48 and Iceland49), general mortality also decreased and the health of the population improved in 2007–2010.50 As compared to before the crisis, for adults 60 years and older the observed mortality seemed to be decreasing at a slower rate than what would have been expected in the absence of the crisis, with an increase in winter mortality, and a greater impact for female than for male mortality.48 These results suggest sizable effects of the economic crisis on the mortality of older adults and argue for research done using more detailed analyses integrating economic indicators. On the negative side, the economic crisis in the above three countries negatively impacted mental health and some other population health indicators.51,52 Overall, within a universal, health-for-all society, any economic recession will produce changes on use of and access to health services: it is more likely detrimental to low-income groups regarding specialist appointments and hospitalisations, whereas it works to their advantage in the case of emergency services and family doctor appointments. Future studies might investigate further the role of the Spanish Welfare State, consolidated in recent decades, because through various mechanisms of social protection, such as pensions, unemployment insurance, work disability, and else, it could have acted as a buffer against the negative effects of the economic crisis.44
Success stories: road accidents, self-harm and tobaccoIn the GBD 2016 study, road injuries as cause of death fell from the 8th position in 1990 to 32nd in 2016. This success could be attributable to a number of factors, including the obligatory enforcement of fastened seat belts; fastening while driving was compulsory in roads from1974, and in urban areas from 1992,53 plus the compulsory helmet for motorbike riders of >125 cc, and of <125 in roads but not cities from 1982; tax incentives for the renovation of the oldest automobiles; major road work improvements; and last but not least, less traffic because of the impact of the economic crisis from 2008.46
Deaths attributable to self-harm went down from position 19th to 26th. Contrary, Alvarez-Galvez et al.54 reported that suicide deaths decreased during the first period of the economic recession (2007–2011), but there was a positive and significant relationship between the crisis and suicide rates during the second period (2011–2014). This difference could be explained by a delayed effect of personal economic problems due to initial protection policies.
Following the WHO Framework Convention for Tobacco Control, tobacco control policies fuelled smoke-free legislation (Law 28/2005 and Law 42/2010) to further protect non-smokers and implemented MPOWER recommendations.55,56 Close attention to monitoring all tobacco trends, implementing and strengthening tobacco control, and limiting vaping of e-cigarettes, particularly in the youngest, are fundamental for widening long-term Public Health goals in most/all diseases. Moreover, among other risk factors, reductions in most urban air pollution exposures will have massive beneficial long-term health effects.
A sub-national GBD study in SpainThe GBD 2016 Study provides a global assessment of the health-related burden and its determinants in an international comparative risk assessment framework. This information is important and useful to inform health policy managers, and the society in general. The present GBD 2016 Spain report shows important unmet needs, and opportunities to improve the public health and health care systems. The GBD international comparative framework offers an uncanny opportunity to explore appropriate benchmarking, and to identify the best policies and practices that proved successful in other countries, to be adapted and implemented in Spain. So far, no other source of health information in Spain offers this type of international comparative risk assessment. Unfortunately, the information is only provided at the national level, a limitation that other countries have approached and overcome by extending the GBD at the sub-national level (state, counties, districts and cities).5–11 In these sub-national GBD studies, the improved granularity of the information allows to assess social inequalities, and to extend the opportunities for learning from others at the regional level, health planning, and provision of public health and health care services, which in Spain belong to the Autonomous Communities. Therefore, such further exploitation of GBD tools would further reinforce the GBD contribution to health policy in Spain.
ConclusionsTo conclude, given stagnation of population growth and generalised ageing, in a country with high quality Public Medicine and Preventive services and systems, the burden of disease in Spain is rapidly evolving within the well-known epidemiological transition to chronic, non-communicable diseases.57 Low back and neck pain became the major driver of disability in Spain in 2016, while tobacco remains the most relevant risk factor overall to be tackled, and we observe a remarkable increase in the burden due to Alzheimer disease and other dementias. Close monitoring of these trends is fundamental to set up and prioritise effective health interventions in Spain.
FundingJBS was awarded a Visiting Scholar appointment in the summer of 2017 by the Center for Health Trends and Forecasts, based at the Institute for Health Metrics and Evaluation (IHME) at the University of Washington, Seattle, WA, USA.
ST was supported by the Foundation for Education and European Culture (IPEP), the Sara Borrell postdoctoral programme (reference no. CD15/00019 from the Instituto de Salud Carlos III (ISCIII – Spain) and the Fondos Europeo de Desarrollo Regional (FEDER). ST was awarded with a 6 months visiting fellowship funding at IHME from M-AES (reference no. MV16/00035 from the Instituto de Salud Carlos III).
AO and MDSN were supported by RETIC REDINREN RD016/0009 and MDSN by the Miguel Servet postdoctoral programme (reference no. MS14/00133), both from ISCIII – Spain and FEDER.
EF was supported by the Consejería de Universidades e Investigación, Govern de Catalunya (2017SGR319) and by the Instituto de Salud Carlos III (INT46/DO211, INT17/00103) of the Government of Spain, co-funded by Fondos Europeos de Desarrollo Regional (FEDER).
Conflict of interestsThe authors declare no conflict of interest.
The GBD study is funded by the Bill & Melinda Gates Foundation. We thank Ms Faye Ziegeweid, Project Manager at the Center for Health Trends and Forecasts for swiftly facilitating practicalities of this research with the Institute of Health Metrics and Evaluation in Seattle, WA, USA. We thank Mr Tomás Sánchez, webmaster at SEPAR, for mastering file transfers and helping with all technical issues. We also thank all GBD collaborators in Spain listed in the Appendix.
List of GBD collaborators in Spain, that includes:
C. Adsuar, Jordi Alonso, Josep M. Antó, Elisabeth Cardis, Pere-Joan Cardona, Cesar Díaz-Torne, Esteve Fernández, Urbano Fra Paleo, Alberto L. García-Basteiro, Fernando García Benavides, Mari Carmen Gómez-Cabrera, Josep María Haro, Dimitris Karletsos, Jeffrey V. Lazarus, José Martínez-Raga, María F. Masana, Mark J. Nieuwenhuijsen, Joan M. Nolla, Alberto Ortiz, Andrea Parisi, Fernando Pérez-Ruiz, Maria Luisa Rodero-Cosano, David Rojas-Rueda, José A. Salinas-Pérez, María Dolores Sánchez-Nino, Lidia Sánchez-Riera, Antoni Serrano-Blanco, Joan B. Soriano, Rafael Tabares-Seisdedos, Miguel Tortajada-Girbés, Ulises Trujillo, Stefanos Tyrovolas.
List of GBD collaborators in Spain, that includes Appendix A.
Please cite this article as: Soriano JB, Rojas-Rueda D, Alonso J, Antó JM, Cardona P-J, Fernández E, et al. La carga de enfermedad en España: resultados del Estudio de la Carga Global de las Enfermedades 2016. Med Clin (Barc). 2018;151:171–190.
articles

Medicina Clínica (English Edition) follows the Recommendations for the Conduct, Reporting, Editing and Publication of Scholarly Work in Medical Journals