


The aim of this study was to analyse the differences in diabetic ketoacidosis (DKA) between type 2 diabetes (T2D) and type 1 diabetes (T1D) in a Spanish cohort.
Materials and methodsThis retrospective cohort study included all cases of DKA between 2010 and 2024 in a Spanish tertiary hospital. Clinical and laboratory variables were collected to identify differences between DKA in T2D and T1D. Logistic regression models were used to evaluate 30-day mortality following a DKA event.
ResultsA total of 249 subjects (52.2% female) with a mean age of 50.2±19.9 years were included. Eighty-nine patients (35.7%) had T2D, and 160 (64.3%) had T1D. A higher proportion of cardiovascular precipitating events was observed in the T2D group (12.5% vs. 3.2%, p=0.005), along with a more favorable blood gas profile, characterised by higher pH, bicarbonate levels, and lower ketone body concentrations (p<0.05). However, 30-day mortality was 13.5% in T2D and 1.3% in T1D (p<0.001). Logistic regression models identified cardiovascular events, lower Glasgow Coma Scale scores, and higher urea levels as predictors of mortality (p<0.05), independent of age and diabetes type.
ConclusionDKA in T2D is associated with a higher risk of mortality due to the severity of precipitating factors, despite a more favorable blood gas profile compared to T1D. Early identification of episodes is essential to prevent complications.
El objetivo del presente estudio fue analizar las diferencias entre la cetoacidosis diabética (CAD) entre la diabetes tipo 2 (DM2) en comparación con la diabetes tipo 1 (DM1) en una cohorte española.
Material y métodosEste estudio de cohortes retrospectivo incluyó todas las CAD entre 2010 y 2024 en un hospital terciario español. Se recopilaron variables clínicas y analíticas para establecer diferencias entre la CAD en DM2 y DM1. Se realizaron modelos de regresión logística para evaluar la mortalidad por CAD a los 30 días del evento.
ResultadosSe incluyeron 249 sujetos, (52,2% mujeres) con una edad media 50,2 ± 19,9 años. Ochenta y nueve pacientes (35,7%) eran DM2 y 160 (64,3%) DM1. Se observó una mayor proporción de eventos cardiovasculares desencadenantes en el grupo DM2 (12,5% frente a 3,2% p=0,005) y un perfil gasométrico más favorable con mayor pH, bicarbonato y menores títulos de cuerpos cetónicos (p<0,05). Sin embargo, la mortalidad a 30 días fue del 13,5% en DM2 y 1,3% en DM1 (p<0,001). Los modelos de regresión logística mostraron que los eventos cardiovasculares, una menor puntación en la escala de Glasgow y mayores cifras de urea se asociaron a la mortalidad (p<0,05) independientemente de la edad y del tipo de diabetes.
ConclusiónLa CAD en la DM2 se asocia a mayor riesgo de mortalidad debido a la gravedad de sus desencadenantes a pesar de tener un perfil gasométrico más favorable que en la DM1. Es necesario identificar los episodios de forma precoz para evitar complicaciones.
Diabetes mellitus (DM) is a metabolic disease characterised by the presence of chronic hyperglycaemia and alterations in carbohydrate metabolism.1 The prevalence of DM and its specific complications make the disease one of today's major health and social problems.1 Diabetic ketoacidosis (DKA) is an acute, severe and life-threatening metabolic complication of DM2 that has recently shown a rising incidence probably related to the COVID-19 pandemic.3,4 The diagnostic criteria for DKA consist of the triad of hyperglycaemia, metabolic acidosis, and ketosis.2 The underlying pathophysiology is absolute or relative insulin deficiency, increased counter-regulatory hormones and peripheral insulin resistance.5 While most cases of DKA are seen in people with type 1 diabetes (DM1), it can also occur as an acute complication in type 2 diabetes (DM2).5 It is often triggered by factors such as the omission of insulin, infections, acute cardiovascular disease, drug use, alcohol consumption or exposure to other toxic substances.2
The average annual rate of DKA is 6.3 per 1000 people with diabetes,6 with a mortality rate from hospital admissions for DKA of 3–5 %.7 Severity is classified according to the American Diabetes Association (ADA) scale as mild, moderate and severe.2 However, it should be noted that it is currently unknown whether the severity of DKA according to clinical and biochemical parameters differs in patients with DM1 and DM28. Based on the results of the literature so far, it appears that in patients with DM2 this complication is associated with worse clinical outcomes and higher morbidity and mortality.9 This difference may be attributed to various factors, including older age, precipitating events, comorbidities and the use of drugs such as sodium-glucose cotransporter-2 inhibitors (SGLT2i),10,11 among others. However, the available scientific evidence is limited.
The aim of this study is to examine the differences in the clinical profile and laboratory parameters of DKA, as well as to identify potential prognostic factors that influence the severity of its complications and mortality in adult patients with type 2 diabetes compared with those with type 1 diabetes.
Material and methodsA retrospective cohort study was performed. This follow-up study included all persons diagnosed with DKA between 1 January 2010 and 1 April 2024 in the emergency department of a tertiary hospital in Madrid (Spain).
All persons over 15 years of age who attended the emergency department and met the criteria for DKA (defined as the presence of the following three components) were included: glucose >200mg/dl (11.1mmol/l) at presentation, or a previous diagnosis of diabetes; plasma β-hydroxybutyrate concentrations of 3.0mmol/l or greater; urine ketones of 2+ or greater on a standard urine ketone test; a pH of less than 7.3 or a serum bicarbonate level of less than 15.0mmol/l.10,11 Subjects with a medical diagnosis of DKA who did not meet the above criteria were excluded. We also excluded subjects with no personal history information, no physical examination, no vital signs or treatment administered in the ED, no complete blood work-up in the ED, and patients who were directly transferred from the ED to another centre. Missing values were excluded from the analyses, and no imputation of data was performed due to the absence of critical information that prevented adequate statistical treatment. The definition of diabetes types was based on the WHO and American Diabetes Association (ADA) 2019 classification criteria for diabetes mellitus.12 We defined the types of diabetes based on the patients’ biochemical and clinical characteristics. Type 1 diabetes (T1D) was diagnosed in the presence of positive pancreatic autoantibodies or fasting C-peptide levels below 0.08nmol/l.13 If patients had negative pancreatic autoantibodies or if pancreatic autoantibody and fasting C-peptide results were unavailable, the diagnosis was made using clinical criteria. This applied when patients had a normal to low body mass index (BMI below 23kg/m²) and were unable to discontinue insulin therapy within 12 months following the initial diagnosis of DKA. Type 2 diabetes was diagnosed by clinical criteria if patients were overweight or obese (BMI greater than 23kg/m2), had a first-degree family history of DM2, signs of insulin resistance (acanthosis nigricans) or C-peptide in the normal range. If patients did not meet the clinical criteria for type 2 diabetes, they were diagnosed if they had a negative pancreatic autoantibody test result and did not meet the criteria for type 1 diabetes or other specific types of diabetes.
This study adhered to the "Strengthening the Reporting of Observational Studies in Epidemiology" (STROBE) guidelines. It was approved by the Research Ethics Committee at Hospital de La Princesa in Madrid (study number 5554-06/24). The research was conducted in accordance with the Declaration of Helsinki.
Data collectionFirstly, a descriptive analysis of variables in relation to the type of DM was performed:
- 1
Variables related to personal medical history collected from the medical records: age, sex, duration of diabetes, most recent glycated haemoglobin (HbA1c), history of ischaemic heart disease, stroke, diabetic retinopathy, chronic kidney disease, amputations, hypertension, dyslipidaemia, HIV/AIDS, active malignant cancer, psychiatric history, type of diabetes, eligibility for intensive care unit (ICU) admission, and treatment with SGLT2 inhibitors.
- 2
Variables related to history-taking, physical examination and diagnostic impression: mean arterial pressure, respiratory rate, temperature at presentation in the emergency department, oxygen saturation, body mass index, Glasgow Coma Scale score, dyspnoea, vomiting, confusion, weight loss, number of days since symptom onset, capillary ketone levels, gastroenteritis, missed treatment doses, diabetes onset, infection other than gastroenteritis, cardiovascular event, and type of initial resuscitation fluid administered (balanced solution or sodium chloride).
- 3
Variables related to results of basic laboratory tests available in the ED: haemoglobin, haematocrit, white blood count, platelets, creatinine, urea, sodium, potassium, total bilirubin, CRP, procalcitonin, pH, pCO2, bicarbonate and l-lactate.
After verifying the plausibility of outlier values, data conforming to a normal distribution were assessed using statistical procedures (Kolmogorov–Smirnov test) and graphical methods (normal probability plot). Continuous variables were presented as mean and standard deviation (SD), while categorical variables were expressed as counts and sample percentages.
Bivariate differences were tested using Student's t-test and the Mann-Whitney U-test, depending on their fit to a normal distribution. Spearman's Rho correlation coefficients were estimated to examine associations between variables.
A trend analysis was performed to analyse the number of admissions per year during the entire follow-up. Additionally, a negative binomial regression model was performed to assess whether the trend of admissions for DKA over time is related to diabetes type and SGLT2i treatment.
After studying the differences observed in the various variables between individuals with DM1 and DM2, mortality at 30 and 90 days was evaluated in both groups of patients. Overall mortality at 30 days was examined using a correlation matrix for all history, examination, and laboratory variables collected. Finally, a logistic regression model was performed with the variables that were associated with a Spearman's Rho > 0.25 with overall 30-day mortality to establish which variables were independently associated with 30-day mortality.
Statistical analysis was performed using R statistical software, version 4.0.3 and STATA 17.0 Basic Edition (Lakeway Drive, TX, USA). Statistical significance was set at p< 0.05.
ResultsDuring the data collection period, a total of 273 DKA events were recorded. After application of the inclusion and exclusion criteria, the final sample was composed of 249 subjects. The mean age of the sample was 50.2± 19.9 years and 115 (50.2%) were male. One hundred and sixty (64.3%) of the events corresponded to people with DM1, 89 (35.7%) DM2. One hundred and ten (44.2%) of the events required admission to the ICU and 14 (5.6%) subjects died within 30 days of admission (Fig. 1).
 between 2010 and 2014, 6 patients were excluded for not meeting the diagnostic criteria for DKA, and 18 were excluded due to missing clinical and/or laboratory data. The final sample comprised 249 patients who fulfilled the inclusion criteria: glucose > 200mg/dl or a prior diagnosis of diabetes, β-hydroxybutyrate ≥ 3.0mmol/l or ketonuria ≥ 2+, and pH<7.3 or serum bicarbonate < 15mmol/l. Exclusion criteria included absence of clinical history, physical examination, vital signs, or laboratory data, as well as patients transferred to other centres.")
Patient Inclusion Flow Diagram.
Out of a total of 273 patients initially considered with a diagnosis of diabetic ketoacidosis (DKA) between 2010 and 2014, 6 patients were excluded for not meeting the diagnostic criteria for DKA, and 18 were excluded due to missing clinical and/or laboratory data. The final sample comprised 249 patients who fulfilled the inclusion criteria: glucose > 200mg/dl or a prior diagnosis of diabetes, β-hydroxybutyrate ≥ 3.0mmol/l or ketonuria ≥ 2+, and pH<7.3 or serum bicarbonate < 15mmol/l. Exclusion criteria included absence of clinical history, physical examination, vital signs, or laboratory data, as well as patients transferred to other centres.
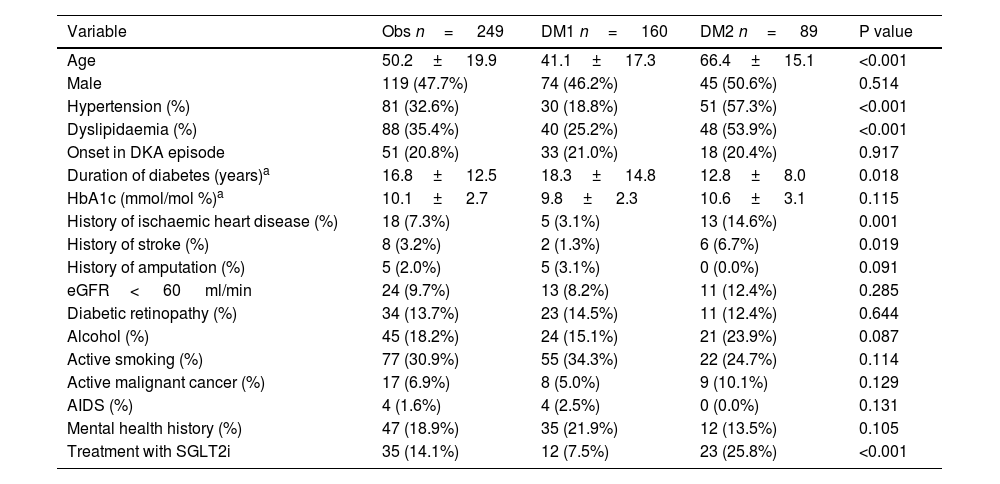
Among the baseline characteristics of the sample, obtained from personal history, it was observed that patients with DM2 were significantly older (66.4± 15.1 years) compared to patients with DM1 (41.1± 17.3 years; p< 0.001). Hypertension was more common in patients with DM2 (57.3%) compared to those with DM1 (18.8%, p< 0.001). Similarly, dyslipidaemia showed a higher prevalence in patients with DM2 (53.9 vs. 25.2%, p< 0.001).
Patients with DM1 had a longer disease duration (18.3± 14.8 years vs. 12.8± 8.0 years in DM2; p= 0.018). Regarding history of vascular events, both ischaemic heart disease (14.6 vs. 3.1%; p< 0.001) and stroke (6.7 vs. 1.3%; p= 0.019) were more common in patients with DM2 than in those with DM1.
Chronic alcohol consumption showed a non-significant trend to be more common in patients with DM2 (23.9%) compared to DM1 (15.1%; p= 0.087). Treatment with sodium-glucose cotransporter-2 inhibitors (SGLT2i) was significantly more common in DM2 (25.8 vs. 7.5%; p< 0.001).
No significant differences were observed in HbA1c levels, onset in the DKA episode, prevalence of chronic microvascular complications of diabetes (retinopathy or chronic kidney disease (CKD) with eGFR< 60 ml/min), active smoking, or the existence of AIDS, active cancer or mental health history. The detailed results of the variables obtained from the personal history are shown in Table 1.
Baseline characteristics of the sample regarding variables obtained from the personal history.
| Variable | Obs n= 249 | DM1 n= 160 | DM2 n= 89 | P value |
|---|---|---|---|---|
| Age | 50.2± 19.9 | 41.1± 17.3 | 66.4± 15.1 | <0.001 |
| Male | 119 (47.7%) | 74 (46.2%) | 45 (50.6%) | 0.514 |
| Hypertension (%) | 81 (32.6%) | 30 (18.8%) | 51 (57.3%) | <0.001 |
| Dyslipidaemia (%) | 88 (35.4%) | 40 (25.2%) | 48 (53.9%) | <0.001 |
| Onset in DKA episode | 51 (20.8%) | 33 (21.0%) | 18 (20.4%) | 0.917 |
| Duration of diabetes (years)a | 16.8± 12.5 | 18.3± 14.8 | 12.8± 8.0 | 0.018 |
| HbA1c (mmol/mol %)a | 10.1± 2.7 | 9.8± 2.3 | 10.6± 3.1 | 0.115 |
| History of ischaemic heart disease (%) | 18 (7.3%) | 5 (3.1%) | 13 (14.6%) | 0.001 |
| History of stroke (%) | 8 (3.2%) | 2 (1.3%) | 6 (6.7%) | 0.019 |
| History of amputation (%) | 5 (2.0%) | 5 (3.1%) | 0 (0.0%) | 0.091 |
| eGFR< 60 ml/min | 24 (9.7%) | 13 (8.2%) | 11 (12.4%) | 0.285 |
| Diabetic retinopathy (%) | 34 (13.7%) | 23 (14.5%) | 11 (12.4%) | 0.644 |
| Alcohol (%) | 45 (18.2%) | 24 (15.1%) | 21 (23.9%) | 0.087 |
| Active smoking (%) | 77 (30.9%) | 55 (34.3%) | 22 (24.7%) | 0.114 |
| Active malignant cancer (%) | 17 (6.9%) | 8 (5.0%) | 9 (10.1%) | 0.129 |
| AIDS (%) | 4 (1.6%) | 4 (2.5%) | 0 (0.0%) | 0.131 |
| Mental health history (%) | 47 (18.9%) | 35 (21.9%) | 12 (13.5%) | 0.105 |
| Treatment with SGLT2i | 35 (14.1%) | 12 (7.5%) | 23 (25.8%) | <0.001 |
AIDS: acquired immunodeficiency syndrome; DKA: diabetic ketoacidosis; eGFR: estimated glomerular filtration rate; HbA1c: glycosylated haemoglobin.
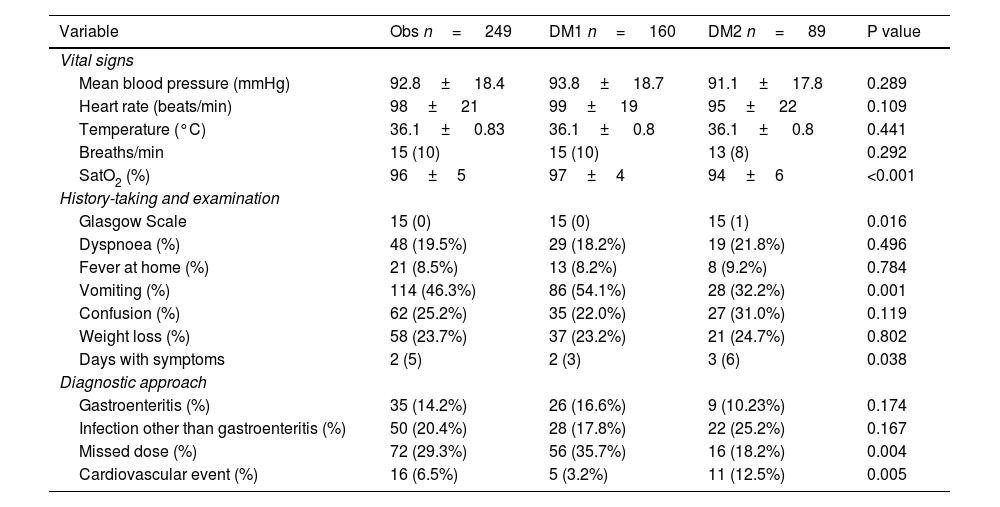
Based on data obtained from medical history and physical examination, patients with DM2 presenting with DKA had lower baseline oxygen saturation levels (94% ± 6% vs. 97% ± 4%; p<0.001) and a longer duration of symptoms prior to admission (3 days vs. 2 days; p=0.038). In contrast, DKA presenting with vomiting was more common in patients with DM1 (54.1%) than in those with DM2 (32.2%; p<0.001). Similarly, lower Glasgow Coma Scale scores were recorded in patients with DM2 compared to those with DM1 (p=0.016).
The distribution of precipitating factors also differed between the two types of diabetes. Insulin dose omission was more common in patients with DM1 (35.7%) than in those with DM2 (18.2%; p=0.004), whereas cardiovascular events were more prevalent in DM2 (12.5% versus 3.2%; p=0.005). No differences were found in the other described triggers (gastroenteritis, infections, etc.). The remaining results for variables obtained from history-taking and physical examination are presented in Table 2.
Variables obtained from history-taking and physical examination.
| Variable | Obs n= 249 | DM1 n= 160 | DM2 n= 89 | P value |
|---|---|---|---|---|
| Vital signs | ||||
| Mean blood pressure (mmHg) | 92.8± 18.4 | 93.8± 18.7 | 91.1± 17.8 | 0.289 |
| Heart rate (beats/min) | 98± 21 | 99± 19 | 95± 22 | 0.109 |
| Temperature (°C) | 36.1± 0.83 | 36.1± 0.8 | 36.1± 0.8 | 0.441 |
| Breaths/min | 15 (10) | 15 (10) | 13 (8) | 0.292 |
| SatO2 (%) | 96±5 | 97±4 | 94±6 | <0.001 |
| History-taking and examination | ||||
| Glasgow Scale | 15 (0) | 15 (0) | 15 (1) | 0.016 |
| Dyspnoea (%) | 48 (19.5%) | 29 (18.2%) | 19 (21.8%) | 0.496 |
| Fever at home (%) | 21 (8.5%) | 13 (8.2%) | 8 (9.2%) | 0.784 |
| Vomiting (%) | 114 (46.3%) | 86 (54.1%) | 28 (32.2%) | 0.001 |
| Confusion (%) | 62 (25.2%) | 35 (22.0%) | 27 (31.0%) | 0.119 |
| Weight loss (%) | 58 (23.7%) | 37 (23.2%) | 21 (24.7%) | 0.802 |
| Days with symptoms | 2 (5) | 2 (3) | 3 (6) | 0.038 |
| Diagnostic approach | ||||
| Gastroenteritis (%) | 35 (14.2%) | 26 (16.6%) | 9 (10.23%) | 0.174 |
| Infection other than gastroenteritis (%) | 50 (20.4%) | 28 (17.8%) | 22 (25.2%) | 0.167 |
| Missed dose (%) | 72 (29.3%) | 56 (35.7%) | 16 (18.2%) | 0.004 |
| Cardiovascular event (%) | 16 (6.5%) | 5 (3.2%) | 11 (12.5%) | 0.005 |
DM1: type 1 diabetes mellitus; DM2: type 2 diabetes mellitus; SatO2: oxygen saturation.
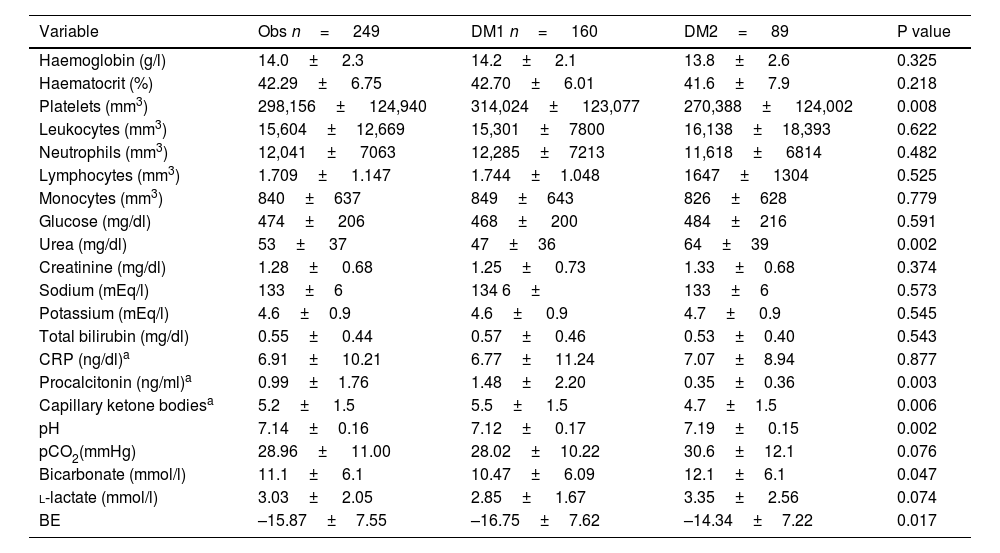
The laboratory results showed that the severity of metabolic acidosis was greater in patients with DM1, who had a lower pH compared to patients with DM2 (7.12± 0.17 vs. 7.19± 0.15; p= 0.002), as well as lower bicarbonate (10.47± 6.09 vs. 12.1± 6.1 mmol/l; p= 0.047) and higher capillary ketone bodies (5.5± 1.5 vs. 4.7± 1.5; p= 0.006).
Platelets and procalcitonin were lower in patients with DM2 compared to patients with DM1 (270,388± 124,002 versus 314,024± 123,077 mm3; p= 0.008; and 0.35± 0.36 versus 1.48± 2.20ng/ml; p= 0.003). Urea levels were higher in DM2 (64± 39mg/dl) than in DM1 (47±36 mg/dl; p= 0.002).
No significant differences were found in the levels of haemoglobin, haematocrit, leucocytes, neutrophils, lymphocytes, monocytes, glucose, creatinine, sodium, potassium, total bilirubin, CRP, pCO2, l-lactate and base excess, The detailed results of the laboratory variables are presented in Table 3.
Laboratory variables of the sample.
| Variable | Obs n= 249 | DM1 n= 160 | DM2= 89 | P value |
|---|---|---|---|---|
| Haemoglobin (g/l) | 14.0± 2.3 | 14.2± 2.1 | 13.8± 2.6 | 0.325 |
| Haematocrit (%) | 42.29± 6.75 | 42.70± 6.01 | 41.6± 7.9 | 0.218 |
| Platelets (mm3) | 298,156± 124,940 | 314,024± 123,077 | 270,388± 124,002 | 0.008 |
| Leukocytes (mm3) | 15,604±12,669 | 15,301±7800 | 16,138±18,393 | 0.622 |
| Neutrophils (mm3) | 12,041± 7063 | 12,285±7213 | 11,618± 6814 | 0.482 |
| Lymphocytes (mm3) | 1.709± 1.147 | 1.744±1.048 | 1647± 1304 | 0.525 |
| Monocytes (mm3) | 840±637 | 849±643 | 826±628 | 0.779 |
| Glucose (mg/dl) | 474± 206 | 468± 200 | 484±216 | 0.591 |
| Urea (mg/dl) | 53± 37 | 47±36 | 64±39 | 0.002 |
| Creatinine (mg/dl) | 1.28± 0.68 | 1.25± 0.73 | 1.33±0.68 | 0.374 |
| Sodium (mEq/l) | 133±6 | 134 6± | 133±6 | 0.573 |
| Potassium (mEq/l) | 4.6±0.9 | 4.6± 0.9 | 4.7± 0.9 | 0.545 |
| Total bilirubin (mg/dl) | 0.55± 0.44 | 0.57± 0.46 | 0.53±0.40 | 0.543 |
| CRP (ng/dl)a | 6.91± 10.21 | 6.77± 11.24 | 7.07±8.94 | 0.877 |
| Procalcitonin (ng/ml)a | 0.99±1.76 | 1.48± 2.20 | 0.35±0.36 | 0.003 |
| Capillary ketone bodiesa | 5.2± 1.5 | 5.5± 1.5 | 4.7±1.5 | 0.006 |
| pH | 7.14±0.16 | 7.12± 0.17 | 7.19± 0.15 | 0.002 |
| pCO2(mmHg) | 28.96± 11.00 | 28.02±10.22 | 30.6±12.1 | 0.076 |
| Bicarbonate (mmol/l) | 11.1± 6.1 | 10.47± 6.09 | 12.1±6.1 | 0.047 |
| l-lactate (mmol/l) | 3.03± 2.05 | 2.85± 1.67 | 3.35± 2.56 | 0.074 |
| BE | –15.87±7.55 | –16.75±7.62 | –14.34±7.22 | 0.017 |
BE: base excess; pCO2: partial pressure of carbon dioxide; CRP: C-reactive protein.
An analysis was carried out of the temporal evolution of DKA incidence for each completed year of follow-up between 2010 and 2023. The year 2024 was excluded, as it was ongoing at the time of the study. A non-stationary upward trend in DKA episodes was observed, becoming particularly marked from 2020 onwards, as shown in Fig. 2. The negative binomial regression model for hospital admission counts showed a statistically significant gradual increase in DKA episodes with each passing year (odds ratio [OR]: 1.12; 95% CI: 1.08–1.17; p<0.001). When the model was adjusted for diabetes type, SGLT2 inhibitor treatment, and the interaction between SGLT2 inhibitor use, time, and diabetes type, no statistically significant association was found between SGLT2 inhibitor treatment and the increased incidence of DKA episodes (p=0.840). Fig. 2 provides a graphical representation of the trend in DKA episodes from 2010 to 2023 according to SGLT2 inhibitor use and diabetes type.
 and in those with DM1 (red dashed line) and DM2 (solid black line). Notably, patients treated with SGLT2 inhibitors exhibit a proportional growth in DKA incidence that parallels the increasing adoption of this therapeutic class in clinical practice. This analysis suggests that multiple factors—including changes in treatment approaches and the impact of comorbidities—may have contributed to these trends. DKA: diabetic ketoacidosis; SGLT2i: sodium–glucose cotransporter-2 inhibitors.")
Total Incidence of DKA and Incidence Among Individuals Treated with SGLT2 Inhibitors.
The graph shows a progressive increase in DKA cases from 2010, with a marked acceleration from 2020 onwards. This rise is consistently observed both in patients treated with SGLT2 inhibitors (blue dashed line) and in those with DM1 (red dashed line) and DM2 (solid black line). Notably, patients treated with SGLT2 inhibitors exhibit a proportional growth in DKA incidence that parallels the increasing adoption of this therapeutic class in clinical practice. This analysis suggests that multiple factors—including changes in treatment approaches and the impact of comorbidities—may have contributed to these trends. DKA: diabetic ketoacidosis; SGLT2i: sodium–glucose cotransporter-2 inhibitors.
The need for ICU admission and 30- and 90-day mortality were assessed in patients with DM1 and DM2. ICU admission was more common in patients with DM1 (50.6%) than in those with DM2 (35.2%; p= 0.020). In contrast, mortality was significantly higher in patients with DM2 at both 30 days and 90 days (13.5 vs 1.3%; p< 0.001 and 14.8 vs 3.1%; p= 0.001, respectively).
A correlation matrix was performed on 30-day mortality and variables obtained from personal history, physical examination and ED laboratory tests. A statistically significant association was observed between age; the presence of heart disease, stroke or active cancer; not being a candidate for ICU; and DM2. A high respiratory rate in the emergency department, lower baseline oxygen saturation, a worse Glasgow Coma Scale score and having a cardiovascular event as a trigger for DKA were also significantly associated with 30-day mortality. Finally, among the emergency department laboratory variables, only elevated urea levels were significantly associated with mortality. The results of all correlation matrices are shown in Appendix B, Supplementary Material S1.
A logistic regression model was performed with variables that were associated with overall 30-day mortality in a statistically significant way using Spearman's Rho >0.25, observing that differences in mortality were associated with the severity of the trigger and neurological impairment. Patients with a cardiovascular event as a trigger for DKA (β: 2.36: 95% CI 0.20–4.54; p= 0.033) and higher urea levels (β: 0.03; 95% CI 0.012−0.049; p= 0.001) were associated with higher mortality. On the other hand, a higher Glasgow scale score was associated with a lower risk of 30-day mortality (β: –0.28; 95% CI: –0.51– 0.054; p= 0.015). There was no statistically significant association between mortality and other variables such as type of diabetes or age (Table 4).
Logistic regression analysis of differences in 30-day mortality.
| 30-day mortality | β-coefficient | 95% confidence interval | P value |
|---|---|---|---|
| Type 2 DM | 2.10 | –0.35–4.54 | 0.093 |
| Age (years) | 0.06 | –0.015−0.14 | 0.113 |
| Candidate for ICU | –0.57 | –2.60−1.47 | 0.585 |
| Glasgow (score) | –0.28 | –0.51–0.054 | 0.015 |
| CV event | 2.37 | 0.19−4.53 | 0.033 |
| Urea (mg/dl) | 0.03 | 0.012−0.049 | 0.001 |
CV: cardiovascular (DKA trigger); DM: diabetes mellitus; Glasgow: Glasgow Coma scale; ICU: intensive care unit.
The logistic regression model revealed a statistically significant independent association between cardiovascular events as a precipitating factor and urea levels with mortality. A higher Glasgow Coma Scale score was associated with a lower risk of mortality.
The aim of this study was to examine the clinical and laboratory differences, as well as potential prognostic factors, in DKA episodes in individuals with DM2 compared to those with DM1. Our findings revealed that patients with DM2 have a higher risk of mortality, based on the severity of the precipitating factor and the degree of neurological impairment, despite presenting with a more favorable initial acid–base profile than patients with DM1.
DKA in DM2 is an uncommon but not extraordinary phenomenon. Although it has historically received less attention than in DM1, its assessment and treatment should follow similar principles in both conditions.2,8 However, some studies have attempted to compare the clinical features of DKA in DM1 and DM2 to identify relevant differences. In this context, our findings are consistent with the literature describing a higher mean age in patients with DKA associated with DM2.10,11 On the other hand, we observed that triggers in DM2 differ markedly with DM1. While treatment omission was the main cause in DM1, infections were the main cause in DM2.8,10 Furthermore, acute cardiovascular events were a much more common trigger in DM2 than in DM1. In this regard, the higher proportion of severe triggers in DM2 was associated with lower baseline oxygen saturation, longer duration of symptoms and greater impairment of consciousness, reflected in lower scores on the Glasgow scale, as has been described in other studies.14 Some variables showed trends towards differences between individuals with DM1 and DM2, although without reaching statistical significance, such as mental health history or alcohol and tobacco use. In this context, differences in substance use and dietary habits between the two types of diabetes have been reported, although this varies considerably across different regions.15 Likewise, several studies have identified differences in the mental health profiles of people with DM1 and DM2.16
However, despite having milder triggers, our laboratory results showed that the severity of metabolic acidosis was higher in patients with DM1. pH and bicarbonate levels were lower in this group, at the expense of higher capillary ketone body titres and higher ICU admission rates. These findings suggest a higher initial severity in the profile of DKA in patients with DM1, which requires more procedures in the first hours8 but does not always translate into higher mortality in the short term.17 Although variables such as pH, bicarbonate levels, and the severity of acidosis are typically closely associated with the need for ICU admission in the context of DKA,18 our analysis did not find a direct correlation between these variables and mortality. It is important to note that ICU admission is not always linked to higher DKA-related mortality rates,19 and inter-hospital variations in the use of intensive care have also not been shown to significantly impact length of hospital stay or mortality rates,20 This suggests an indirect relationship between ICU management and mortality, which could explain why variables traditionally associated with the indication for intensive care did not emerge as predictors of mortality in our study. In contrast, other studies with similar objectives to ours,10,14,21 found no significant differences in pH levels between the two patient subgroups, although a worse prognosis was observed in DKA associated with T2DM. These discrepancies may be attributed to differences in study design, including highly variable patient samples and geographical settings distinct from the European context.
During the study period, we collected more than 200 consecutive DKA events and observed a trend of increasing episodes over time. This phenomenon has already been described in recent decades22 and more recently after the COVID-19 pandemic,3 although the increase in DM1 incidence observed in recent years in Europe23 has not been observed in Spain.24 In our case, the marked increase in the time trend from 2020 onwards, both in patients with DM1 and DM2, is particularly striking. Despite the association between SGLT2 inhibitors and an increased risk of DKA—and even ICU admission for this reason25—compared to other oral antidiabetic agents, the rise in incidence was similar among patients treated with these drugs and those who were not, with parallel incidence trends observed across DM1, DM2, and patients on SGLT2 inhibitors. The peak in incidence coincided with the COVID-19 pandemic, suggesting a possible influence of viral infection in triggering DKA, which was not explored in this study. However, it is likely that a major contributing factor to the observed rise in cases was the impact of the pandemic on healthcare access across all patient groups, including reduced follow-up, decreased physical activity, poorer glycaemic control, lower treatment adherence, and even loss of medical follow-up.26
In the prognosis of DKA, we observed that mortality was significantly higher in patients with DM2 at both 30 and 90 days. This finding has been confirmed on multiple occasions in the literature.10,14 In the logistic regression model for 30-day mortality, the differences in mortality were attributed to the severity of the precipitating factor and the resulting neurological impairment, without being associated with patient age or type of diabetes. In this context, we propose the hypothesis that the poorer prognosis in patients with DM2 is not due to the type of diabetes itself, but rather to characteristics commonly associated with this population—such as greater neurological compromise, more severe precipitating factors, and markers such as elevated urea levels, likely reflecting reduced functional reserve. Therefore, it is crucial to exercise heightened vigilance in DKA episodes occurring in individuals with DM2, even when the initial acid–base imbalance appears mild, given the high rate of severe precipitating factors and short-term mortality observed in this group.
This study has several limitations. As a retrospective observational study, its ability to establish causal relationships is limited to the generation of hypotheses. Additionally, its single-centre nature may introduce bias due to contextual particularities that may not be generalisable to other settings. A significant limitation is the exclusion of individuals with missing data, a common issue in observational research that may introduce selection bias and limit the generalisability of the findings. Furthermore, there was insufficient information regarding patients who were transferred to other centres, making it impossible to determine whether their characteristics differed significantly from those included in the analysis. Thirdly, the study did not collect data on the timing of care delivery or the duration of DKA resolution. Likewise, immunological or vaccination status, including SARS-CoV-2 infection rates among participants, was not assessed—factors that could have provided further insight into the rise in incidence observed in our setting. Socioeconomic variables, which play a crucial role in diabetes management and its complications, were also not included. It is well established that factors such as income, educational level, and access to healthcare can significantly influence treatment adherence, access to advanced technologies, and the ability to implement necessary lifestyle changes for adequate metabolic control.27,28 The absence of these variables may limit the interpretation of the results, as patients in more vulnerable socioeconomic situations are known to experience worse clinical outcomes.29 Finally, the study did not evaluate the impact of technological advancements in diabetes care30 in recent years on DKA, which could also contribute to differences observed in glycaemic control and associated complications.
In summary, DKA in DM2 is associated with a poorer short-term prognosis despite presenting with a more favorable initial blood gas profile. The severity of precipitating factors and the extent of neurological impairment may account for the increased mortality risk observed. There is a rising trend in the incidence of DKA in both DM2 and DM1, the causes of which remain to be fully determined.
CRediT authorship contribution statementFS-V and JAM-A: participated in the study design, investigated the data, contributed to the discussion and wrote/edited the article. CM.O: performed the statistical analyses. MST-S: ML-R and MM: wrote/edited the article. JJR-L, VNM, SA, SG-C, EC-L and CS-L: participated in data collection and reviewed/edited the article.
All authors reviewed the data, contributed to the development of the manuscript and approved the final version for submission.
Ethical approval and consent to participateThis study was approved by the Research Ethics Committee of Hospital de La Princesa, Madrid (study number 5554-06/24), which also waived informed consent for patients. The research was conducted in accordance with the Declaration of Helsinki.
FundingThis work was funded by Health Research ProjectsPI19/00584, PI22/01404 and PMP22/00021 (funded by the Carlos III Health Institute), iTIRONET-P2022/BMD7379 (funded by the Community of Madrid) and co-funded by ERDF funds to MM.
Declaration of competing interestThe authors declare that they have no conflicts of interest.
Appendix. Supplementary materialSupplementary material associated with this article can be found in the online version available at https://doi.org/10.1016/j.medcli.2025.106973.
