


This paper identifies the factors that affect the primary and secondary market spreads of fixed and variable rate bonds issued by sub-sovereign European governments. The two markets were analyzed separately to compare whether the factors for the primary market coincided with those for the secondary market. Data for the period between February 2008 and December 2013 were analyzed using panel data estimation. The two markets behaved almost identically, and the signs of the variables were as expected in nearly every case. The most important factor determining the spread of sub-sovereign bonds was the spread of the sovereign bond.
El articulo identifica los factores que afectan al spread de los bonos de tipo fijo y variable en los Mercados primarios y secundarios, emitidos por los gobiernos subsoberanos europeos. El análisis de ambos mercados será realizado por separado para comparar si los determinantes en el Mercado primario coincide con los del secundario. El analisis examinará el periodo comprendido entre febrero de 2008 y diciembre de 2013 utilizando una estimación por datos panel. Se concluye que ambos mercados tienen aproximadamente comportamientos idénticos y los signos de las variables coinciden con los esperados en la mayoría de los casos. Tambien, concluimos que la variable más importante en la determinación del spread del subsoberano es el spread del soberano.
In times of low interest rates and major macroeconomic uncertainty it is natural that the types of investment which become more appealing are those regarded as relatively safe and which at the same time offer higher yields than investment grade sovereign bonds. Issuing sub-sovereign bonds has a number of potential advantages because bonds are usually issued with a term of 3–10 years and can thus help to improve medium to long-term financial planning. Also the costs may be lower than for bank loans, and they have a positive impact on fiscal policy solidity. There are nevertheless also potential risks, they assume bigger risks than the central government and excessive indebtedness of sub-sovereign entities can jeopardize the solvency of the central government (Vetter, Zipfel, & Fritsche, 2014).
The sovereign debt crisis in the euro area has had major consequences for European bond markets. As a consequence of the crisis in Europe, the low yield spreads among government bonds issued by the Member States of the European Monetary Union (EMU) – which mainly were a result of the introduction of the common currency – now seem to be a phenomenon of happier times. In fact, creditors now have started to distinguish clearly between the different Members States of the euro are (Sibbertsen, Wegener, & Basse, 2013). A question at the heart of the policy debate is to which extent market prices of sovereign bonds reflect economic fundamentals in an appropriate fashion, or whether swings in risk appetite have led to an under-pricing of risk prior to the global financial crisis, and possibly an over-pricing of risk during the European sovereign debt crisis (Aizenman, Jinjarak, & Park, 2013).
Access to capital markets for financing is not homogenous from one country to another.1 In Europe, the market for sub-sovereign bonds is dominated by Germany's subordinate levels of government. Germany's regions and local authorities appeal most to the market. Specifically, 40.97% of the outstanding debt of German local authorities is implemented as bonds with domestic placement even though some large states issue bonds through Euro Medium Term Notes (EMTN) that provide them with a more diverse investor pool and allow them to place bonds in other countries. Additionally, city-states such as Berlin, Hamburg, and Bremen, as well as Sarre and some states in East Germany and Rhineland-Palatinate, usually issue joint bonds – unique issuances for those who benefit from the guarantee of the bonds. This formula allows the bonds to increase in number and to be more diversely distributed, which allows them to benefit from a sufficient minimum liquidity.
Spanish institutions are the second-largest institutions using capital markets to obtain financing, and 35.99% of Spanish debt is financed by securities. If the municipal and provincial debt, which is bank debt, minus a few exceptions, were discounted, the weight of assets would be significantly higher. Spain's Autonomous Communities (AC) governments have recently used mostly bonds to diversify their investor base after experiencing a significant increase in financing needs. Some more sophisticated communities have attempted to diversify their investor base by using EMTN programs, such as Generalitat Valenciana (since 1998) and Generalitat of Catalonia and Junta of Andalusia (since 2009) or Euro-Commercial Papers (ECP), which are short-term notes and are generally issued at a discount up to 360 days. (Generalitat Valenciana since 1993 and Generalitat of Catalonia since 2010).
Various Italian regional institutions recently began using capital markets, regardless of the size of the issuances and typically at very long terms (30 years) due to legal issues and the necessity to issue bonds with annual amortization. The use of the capital markets increased due to greater institutional needs, as well as financial conditions on loans granted by Italian banks well above the cost of financing in the marketplace. Italian institutions have begun almost exclusively using loans from la Cassa dei Depositi y Prestiti, a public bank controlled by the Italian treasury that has the capacity to make loans under market conditions because it offsets postal savings.
In the case of French institutions, except for Ile-de-France, some other regions and the city of Paris, virtually all financing is done through bank loans or private placements. In fact, there are fifteen local and regional institutions using bonds, but only nine of these institutions are active. Furthermore, the French central bank has voluntarily included interest rate derivatives in these loans in a way that offers local institutions a financing package and derivatives that allow them to easily manage the risk of their debt portfolios. However, this apparent added value provided by the bank, which the regions support, has, at times, hidden the excess costs of financing. French institutions have begun struggling to finance the deficit due to the central bank's liquidity issues. Thus, local French institutions created an investee for every entity that issues bonds in the capital market. The investee's funds will be loaned to members in conjuction with their participation in social capital initiatives, following the Scandinavian model. The advantage of the Scandinavian model is that difficulties in accessing capital market financing due to small institutional size will be eradicated.
A broad and interesting literature exists that deals with determinants of sovereign bond yield spreads. However, the results of these studies are rather heterogeneous, because they use different econometric models, country samples, observation periods and variables considered. We want to contribute to this field, so this paper identifies the factors that affect the spread of fixed and variable type bonds in the primary and secondary markets issued by sub-sovereign European governments. The analyses of both markets will be done separately to compare whether the determinants in the primary market coincide with those in the secondary market. The analyses will examine the period between February 2008 and December 2013 using panel data estimations.
We particularly focus on sub-sovereign European governments, where the data are more complicate to get. But identifying the determinants of sub-sovereign yield spreads is an important research question because it helps to understand which factors determine capital costs in the regions.
The rest of the paper is structured as follows. “Literature review” section reviews the literature on bond spreads. “European sub-sovereign government spread specifications” section details the specifications of bond spreads used in the empirical analysis. “Sample” section explains the primary and secondary market samples. “Results of bond spread estimates static regressions” section analyzes the results of the primary and secondary market estimations. “Results of bond spread estimates dynamic models in the secondary market” section reviews the results of the secondary market using dynamic models. Finally, “Conclusions” section summarizes the main conclusions of the paper.
Literature reviewThere is a large literature on the pricing of sovereign bonds to which this paper connects. Edwards (1984) indicated that the credit spreads of governments are related to the market's perception of the risk of default. Thus, the spreads can be explained by a combination of macroeconomic, financial, and fiscal variables – domestic and international – that play a part in the credit ratings of investors.
One of the variables used as a determinant of the credit spread levels of bonds is rating. Hastie (1972) and Cantor and Packer (1996) found a coincidence between bond spreads and ratings issued by rating agencies. Reisen and Von Maltzan (1999) concluded that anticipated announcements regarding rating reductions by the three most important agencies in emerging markets have significantly impacted bond spreads. Most recently, Martell (2008) showed that sovereign bond spreads tend to increase when ratings decrease.
Gómez-Puig (2006) considers domestic factors to be important determinants of public debt spread in European countries since the birth of the Eurozone. Gómez-Puig used rating as a proxy for credit risk, allowing the amount to be used as a factor linked to the depth of the market and the spread bid-offer of debt in the secondary market to be used as an indicator of transaction costs.
Van Landschoot (2001) studied the relationship between government credit spreads and public budget composition in the seven Eurozone countries during the 1990s, estimating the spreads in relation to debt, budget results, GDP growth, inflation, and current account balance. Van Landschoot concluded that the increased share of investment spending at the expense of public consumption or increased tax revenues reduces spreads.
Bonilla, Garcia, and Marti (2007) showed that Euromarket bond spread between 1995 and 2000 is explained by duration, interest rate, country risk and rating, although the latter factor is inconsistent with traditional theory. In conducting a sovereign debt analysis for the years 1998–2004, Délano and Selaive (2005) conclude that no more than two factors explain much of the common variability of sovereign spreads, particularly in countries with speculative ratings.
Koukouritakis and Michelis (2008) conclude that there exists a weak interdependence between the long-term and short-term intertemporal structure of interest rates among newly integrated European Union countries. Using a dynamic panel of Eurozone country debt, Attinasi, Checherita, and Nickel (2009) conclude that risk aversion explains 56% of the spread variation, deficit and debt explain 21%, and liquidity explains only 14%.
Haugh, Ollivaud, and Turner (2009) measured the impact of spreads based on the fiscal situations of countries in high-risk aversion environments. The fiscal situation significantly influenced bond spreads in Ireland and Spain, where high-risk aversion was maintained, whereas in the remaining countries, the spread remained the same. However, countries with high-risk aversions were all significantly affected by fiscal deterioration.
In a study of spreads of public debt in European countries in relation to bonds, Athanasiadis (2010) concluded that the deficit, in particular, and stock debt affect spread evolution. Schuknecht, Von Hagen, and Wolswijk (2009) found that public debt spreads are positively correlated with the difference in the country debt ratio and the corresponding reference country. In a study of European public debt and the impact of the financial crisis between 1991 and 2009, Schuknecht, Von Hagen, and Wolswijk (2010) found that bond spreads during the crisis are explained by fundamentals and that the public deficits suffered greater penalties since the 2008 Lehman Brothers collapse.
There is a growing literature on EMU sovereign bond during the current period of financial turmoil. Alexopoulou, Bunda, and Ferrando (2009) studied the determinants of bonds of the new countries in the European Union. The fundamentals of the economy are the relevant determinants of the evolution of spreads, particularly in the Czech Republic, Latvia, Lithuania, Bulgaria and Poland. D’Agostino and Ehrmann (2013) concluded that the spread of one country in relation to a country considered a refuge is influenced more by the core countries than by the refuge country. There are considerable temporal effects, and in the initial years of the Eurozone, neither the core countries nor the liquidity premiums were reflected in the spreads of the aforementioned countries. After Afonso, Arghyrou, and Kontonikas (2015) analyzed the determinants of sovereign bond yield spreads in the EMU, they concluded that sovereign credit ratings are statistically significant in explaining spreads, yet relative to macro- and fiscal fundamentals, their role has been rather limited
Regarding the literature on bond spreads of sub-sovereign governments, some studies address the relationship between budget constraint and credit spread and the existence of credit rationing that implies the acceptance of the hypothesis that the market disciplines the borrowing of subcentral governments, pushing up interest rates paid with increasing debt stock, and generates an incentive to borrowers to avoid excessive debt. Bayoumi, Goldstein, and Woglom (1995) concluded that there is a negative relationship between fiscal constraints on borrowing and credit spreads, although this relationship is not linear. Monasterio-Escudero, Blanco, and Sánchez-Álvarez (1999) concluded in the case of the AC that there is a negative relationship between the financial cost of debt and debt stock measured in terms of debt/GDP. The researchers argued that the findings were influenced by the study period, which coincided with strong interest rate reduction and higher debt.
Heppke-Falk and Wolff (2008) and Lemmen (1999) studied reference bonds in the German sub-sovereign market from a public finance perspective, concluding that there is a weak relationship between the bond spread and debt, the variable being insignificant in some cases. Schulz and Wolff (2008) performed a study from 1999 to 2007 of the daily market rates of the Landers. The results show that high relative indebtedness to the federal government and the rejection by the German Constitutional Court of an application for federal assistance from the state of Berlin had little impact on the spread. Recently, Jenkner and Lu (2014), in relation to the Spanish ACs and with the emergence of mechanisms of state support (FLA, FFPP, ICO), demonstrated that this support came at a cost to the state in the form of a higher risk premium. Jenkner and Lu showed that state debt increased by an average of 10.5.
European sub-sovereign government spread specificationsEmpirical estimates using data on issuances in euros made by European sub-sovereign governments determine the factors affecting a spread2 by using the following specification proposed by Schuknecht et al. (2010):
where, yij, spread of region i's issuances in the year j calculated in relation to the Euro swap curve; cij, credit risk variables of region i in the year j. Stock debt/GDP (DEBT) and stock debt/GDP squared (DEBT2) all refer to the previous year. Additionally, the rating represents a numerical variable depending on the grade. The rating is the average of the three ratings (assigning each rating an ordinal number of 21-8) of the explicit derivatives, and if and where appropriate, the implicit derivatives of a multinomial probit model (RMR). lij, variable of the liquidity of region i in year j. The variables are represented by the size of the issuances in millions of euros (AMOUNT) and the DURATION is expressed as a number of years. sij, credit risk variables of a state in region i in year j. The variables are the rating of the average state (RME) and the bond spread in relation to the 10-year swap (COUNTRY10A) determined in percentage and reflecting the spread of the sovereign state correspondent in relation to the curve. wij, risk weighing of region i in year j (RW). This refers to the capital consumption of credit institutions for holding bonds. The variable is binary, having a value of 1 in the case of being 20% and a value of 0 in the case of being 0%. mij, variables of market and term. The variables are the short-term interest rate (Euribor at one month) (EUR1M) and the slope of the swap curve (type 10-years, type 3-years) (PEND), both expressed in percentage. eij−1, economic variables in region i in year j. The unemployment rate (UNEMPLOYMENT) for the previous year. rij, variables of risk aversion. Monthly standard deviation of daily performance of Eurostock-50 (VOLATILITY), which stock market volatility and market risk. kij, Dummy crisis and countries variables. The LEHMAN variable has a value of 0 before the collapse of Lehman Brothers and a value of 1 after the collapse. DRAGHI has a value of 1 beginning when DRAGHI in 2012 announced its willingness to help stabilize the public debt market. FLA has a value of 1 for the ACs from the entry into operation of the mechanism.
In the first phase, estimates are made using fixed and random effects. By using the Hausman test, the most efficient specification is selected. In the second phase, the chosen specification is subjected to an endogeneity contrast, and estimates are made by instrumental variables and by the Hausman test to determine whether or not endogeneity exists and the necessity for implementing variables. Finally, if there is no endogeneity, the estimate for serial correlation, contemporary correlation, and heteroskedasticity specifications with fixed effects are corrected but only using serial correlation if the best specification was made using random effects.
SampleDeveloping databases for analysis was a complex task. The covered issuances are exclusively denominated in euros, but the sub-sovereign issuances were issued in different currencies during the analyzed period.3 Additionally, each issuer had different outstanding issuances trading in the secondary market over the same timeframe of the analysis, and there should be only one spread per issuer. Therefore, a unique temporal series with monthly data and maximum time information was built for each sub-sovereign issuer. The work was difficult because Bloomberg and similar systems do not disclose information for all sub-sovereign issuers, and most of the series have information on spreads for only one or two years. The quotation variable is the spread in relation to the swap curve.
The database of regional government debt spread in the secondary market was constructed using daily information from the Valencian Financial Institute (IVF) collected between March 2001 and February 2008 from various entities, such as Banco de España, Bolsa de Barcelona, BBVA, Santander, BNP, CDC, Unicredit, Commerzbank, Societé Generale, Barclays, Goldman Sachs, WLB, JP Morgan, LBBW, DGZ bank, RBS, HSBC, Morgan Stanley, Dresdner, Credit Suisse, AIAF, Reuters, and Bloomberg. The information from February 2008 to December 2013 was obtained from Bloomberg, when available.
To create a time series by issuer, instead of calculating the average weighted spread for each date, keeping in mind the totality of issuances quoted for each date, we chose the issuance that is most represented by liquidity in each moment (amount) and a residual time of nearly 10 years. Building a complete database of all of the sub-sovereign issuers from March 2001 to December 2013 was impossible because the issuer activity of the regions began at different times and not all of the information for each issuance was available. Thus, the generated panel was incomplete, and each region was juxtaposed with different issuances with average monthly quote data.
Other financial variables, such as the slope of the swap curve of the euro, the spreads in relation to the swap curve of each sovereign state, currency rates or the Eurostock-50 index, are from Bloomberg. An average was created for the regions and the state to obtain the rating. The information from the agencies did not fully disclose the ratings of the regions. An implicit rating was estimated according to the appropriate specification of the multinomial probit model, calculating for all cases the average of the three agencies. This method was preferred over the alternative of calculating the average of all available agencies because in many cases, the result differs for the same region.
Because some of the studies were replicated, the spreads are not an average of every region's issuances quoted during a timeframe. However, a spread for particular issuances is selected for each point in time and is calculated for each region. In selecting fixed-rate issuances, preference is given to the larger issuances and to those with a residual term of 10 years.
Data from the IVF were used to measure the primary market. The IVF obtained these data from news sources, such as IFR, Euroweek, Reuters, and Bloomberg, and completed the data with information from Barclay's Dealogic database. Both public and private issuances made by the sub-sovereign European governments of Germany, Austria, Belgium, France, Italy, and Spain between 1999 and 2013 were collected.
Three databases were created for the primary market. The first database encompasses all issuances denominated in euros and served as a descriptive initial analysis. The second database encompasses issuances in which a maximum was selected per issuance per year per issuer, and the third database selects as a maximum an issuance per month per issuer, prioritizing the term close to 10 years and fixed rate issuances rather than variable rate issuances. The selection criteria used for the third database excluded issuances of structured or indexed rates and prioritized issuances of fixed rates over variable rates, issuances of greatest volume and those with terms near 10 years.4
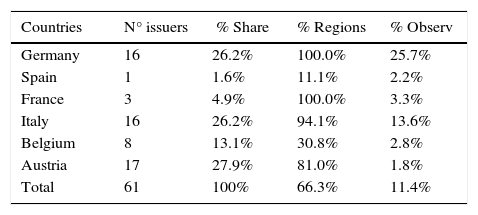
We gathered 61 regional European issuers in the primary market with a maximum of temporal observations per issuer of 180 months for 10,980 observations. The number of issuers is nearly double the number of spread estimates in the secondary market (Table 1).
Distribution of issuers in the primary market.
| Countries | N° issuers | % Share | % Regions | % Observ |
|---|---|---|---|---|
| Germany | 16 | 26.2% | 100.0% | 25.7% |
| Spain | 1 | 1.6% | 11.1% | 2.2% |
| France | 3 | 4.9% | 100.0% | 3.3% |
| Italy | 16 | 26.2% | 94.1% | 13.6% |
| Belgium | 8 | 13.1% | 30.8% | 2.8% |
| Austria | 17 | 27.9% | 81.0% | 1.8% |
| Total | 61 | 100% | 66.3% | 11.4% |
Source: Own elaboration.
Of the 10,980 maximum potential observations in the data panel for the analyzed period, only 1247 observations, or 11.4% of the observations, are used. In terms of the number of issuers in the sample, Italy, Spain, and Germany have a higher number of issuers, with a relative weight among them. The issuers included in the database hail from nearly every region of every country except France and Austria. France lacks issuers because its regions are financed primarily by the banking market, and Austria lacks issuers because the issuances occur in other currencies, such as the Swiss Franc, and because it has a low level of debt.
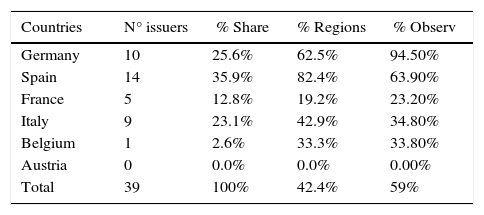
Data on regional bond spreads in the secondary market for 39 regions with a maximum of 154 observations per issuer are included (Table 2). Within this set of regions, the greatest participation corresponds primarily to the sub-sovereign Spanish issuers (14) and secondarily to the German States (10).
Distribution of issuers in the secondary market.
| Countries | N° issuers | % Share | % Regions | % Observ |
|---|---|---|---|---|
| Germany | 10 | 25.6% | 62.5% | 94.50% |
| Spain | 14 | 35.9% | 82.4% | 63.90% |
| France | 5 | 12.8% | 19.2% | 23.20% |
| Italy | 9 | 23.1% | 42.9% | 34.80% |
| Belgium | 1 | 2.6% | 33.3% | 33.80% |
| Austria | 0 | 0.0% | 0.0% | 0.00% |
| Total | 39 | 100% | 42.4% | 59% |
Source: Own elaboration.
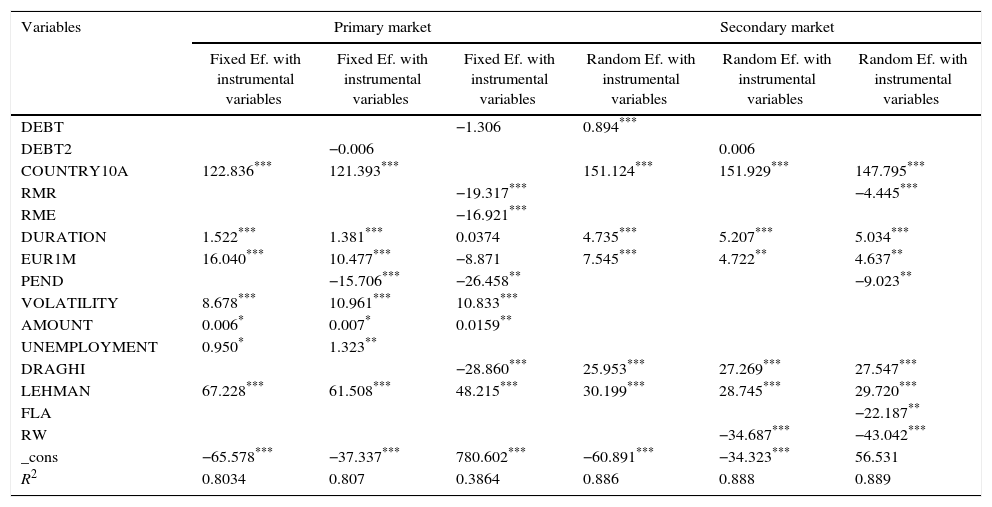
Sub-sovereign bond spreads issued in the primary and secondary market are estimated using Eq. (1). The estimation of bond spreads in both markets are performed to determine if the significant variables are the same, if they have the same sign, and whether or not they have similar sensitivity to the spread. Static regressions compare fixed effects estimates and random effects estimates. Table 3 reports the results of the six specifications.
Spread estimates. Static models.
| Variables | Primary market | Secondary market | ||||
|---|---|---|---|---|---|---|
| Fixed Ef. with instrumental variables | Fixed Ef. with instrumental variables | Fixed Ef. with instrumental variables | Random Ef. with instrumental variables | Random Ef. with instrumental variables | Random Ef. with instrumental variables | |
| DEBT | −1.306 | 0.894*** | ||||
| DEBT2 | −0.006 | 0.006 | ||||
| COUNTRY10A | 122.836*** | 121.393*** | 151.124*** | 151.929*** | 147.795*** | |
| RMR | −19.317*** | −4.445*** | ||||
| RME | −16.921*** | |||||
| DURATION | 1.522*** | 1.381*** | 0.0374 | 4.735*** | 5.207*** | 5.034*** |
| EUR1M | 16.040*** | 10.477*** | −8.871 | 7.545*** | 4.722** | 4.637** |
| PEND | −15.706*** | −26.458** | −9.023** | |||
| VOLATILITY | 8.678*** | 10.961*** | 10.833*** | |||
| AMOUNT | 0.006* | 0.007* | 0.0159** | |||
| UNEMPLOYMENT | 0.950* | 1.323** | ||||
| DRAGHI | −28.860*** | 25.953*** | 27.269*** | 27.547*** | ||
| LEHMAN | 67.228*** | 61.508*** | 48.215*** | 30.199*** | 28.745*** | 29.720*** |
| FLA | −22.187** | |||||
| RW | −34.687*** | −43.042*** | ||||
| _cons | −65.578*** | −37.337*** | 780.602*** | −60.891*** | −34.323*** | 56.531 |
| R2 | 0.8034 | 0.807 | 0.3864 | 0.886 | 0.888 | 0.889 |
In the primary market, the best estimates are obtained using fixed effects and instrumental variables. The same factors are not included in all estimations because all three factors are endogenous. The variables DEBT, DEBT2, and COUNTRY10A are endogenous even though DEBT and DEBT2 are insignificant. Thus, the sovereign state spread influences the sub-sovereign government spread and vice versa, and both spreads have the same sign.
The three specifications that belong to secondary market are estimated with random effects with instrumental variables. The instrumental variables are implemented due to the endogeneity of some of the variables in the spread, such as COUNTRY10A and DEBT. Thus, debt determines the spread, and the evolution of the spread determines the stock debt of the regions. Therefore, the decision of sub-sovereign governments to elevate debt depends on the spread itself. The results show that sovereign states are capable of controlling sub-sovereign issuances and solvency to avoid negative effects on their premiums.
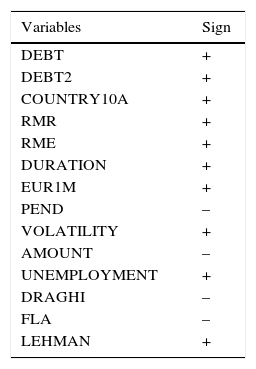
The estimated coefficients have expected signs (Table A.1 in the annex), with the exception of variables DRAGHI, RW and AMOUNT. DRAGHI is positive because circumstances in 2012 existed in a way that distorted reality. To maintain the RW bonds, the capital consumption of banks should have reflected opposite circumstances. The AMOUNT was insignificant in the secondary market specifications but is in primary market significant, although its sign is different than expected. A plausible explanation of the contrary result is that both public and private issuances are considered in the primary market database, and upon being measured, are always shorter-term, leading to a lower spread. However, the duration is significant and has the expected sign.
The credit risk variables are significant and have the expected sign, DEBT being positive and RMR being negative. An increase in stock debt/GDP of 1% generated an increase in the spread of 0.89bps in the secondary market, and an average level improvement within the rating scale led to a spread increase of 4.4bps in the secondary market and 19.3pbs in the primary. Duration is significant and has the expected sign and confirms a greater spread when the issuance term increases. According to the specifications, each time the issuance increases by one year, the spread increases by 5bps in secondary market and 1bps in the primary.
The spread of the Sovereign (COUNTRY10Y) is significant in relation to the spread and has the expected sign. However, it is significant that a sovereign bond spread increase of 10bps causes an increase of 15pbs in sub-sovereign government bonds in the secondary market and 12pbs in the primary. This increase signifies that when sovereign state risk increases/decreases, there is an amplified effect in the regional environment.
Furthermore, the market variables, except for VOLATILITY in the secondary market, are significant and have the expected sign. EUR1M has a positive sign and PEND has a negative sign. An increase in interest rates or stock market volatility increases spreads, which fits the idea that if the market is unstable, investors will take refuge in short-term assets, causing an increase in bond spreads, or that an increase in currency rates implies a flattening of the intertemporal structure of interest rates (PEND, negative), discouraging long-term demand and driving up spreads.
The UNEMPLOYMENT variable is significant and positive only in the primary market, aligning with what was assumed. A higher rate of unemployment creates greater fundamental weakness in the same region and, consequently, a higher spread.
The CRISIS dummies are significant and have the expected signs. DRAGHI has a negative sign, i.e., the spreads are better after the appearance of the governor of the ECB, and LEHMAN has a positive sign, indicating that the spreads increased after the American banking sector collapsed.
Finally, some of the factors in the secondary market spread are more sensitive than others. COUNTRY10A, being the corresponding state bond spread, has a similar sensitivity to that of the secondary market. An increase of 10bps in state bonds leads to an increase of 12.3/12.1bps in regional bond spreads. However, the rating and market variables are significantly more sensitive. An improvement of regional or state rating level has a positive influence, enhancing the spread by 19bps or 17bps in relation to the 4.4bps of the specifications in the secondary market. With an increase or decrease of 10bps in the interest rate curve, the effect on the spread is 1.6bps or 8.9bps, or 2.6bps, respectively. However, these variables in relation to the specifications of the spread in the secondary market have double sensitivity. In regards to duration, each additional year presents an effect on the spread of 1.5bps, in line with the dynamic estimations of the secondary market spread and less than the static estimations.
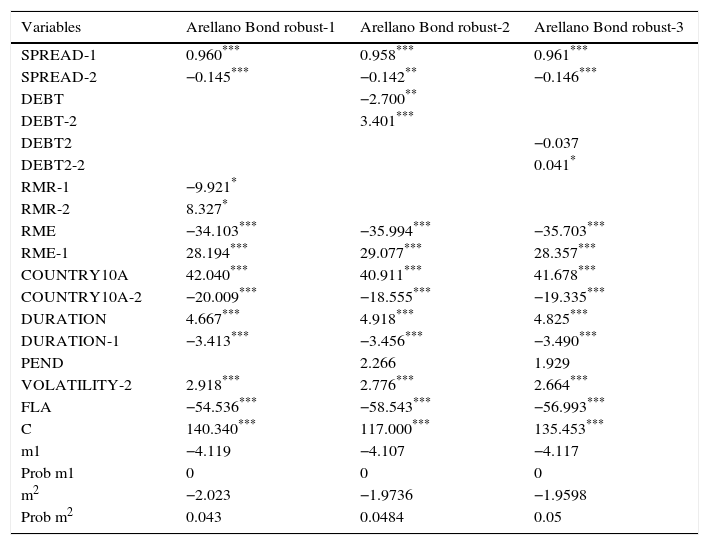
Results of bond spread estimates dynamic models in the secondary marketOnce the specifications were statically analyzed, other dynamic models were estimated using the Arellano-Bond estimator. The data used in the dynamic estimation were confined to the timeframe of January 2006 to December 2013 and consist of 35 sub-sovereign governments. Table 4 reports the results.
Spread estimates on the secondary market. Dynamic models.
| Variables | Arellano Bond robust-1 | Arellano Bond robust-2 | Arellano Bond robust-3 |
|---|---|---|---|
| SPREAD-1 | 0.960*** | 0.958*** | 0.961*** |
| SPREAD-2 | −0.145*** | −0.142** | −0.146*** |
| DEBT | −2.700** | ||
| DEBT-2 | 3.401*** | ||
| DEBT2 | −0.037 | ||
| DEBT2-2 | 0.041* | ||
| RMR-1 | −9.921* | ||
| RMR-2 | 8.327* | ||
| RME | −34.103*** | −35.994*** | −35.703*** |
| RME-1 | 28.194*** | 29.077*** | 28.357*** |
| COUNTRY10A | 42.040*** | 40.911*** | 41.678*** |
| COUNTRY10A-2 | −20.009*** | −18.555*** | −19.335*** |
| DURATION | 4.667*** | 4.918*** | 4.825*** |
| DURATION-1 | −3.413*** | −3.456*** | −3.490*** |
| PEND | 2.266 | 1.929 | |
| VOLATILITY-2 | 2.918*** | 2.776*** | 2.664*** |
| FLA | −54.536*** | −58.543*** | −56.993*** |
| C | 140.340*** | 117.000*** | 135.453*** |
| m1 | −4.119 | −4.107 | −4.117 |
| Prob m1 | 0 | 0 | 0 |
| m2 | −2.023 | −1.9736 | −1.9598 |
| Prob m2 | 0.043 | 0.0484 | 0.05 |
The three specifications in the Sargan test, whose hypothesis is null if the equations are correctly overidentified, are rejected in all instances. This forced us to use robust estimators and the Arellano-Bond test. According to this test, the three estimations have no order 1 serial correlation, and have second order autocorrelations of 95% in one specification and the other two specifications have second order autocorrelations of 90%. The variables that continue being insignificant in the dynamic specifications are UNEMPLOYMENT and AMOUNT. Additionally, the LEHMAN and DRAGHI crisis variables are insignificant, DRAGHI being the variable representing the capital consumption of banks RW and PEND, and DEBT2 having a confidence interval of 95%.
The dynamic specifications show that the SPREAD variable is conditioned by the same delayed variable because it is significant and has the same sign if we consider the two variables together. The duration is as significant in its current moment as it is in its delayed moment, with the difference between the coefficients of both variables indicating that there is a credit curve in which the basis points for each additional year in which sub-sovereign bonds pay lie between 1.2bps and 1.4bps. VOLATILITY, which measures the degree of risk aversion, is the only significant market variable in the three dynamic specifications.
Of the variables that reflect credit risk, DEBT, COUNTRY10A, RME, and RMR are significant as long as DEBT2 is insignificant and has the expected sign. Considering the DEBT variable, each time the debt/GDP ratio increases by one point, the SPREAD increases by 1.3bps, and when a county's risk premium (COUNTRY10A) increases by 100bps, SPREAD increases by approximately 22bps. These figures are substantially lower those obtained by the static estimates.
The rating variables RME and RMR have a different influence. The state rating (RME) is more influential and relevant than the sub-sovereign rating (RMR). If an analysis is made between the state rating (RME) at the current time and the delayed time, an increase in those variables raises the SPREAD by 6/8bps, and the rating of the same sub-sovereign government (RMR-RMR-1), without taking into account the country rating, has an impact of only 1.6bps. The country rating is also an important variable. Finally, of the crisis variables, only the dummy FLA is significant. The coefficient indicates that the effect of FLA input produces a greater SPREAD average of 54/58bps in all regions.
ConclusionsBond issuances do not occur consistently, and they do not follow the same criteria in every region examined in this study. Specifically, not every region, with or without ratings, issues bonds once a certain debt level is reached, nor do all of the regions that issue bonds have ratings, although this is an exception. Of the 92 regions, only 58 regions issued bonds at least once. All of the German states, Spanish ACs and nearly all of the Italian regions issued bonds in the market at least once.
Upon analyzing the factors that influence sub-sovereign bond spreads, considering the issuances of 61 issuers in the primary market between January 1999 and December 2013 (monthly data) or the secondary market between March 2001 and December 2013 (monthly data), with static and dynamic specifications for incomplete panels, the conclusions are nearly identical and the signs of the variables matched what was expected in nearly every case.
All static specifications were estimated using instrumental variables because the Hausman test creates endogeneity among the state spread and debt variables and the spread of the same sub-sovereign government. Thus, not only state debt and spread determine regional spread but also regional debt stock and regional spread influence state spread. In this regard, it is important that federal governments do everything possible to keep the regional spreads from increasing autonomously because they can raise the sovereign state spread. The inertial component of the spread in the dynamic specification of the secondary market is significant and reflects that 81–84% of the spread from the previous period influences the following period.
We can conclude that the most important in determining the spread sub-sovereign variable is the spread of the sovereign state correspondent in relation to the curve. Therefore is closely related regional and national debt in each country.
Otero, Rodriguez, Martorell, and Merigó (2016) examines the effect of securitization and credit derivatives on stability in the banking sector.
Table 1 indicates expected sign of the variables.
The collaboration with the regional Valencian government financial agency, Valencian Financial Institute (IVF), was essential. Two of this paper's authors worked for IVF, which has released daily information for several years on European sub-sovereign government bond issuances and quote information for the secondary market.
The retailer issuances indexed by inflation or structure was eliminated because they have a distorted spread in the analysis. Structured issuances tend to have inferior spreads, whereas other issuances have superior spreads.
articles