


Modern economic growth is no longer found in total factor productivity (TFP) because there are gains from technological change that are never recorded in the returns from innovation or in the National Accounts. The existence of complementarities among technologies derived from the use of robotics, electronic commerce, or innovation is difficult to assess through country-level records. Because the literature has mainly focused on robotisation at an aggregate or industry level, research focusing on a firm level and complementarities analysis have been limited. To fill the gap, in this paper, we intend to provide new evidence regarding the effects of robotisation, digitisation, and innovation on productivity and employment in firms, by using a large sample of 5511 Spanish manufacturing firms for the period 1991–2016. This data captures the payoff to the high rates of investment necessary to upgrade the production technology for firms in a new globally competitive framework.
The increase in the use of automatisation has had a differential effect across occupations and sectors that has not been fully explored (OECD, 2019). Research has focused mainly on robotisation at an aggregate or industry level, and the research focusing on firm level and complementarities analysis has been scarce, leaving many questions unanswered (Seamans & Raj, 2018). To fill the gap, in this paper, we intend to provide new evidence regarding the effects of robotisation, digitisation, and innovation on productivity and employment in firms.
The growing literature on the effects of technologies such as robotisation, artificial intelligence (AI), or big data attempts to explain the transformation experienced by firms since the 90’s. However, no clear account of why and how the changes in productivity are occurring and the complementarities among some of those technologies have been provided. Explanations range from the mismeasurement of creative destruction, suggesting that new products offer higher quality and utility to consumers (Aghion, Bergeaud, Boppart, Klenow, & Li, 2019), to miscalculations of the price indexes of e-commerce goods, especially when considering freebies in online markets (Brynjolfsson & Oh, 2012; Goolsbee & Klenow, 2018) or that the stoppage occurs merely because of a reversal in the growth of firms’ productivity after the initial gains of the information and communications technologies (ICT) revolution (Syverson, 2011).
There is agreement among the literature that this productivity growth in Western economies is due to the innovation of ICT firms that started at the end of the last century and persisted during the Great Recession, which allowed for the improvement of living standards (Jorgenson, Ho, & Samuels, 2011). The impact was both direct, through the innovative firms, and indirect, through the effects that technological innovation had on traditional sectors, and the effect was larger when there was a digital transformation of the firm (Kijek & Kijek, 2019; Kraus, Palmer, Kailer, Kallinger, & Spitzer, 2019), which requires a good deal of complementarities, both in new and established firms in what Soriano, Martinez-Climent, and Tur-Porcar (2018)) call a ‘virtuous circle’ that improves welfare and growth by improving organisation within the firm.
The assessment of this ‘virtuous circle’, including the impact of entrepreneurship, the adoption of one of these forms of digital transformation, the use of industrial robotics, is increasingly important in the current context of the new industrial revolution. Although many companies are eager to adopt these technologies as a way to increase productivity, some concerns have been raised about the cost impact of the transformation, and its effect on the workforce due to training and new forms of work organisation (Acemoglu, Makhdoumi, Malekian, & Ozdaglar, 2019; Díaz-Chao, Sainz-González, & Torrent-Sellens, 2015; Piñeiro-Chousa, López-Cabarcos, Romero-Castro, & Pérez-Pico, 2020).
One of the missing pieces when evaluating growth is the role of complementarities. As Carlaw and Lipsey (2002) posited, new technologies invigorate growth by creating technological complementarities, which are not adequately measured by total factor productivity (TFP). Gains from technological change will occur through indirect effects and externalities that are not easily shown in national statistics. To bridge that gap, we use data from the Encuesta sobre Estrategias Empresariales (Business Strategy Survey, ESEE). The ESEE provides a panel data representing Spanish fabric manufacturing businesses. This annual survey is conducted by the Spanish Ministry of Finance and Public Administration and covers a broad period from 1990 to 2015, including the economic recession and the subsequent recovery period (Torrent-Sellens, 2018).
The ESEE contains yearly information for approximately 1800 Spanish firms and covers three main areas: the strategic decision-making on prices, costs, markets, and investment; the value process, which involves human capital, organisation, entrepreneurial innovation, Research & Development (R&D), and ICT; and the most important indicators and ratios from balance sheets and profits and losses.
With this data, and through a model derived from Van Reenen (1997), Kromann, Skaksen, and Sørensen (2011), and DeCanio (2016), we establish the effect of complementarities in terms of labour productivity and firm performance. Our findings are relevant to understanding the impact of the transformation to robotics and allow for the development of entrepreneurial strategies that boost the efficiency of companies and provide them tools to protect them from negative financial events, leading to an optimal sizing of their workforce.
The remainder of the paper is structured as follows: Section 2 presents a literature review of digital complementarities. In Section 3, we derive a model that helps capture those effects from the data is profusely describe it. Section 4 presents the econometric estimates of the model, which we discuss in detail in Section 5. Finally, Section 6 presents a concise set of conclusions and further directions for research.
Literature reviewCarlaw and Lipsey (2002) describe that complementarity exists in ‘…in situation in which the past or present decisions of the initiating agents with respect to their own technologies affect the value of the receiving agents’ existing technologies and/or their firms which tend to follow proactive innovation strategies, especially in terms of process and technology adoption, like marketing new products, improving their quality, increasing capacity or investing in innovative processes produce those complementarities’.
But to take advantage of complementarities, firms need a wider variety of technology resources that improve their performance. Currently, robotics, AI, machine learning, and big data are inseparably linked within that innovation in the overall economy, but especially in the industrial sector. As companies have evolved, they have focused on the necessity of offering better products with higher quality, making technology improve their performance and opening space for further developments (Dickson & Hadjimanolis, 1998; Kijel & Kijek, 2019).
The effects of these complementarities are diverse and not fully understood. Some of the issues, such as the effect on employment, have attracted substantial interest because the problem is not simply a matter of those workers who will be replaced by automation, defined as the action that replaces human labour activity with work done by machines. The goal of automation trough complementarities is twofold; to increase quality and reduce unit cost (Muro, Maxim, Whiton, & Hathaway, 2019). The impact will be observable: The Organisation for Economic Co-operation and Development (2019) estimates that 14% of current jobs may disappear because of automation and 35% may be seriously affected by the same phenomenon.
The effect on the labour market will be absolute, either directly or indirectly, because of the successive displacement of human capital expelled from its previous posts to other posts with a need for traditional qualifications. Chui, Manyika, and Miremadi (2016)) estimate that in predictable physical activities (e.g. production lines packing), and depending on the complementarities, substitution could reach 78%, and in those that are not foreseeable (e.g. forestry work or farmers), the replacement level is 25%, and substitution on services will depend on their characteristics and on their sources of innovation (Ballestar, Sainz and Soriano, 2018; Philipson, 2020).
Graetz and Michaels (2018) focus on productivity by analysing data from the International Federation of Robotics (IFR) on the role of robots. Their estimations present no change in the number of hours worked after increasing the density of robots; however, without a change in their composition, there is a technological bias in favour of employees with high and medium qualifications. Faber (2018) obtains a similar result: the increase in the density of automation in the United States has a negative effect on the offshoring of production to Mexico and affects knowledge asymmetry.
Acemoglu and Restrepo (2020) also use data from IFR and estimate the effect of competition between robots and human labour on employment and wages in the United States. They find a net reduction in employment by substitution between the robots and labour, which may be linked to differences in use between sectors. With similar data, Frey and Osborne (2017) point to a reduction in employment not only in sectors that are traditionally users of robots, such as the automotive sector, but also in others thus far sheltered, such as services.
Doraszelski and Jaumandreu (2018) use firm data and a shorter sample than ours from the same database and find bias in technological change and that there is indeed a technological bias; however, contrary to what we have commented in preceding paragraphs robotics has a positive sign towards employment. With the same data, Ballestar, Díaz-Chao, Sainz, and Torrent-Sellens (2020) confirm a significant (5%), increasing factor in productivity gains linked to a greater presence of quality human capital in the company but do not provide details on how those gains are achieved.
Also confirming the intuition of Seamans and Raj (2018) that firm data will gather more insights into automation, Blanas, Gancia, and Lee (2019)) advance this idea by using the EU KLEMS data panel and, through a relatively simple model of job demand, find that workers who perform routine and low-skilled tasks, which normally corresponds to women and young adults will be the most affected by the introduction of robots, because of gains in productivity.
These analyses advance, but do not detail, the characteristics of this change that corresponds to the training of employees, how companies have changed their management of the knowledge of their human capital, and the effects of these changes linked to training. To achieve this, we must determine the complementarities of change in employment and productivity to determine the policies of training necessary to avoid unemployment and to focus support on the groups most disadvantaged.
Contrary to Graetz and Michaels (2018) or Acemoglu and Restrepo (2020); Autor and Salomons (2017); Doraszelski and Jaumandreu (2018), and Ballestar et al. (2021) have demonstrated that productivity gains are one of the major benefits in the expansion, concurring with the results that industries can benefit from the growth of labour-augmenting productivity through complementarities, and as employment seems to fall within an industry, as industry-specific productivity increases, positive spillovers to some sectors more than offset the negative effects on other industries or sectors. Seamans and Raj (2018) suggest empirical work that primarily uses statistics aggregated by industry or country but do investigate how complementarities hide under, for example, market structures and labour substation.
This research is the first to estimate some of the complementarities by using firm-level data and whether the gains are limitless, or reach a saturation point, assuming that switching to robotics causes productivity to increase but does not increase it indefinitely, regardless of the complementarities, which affects the TFP growth effects of automation on both hours worked and on the labour share, which should be reflected in wages, leading to an increase in human labour costs.
MethodologyModel and hypothesisBy adapting Van Reenen (1997); Kromann et al. (2011), and DeCanio (2016), our baseline model considers a perfectly competitive firm operating under constant returns to scale. We assume a constant elasticity of substitution production function with three perfect substitutable inputs (labour, capital, and human capital) and with three knowledge-based technologies (robotisation, innovation, and digitisation) of the form
where Q is firm output, and N, K, and H are firm labour, firm capital, and firm human capital, respectively. R (robotisation), I (innovation), and D (digitisation) are labour-augmenting Harrod-neutral technologies, and σ is the elasticity of substitution between labour, capital, and human capital.
We assume that robotisation, innovation, and digitisation mainly result in an increase in R, I, and D. An increase in R, I, and D implies that the same amount of labour services (RN), (IN), and (DN) require less input from labour (N); assuming that, in totally competitive environments, real wage W/P is equal to the marginal product of labour, and the first-order condition for labour can be written as

In the same manner, in perfect competitive environments, we can assume that the marginal product of capital equals the cost of capital C. Therefore, the first-order condition for capital can be written as

Finally, and following human capital theory, we can assume that the marginal product of human capital equals the cost of employee education and training T. Therefore, the first-order condition for human capital can be written as

Combining these three expressions, we can obtain our employment demand function:

Alternatively, the labour productivity function can be expressed as
where the second equation terms −σ−1logR, −σ−1logI, and −σ−1logD, refer to the TFP based on technological changes (or TFP), and the first equation term σ logW/P refers to labour deepening. When the elasticity of the substitution between labour, capital, and human capital is low (σ<1) and for the given real wages, labour productivity increases in R, I, and D. Consequently, employment decreases as long as output (the given level of production) and real wages remain constant. The decrease in employment occurs because the increase in R, I, and D implies that less labour is necessary to achieve a given level of labour services (RN), (IN), and (DN) because the low degree of substitution between labour, capital, and human capital implies a small increase in the use of labour services. By contrast, when the elasticity of substitution is high (σ>1), labour productivity decreases in R, I, and D (for given real wages), and employment increases (for given Q). The reason for this is that the decrease in R, I, and D implies that more labour is necessary to achieve a given level of labour services (RN), (IN), and (DN), and due to the shift from capital services to labour services, more labour is necessary to achieve a given level of labour services.
We follow Eq. (5) and observe that for a given level of capital and human capital, the real wages and user cost of capital, human capital, and employment increases in R, I, and D if the elasticity of substitution is high (σ>1), but decreases if the elasticity of substitution is low (σ<1). Therefore, the implications of robotisation, innovation, and digitisation on employment are equal to the case of a given level of production (Eq. 6). Empirical evidence supports that the value of σ is below 1 in the case of robotisation (León-Ledesma, McAdam, & Willman, 2010) and above 1 in the case of innovation (Harrison, Jaumandreu, Mairesse, & Peters, 2014).
Thus, we can conclude that for a given capital and human capital stock and for a given output stock (i.e. in the short term), the impact of robotisation, innovation, and digitisation on productivity or employment depends on the size of the elasticity of the substitution between labour, capital, and human capital. However, in the long term, output and capitals are endogenous. Thus, it is possible to expect that robotisation, innovation, and digitisation would reduce the marginal costs of production, which could encourage investment, productivity, and output. Depending on the elasticity of demand, this improvement in economic activity could increase employment in the long term. Hence, although robotisation, innovation, and digitisation tend to reduce employment in the short term, this trend may reverse in the long term (Acemoglu & Restrepo, 2019; Autor & Salomons, 2018). If the increase in output is sufficiently high, the net long-term effect of robotisation, innovation, and digitisation on employment could be positive. In this sense, we propose Hypotheses 1 and 2:H1 Robotisation, innovation, and digitisation increase labour productivity in the long term (ie: non-given capitals or non-given output stock). This hypothesis only requires that the elasticity of substitution between labour, capital, and human capital is below 1. Robotisation, innovation, and digitisation increase employment in the long run. This hypothesis suggests significant employment creation in the long term, which would compensate for the short-term reduction in jobs.
However, as in the first digital wave where a clear link was established between intangible assets, such as human capital and workplace innovation, both with ICT uses (Acosta, Sainz, & Salvador, 2006; Venturini, 2015), we expect the use of robotics to link with the types of firm knowledge flows. Therefore, and extending our model, we also aim to evaluate the complementarity effects of robotisation, innovation, and digitisation on firm productivity and employment. The conditions of (long-term) flexibility of output, capitals, real wages, and user costs of capital and human capital are established as in the previous model. Additionally, we expect that the complementarity effect of robotisation, innovation, and digitisation reduces the marginal costs of production, reinforces productivity, and increases the demand of a firm’s output. In this positive situation, the displacing effect on employment in the short term would be clearly accelerated by the increases in output and human capital over the long term (Brynjolfsson, Rock, & Syverson, 2018; Doraszelski & Jaumandreu, 2018). Thus, we propose Hypotheses 4 and 5:H3 The complementarity effect among robotisation, innovation, and digitisation strengthens productivity in the long term. The complementarity effect between robotisation, innovation, digitisation, and human capital increases employment in the long term.
We aim to estimate the relationship between robotisation, innovation, digitisation, labour productivity, and employment by using two types of models. The first model estimates the individual effects of unit labour cost, robotisation, innovation, and digitisation on productivity and employment (together with capital per worker and human capital). The second model estimates the complementarity effects of robotisation, innovation, and digitisation on productivity (together with the individual effect of unit labour cost) and the complementarity effects of robotisation, innovation, digitisation, and human capital on employment (together with the individual effects of unit labour cost and capital per worker).
As suggested in the model and the hypotheses, the productivity and employment effects of technology depend on the. Long-term effects are estimated in log levels. Firm differences in log levels reflect the differences in the productivity or employment explanatory variables over the long term. The stochastic form of equations of productivity (derived from Eq. 6) and employment (derived from Eq. 5) in the long term are


Lower case letters denote logs. Eqs (7) and (8) refer to the models of individual effects. πse and πsi are sector and size firm dummies. These dummies control for unobserved heterogeneity in the manufacturing sector and firm size. Rit, Iit, and Dit are the use of industrial robots, innovation activities, and digitisation, respectively, in firm i in period t. w−pit refers to the real labour unit cost. Capital (kit) and human capital (hit) are also captured. In Eq. (5), the uses of the cost of capital (log C) and the uses of the cost of human capital (log T) affect labour demand. However, where there are differences in the user cost of capital and human capital across manufacturing sectors or firm size, these factors are captured by the fixed effects. This phenomenon implies that their differences are constant over time. Additionally, uit and εit are white noise terms.
The Eqs (9),(10),(11),(12), and (13) refer to the models of complementarity effects. Eqs (9) and (10) depict the productivity and employment functions with two complementarity effects. Eqs (11) and (12) depict productivity and employment functions with the three-complementarity effects. Eq. (13) depicts an employment function with four-complementarity effects:


There are two-complementarity effects: RI (robotisation and innovation), RD (robotisation and digitisation), RH (robotisation and human capital), ID (innovation and digitisation), IH (innovation and human capital), and DH (digitisation and human capital). The three-complementarity effects are RID (robotisation, innovation, and digitisation), RIH (robotisation, innovation, and human capital), RDH (robotisation, digitisation, and human capital), and IDH (innovation, digitisation, and human capital). Finally, the four-complementarity effect in the employment equation is RIDH (robotisation, innovation, digitisation, and human capital).
The provision of annual series for an extended period allows the estimation of explanatory factors for the manufacturing firms’ long-term productivity and employment. Thus; thus, we elaborate the variables’ and indicators’ arithmetic average of the for the two established estimation periods. The first period is from 1991 to 2016. As a result of the progressive adaptation of the information source to the business context, we use a second estimation period from 2000 to 2016 that includes the indicators related to the manufacturing firms’ digitisation process.
The estimation of the hypothesised functions is conducted using ordinary least squares (OLS) with the introduction method. OLS regression should be used only if some standard requirements of the data are achieved, such as normality, linearity, and homoscedasticity (Hair et al., 2010). The skewness and kurtosis-obtained values in all the estimated models suggest that the variables can be assumed to be normally distributed (below the threshold of 2.58). Multicollinearity diagnoses have been addressed by testing the tolerance and variance inflation factor (VIF) among the explanatory variables. Because all these values have threshold tolerance=0.10 and VIF=10.0, multicollinearity may not be a concern in our regression models. The correlation matrices also indicate the absence of multicollinearity. Finally, homoscedasticity is visually examined and tested in plots of standardised residuals against the predicted value (Durbin-Watson test, 1.5<DW<2.5).
Information sourceThe information source used for the analysis is the ESEE, an annual survey of around 1800 Spanish manufacturing firms conducted by the Spanish Government’s Ministry of Finance and Public Administration from 1990 to 2016. ESSE provides detailed information on businesses in the areas of strategic decision-making (prices, costs, markets, and investment) and the value process (human capital, organisation, innovation, R&D, and ICT use). In addition, it covers the most important indicators and ratios from firms’ balance sheets and profit and loss accounts. Consequently, this panel data allows a detailed study of the microeconomics of productivity and employment, and the analysis of changes in Spanish manufacturing firms during various stages of the business cycle (Torrent-Sellens, 2018).
The ESEE contains segmented information for manufacturing firms with more than 200 workers (large firms) and firms with 10–200 workers (SMEs). As a result of the data collection, the classification of SMEs is different than that of the European Commission (European Commission, 2012). In the case of the ESEE, the limit used to define an SME is 200 employees, and the European Commission uses a maximum size of 250 workers. This difference is due to the sampling procedure used by the ESEE, in which all large manufacturing firms (more than 200 workers) are included in the sample. However, for SMEs (from 10 to 200 workers), stratified, proportional, and systematic sampling is used by industries (national economic activity two-digit classification code, NACE), and the size of the firm is also used. The sampling excludes manufacturing micro-firms (i.e. firms with less than 10 workers).
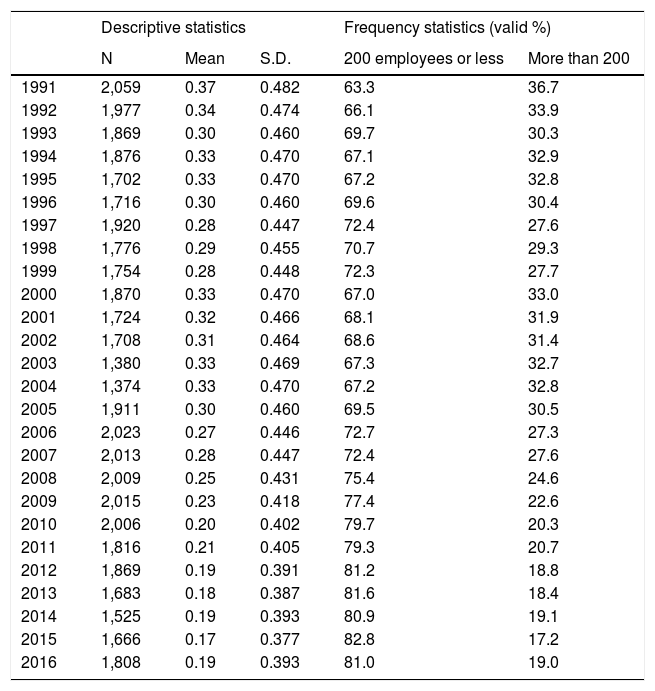
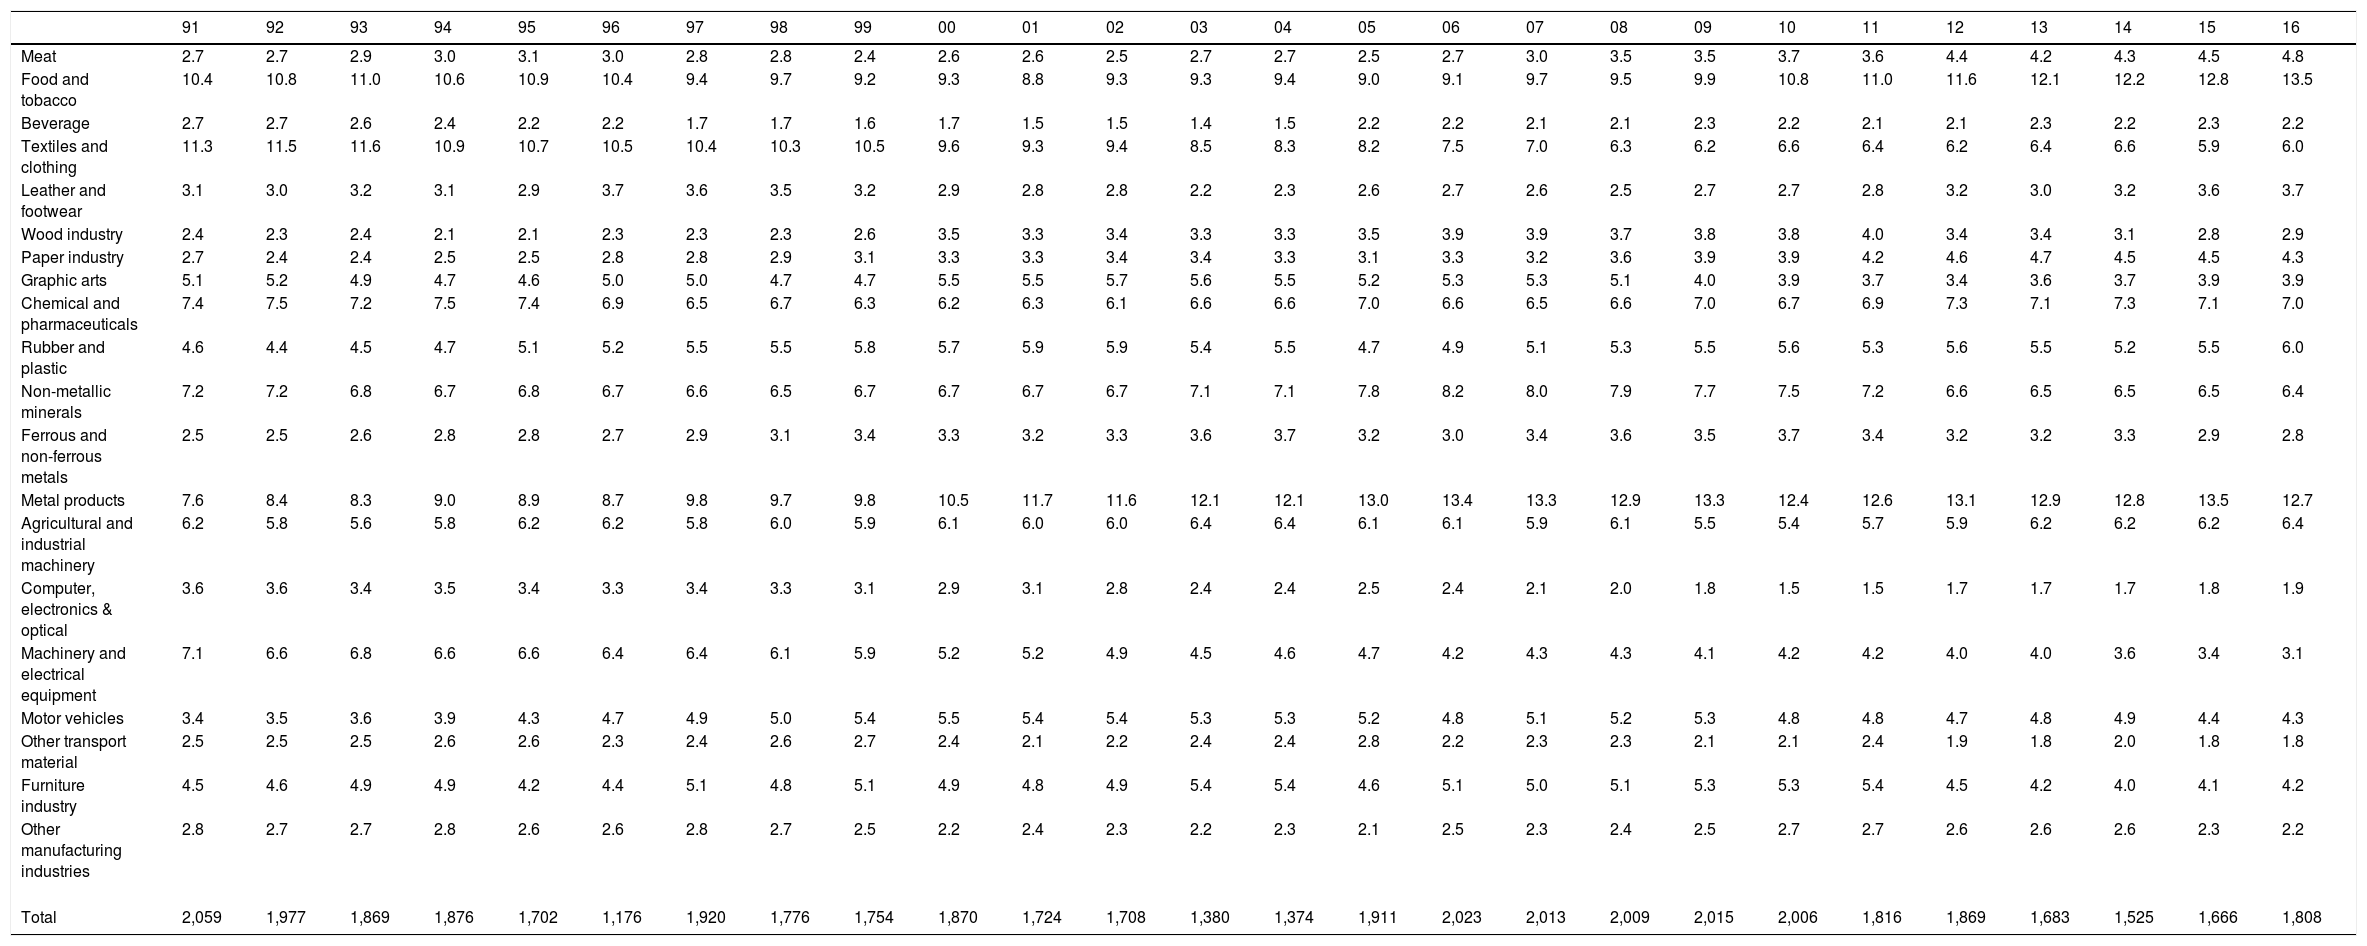
The ESEE also provides detailed information for 20 manufacturing branches of activity, which can be observed in detail in Appendix A (dimension: Table A1; and industries: Table A2) regarding the sample of firms used. The analysis of the panel data suggests a growing presence of smaller firms (from 63.3% of SMEs in 1991 to 81.0% of SME in 2016) and a notable reorientation of the industrial branches of activity. In 1991, six industries each accounted for more than 7% of the number of firms in the sample—textile and clothing (11.3%), food and tobacco (10.4%), metal products (7.6%), chemical and pharmaceuticals (7.4%), non-metallic mineral (7.2%), and machinery and electrical equipment (7.1%)—in 2016, specialisation had increased significantly and only three industries accounted for 7% or more of the total number of firms: food and clothing (13.5%), metal products (12.7%), and chemical and pharmaceuticals (7.0%).
Descriptive and frequency statistics (dimension: value 0, 200 employees or less; value 1, more than 200 employees) of the sample of Spanish manufacturing firms in 1991–2016.
| Descriptive statistics | Frequency statistics (valid %) | ||||
|---|---|---|---|---|---|
| N | Mean | S.D. | 200 employees or less | More than 200 | |
| 1991 | 2,059 | 0.37 | 0.482 | 63.3 | 36.7 |
| 1992 | 1,977 | 0.34 | 0.474 | 66.1 | 33.9 |
| 1993 | 1,869 | 0.30 | 0.460 | 69.7 | 30.3 |
| 1994 | 1,876 | 0.33 | 0.470 | 67.1 | 32.9 |
| 1995 | 1,702 | 0.33 | 0.470 | 67.2 | 32.8 |
| 1996 | 1,716 | 0.30 | 0.460 | 69.6 | 30.4 |
| 1997 | 1,920 | 0.28 | 0.447 | 72.4 | 27.6 |
| 1998 | 1,776 | 0.29 | 0.455 | 70.7 | 29.3 |
| 1999 | 1,754 | 0.28 | 0.448 | 72.3 | 27.7 |
| 2000 | 1,870 | 0.33 | 0.470 | 67.0 | 33.0 |
| 2001 | 1,724 | 0.32 | 0.466 | 68.1 | 31.9 |
| 2002 | 1,708 | 0.31 | 0.464 | 68.6 | 31.4 |
| 2003 | 1,380 | 0.33 | 0.469 | 67.3 | 32.7 |
| 2004 | 1,374 | 0.33 | 0.470 | 67.2 | 32.8 |
| 2005 | 1,911 | 0.30 | 0.460 | 69.5 | 30.5 |
| 2006 | 2,023 | 0.27 | 0.446 | 72.7 | 27.3 |
| 2007 | 2,013 | 0.28 | 0.447 | 72.4 | 27.6 |
| 2008 | 2,009 | 0.25 | 0.431 | 75.4 | 24.6 |
| 2009 | 2,015 | 0.23 | 0.418 | 77.4 | 22.6 |
| 2010 | 2,006 | 0.20 | 0.402 | 79.7 | 20.3 |
| 2011 | 1,816 | 0.21 | 0.405 | 79.3 | 20.7 |
| 2012 | 1,869 | 0.19 | 0.391 | 81.2 | 18.8 |
| 2013 | 1,683 | 0.18 | 0.387 | 81.6 | 18.4 |
| 2014 | 1,525 | 0.19 | 0.393 | 80.9 | 19.1 |
| 2015 | 1,666 | 0.17 | 0.377 | 82.8 | 17.2 |
| 2016 | 1,808 | 0.19 | 0.393 | 81.0 | 19.0 |
Frequency statistics (industries: branches of activity; valid percentages) of the sample of Spanish manufacturing firms in 1991–2016.
| 91 | 92 | 93 | 94 | 95 | 96 | 97 | 98 | 99 | 00 | 01 | 02 | 03 | 04 | 05 | 06 | 07 | 08 | 09 | 10 | 11 | 12 | 13 | 14 | 15 | 16 | |
|---|---|---|---|---|---|---|---|---|---|---|---|---|---|---|---|---|---|---|---|---|---|---|---|---|---|---|
| Meat | 2.7 | 2.7 | 2.9 | 3.0 | 3.1 | 3.0 | 2.8 | 2.8 | 2.4 | 2.6 | 2.6 | 2.5 | 2.7 | 2.7 | 2.5 | 2.7 | 3.0 | 3.5 | 3.5 | 3.7 | 3.6 | 4.4 | 4.2 | 4.3 | 4.5 | 4.8 |
| Food and tobacco | 10.4 | 10.8 | 11.0 | 10.6 | 10.9 | 10.4 | 9.4 | 9.7 | 9.2 | 9.3 | 8.8 | 9.3 | 9.3 | 9.4 | 9.0 | 9.1 | 9.7 | 9.5 | 9.9 | 10.8 | 11.0 | 11.6 | 12.1 | 12.2 | 12.8 | 13.5 |
| Beverage | 2.7 | 2.7 | 2.6 | 2.4 | 2.2 | 2.2 | 1.7 | 1.7 | 1.6 | 1.7 | 1.5 | 1.5 | 1.4 | 1.5 | 2.2 | 2.2 | 2.1 | 2.1 | 2.3 | 2.2 | 2.1 | 2.1 | 2.3 | 2.2 | 2.3 | 2.2 |
| Textiles and clothing | 11.3 | 11.5 | 11.6 | 10.9 | 10.7 | 10.5 | 10.4 | 10.3 | 10.5 | 9.6 | 9.3 | 9.4 | 8.5 | 8.3 | 8.2 | 7.5 | 7.0 | 6.3 | 6.2 | 6.6 | 6.4 | 6.2 | 6.4 | 6.6 | 5.9 | 6.0 |
| Leather and footwear | 3.1 | 3.0 | 3.2 | 3.1 | 2.9 | 3.7 | 3.6 | 3.5 | 3.2 | 2.9 | 2.8 | 2.8 | 2.2 | 2.3 | 2.6 | 2.7 | 2.6 | 2.5 | 2.7 | 2.7 | 2.8 | 3.2 | 3.0 | 3.2 | 3.6 | 3.7 |
| Wood industry | 2.4 | 2.3 | 2.4 | 2.1 | 2.1 | 2.3 | 2.3 | 2.3 | 2.6 | 3.5 | 3.3 | 3.4 | 3.3 | 3.3 | 3.5 | 3.9 | 3.9 | 3.7 | 3.8 | 3.8 | 4.0 | 3.4 | 3.4 | 3.1 | 2.8 | 2.9 |
| Paper industry | 2.7 | 2.4 | 2.4 | 2.5 | 2.5 | 2.8 | 2.8 | 2.9 | 3.1 | 3.3 | 3.3 | 3.4 | 3.4 | 3.3 | 3.1 | 3.3 | 3.2 | 3.6 | 3.9 | 3.9 | 4.2 | 4.6 | 4.7 | 4.5 | 4.5 | 4.3 |
| Graphic arts | 5.1 | 5.2 | 4.9 | 4.7 | 4.6 | 5.0 | 5.0 | 4.7 | 4.7 | 5.5 | 5.5 | 5.7 | 5.6 | 5.5 | 5.2 | 5.3 | 5.3 | 5.1 | 4.0 | 3.9 | 3.7 | 3.4 | 3.6 | 3.7 | 3.9 | 3.9 |
| Chemical and pharmaceuticals | 7.4 | 7.5 | 7.2 | 7.5 | 7.4 | 6.9 | 6.5 | 6.7 | 6.3 | 6.2 | 6.3 | 6.1 | 6.6 | 6.6 | 7.0 | 6.6 | 6.5 | 6.6 | 7.0 | 6.7 | 6.9 | 7.3 | 7.1 | 7.3 | 7.1 | 7.0 |
| Rubber and plastic | 4.6 | 4.4 | 4.5 | 4.7 | 5.1 | 5.2 | 5.5 | 5.5 | 5.8 | 5.7 | 5.9 | 5.9 | 5.4 | 5.5 | 4.7 | 4.9 | 5.1 | 5.3 | 5.5 | 5.6 | 5.3 | 5.6 | 5.5 | 5.2 | 5.5 | 6.0 |
| Non-metallic minerals | 7.2 | 7.2 | 6.8 | 6.7 | 6.8 | 6.7 | 6.6 | 6.5 | 6.7 | 6.7 | 6.7 | 6.7 | 7.1 | 7.1 | 7.8 | 8.2 | 8.0 | 7.9 | 7.7 | 7.5 | 7.2 | 6.6 | 6.5 | 6.5 | 6.5 | 6.4 |
| Ferrous and non-ferrous metals | 2.5 | 2.5 | 2.6 | 2.8 | 2.8 | 2.7 | 2.9 | 3.1 | 3.4 | 3.3 | 3.2 | 3.3 | 3.6 | 3.7 | 3.2 | 3.0 | 3.4 | 3.6 | 3.5 | 3.7 | 3.4 | 3.2 | 3.2 | 3.3 | 2.9 | 2.8 |
| Metal products | 7.6 | 8.4 | 8.3 | 9.0 | 8.9 | 8.7 | 9.8 | 9.7 | 9.8 | 10.5 | 11.7 | 11.6 | 12.1 | 12.1 | 13.0 | 13.4 | 13.3 | 12.9 | 13.3 | 12.4 | 12.6 | 13.1 | 12.9 | 12.8 | 13.5 | 12.7 |
| Agricultural and industrial machinery | 6.2 | 5.8 | 5.6 | 5.8 | 6.2 | 6.2 | 5.8 | 6.0 | 5.9 | 6.1 | 6.0 | 6.0 | 6.4 | 6.4 | 6.1 | 6.1 | 5.9 | 6.1 | 5.5 | 5.4 | 5.7 | 5.9 | 6.2 | 6.2 | 6.2 | 6.4 |
| Computer, electronics & optical | 3.6 | 3.6 | 3.4 | 3.5 | 3.4 | 3.3 | 3.4 | 3.3 | 3.1 | 2.9 | 3.1 | 2.8 | 2.4 | 2.4 | 2.5 | 2.4 | 2.1 | 2.0 | 1.8 | 1.5 | 1.5 | 1.7 | 1.7 | 1.7 | 1.8 | 1.9 |
| Machinery and electrical equipment | 7.1 | 6.6 | 6.8 | 6.6 | 6.6 | 6.4 | 6.4 | 6.1 | 5.9 | 5.2 | 5.2 | 4.9 | 4.5 | 4.6 | 4.7 | 4.2 | 4.3 | 4.3 | 4.1 | 4.2 | 4.2 | 4.0 | 4.0 | 3.6 | 3.4 | 3.1 |
| Motor vehicles | 3.4 | 3.5 | 3.6 | 3.9 | 4.3 | 4.7 | 4.9 | 5.0 | 5.4 | 5.5 | 5.4 | 5.4 | 5.3 | 5.3 | 5.2 | 4.8 | 5.1 | 5.2 | 5.3 | 4.8 | 4.8 | 4.7 | 4.8 | 4.9 | 4.4 | 4.3 |
| Other transport material | 2.5 | 2.5 | 2.5 | 2.6 | 2.6 | 2.3 | 2.4 | 2.6 | 2.7 | 2.4 | 2.1 | 2.2 | 2.4 | 2.4 | 2.8 | 2.2 | 2.3 | 2.3 | 2.1 | 2.1 | 2.4 | 1.9 | 1.8 | 2.0 | 1.8 | 1.8 |
| Furniture industry | 4.5 | 4.6 | 4.9 | 4.9 | 4.2 | 4.4 | 5.1 | 4.8 | 5.1 | 4.9 | 4.8 | 4.9 | 5.4 | 5.4 | 4.6 | 5.1 | 5.0 | 5.1 | 5.3 | 5.3 | 5.4 | 4.5 | 4.2 | 4.0 | 4.1 | 4.2 |
| Other manufacturing industries | 2.8 | 2.7 | 2.7 | 2.8 | 2.6 | 2.6 | 2.8 | 2.7 | 2.5 | 2.2 | 2.4 | 2.3 | 2.2 | 2.3 | 2.1 | 2.5 | 2.3 | 2.4 | 2.5 | 2.7 | 2.7 | 2.6 | 2.6 | 2.6 | 2.3 | 2.2 |
| Total | 2,059 | 1,977 | 1,869 | 1,876 | 1,702 | 1,176 | 1,920 | 1,776 | 1,754 | 1,870 | 1,724 | 1,708 | 1,380 | 1,374 | 1,911 | 2,023 | 2,013 | 2,009 | 2,015 | 2,006 | 1,816 | 1,869 | 1,683 | 1,525 | 1,666 | 1,808 |
The dependent variables are labour productivity and employment in manufacturing firms and are approximated by using the logarithm of added value per hour worked (HPT) and the logarithm of the total staff employed (all contracts) in the firm (EMPL).
To capture the use of robots (R), we use a dichotomous variable that is 0 when the firm does not use robots, and 1 when a firm uses robots. Despite the obvious restrictions of the use of a dichotomous variable, its incorporation into the predictive model allows us to assess the impact on firm productivity and employment when a firm starts to use industrial robotics.
Regarding innovation, we use two dichotomous variables that take two values (value 1, innovation generation; value 0, no innovation): product innovation (PROD_I) when the firm has produced totally new products or products with modifications that are so relevant that they make them different from those previously produced; and process innovation (PROC_I) when the firm has introduced some important modification into the production and/or distribution process.
Regarding digitisation, we built an additive indicator that reflects internet-based electronic commerce (D). This indicator takes four values (0–3) and is the result of the sum of three dichotomous variables (value 1, use; value 0, no use): purchases from suppliers over the internet (PFS_D), sales to end consumers over the internet (B2C_D), and sales to firms over the internet (B2B_D).
Real wages are approximated by using an indicator of labour costs per worker (LCW), the capital stock of the firm was approximated by using the logarithm of financial assets per worker (KPTW), and the human capital stock of the firm (HKPTW) is measured by using the logarithm of the percentage of employees with tertiary (university) education (bachelor’s degree level and higher).
To capture the effect of sectoral (πse) and size (πsi) dummies, we construct four additional variables that capture the non-observed heterogeneity in the models. From the average values of the productivity, exports, R&D expenditure, and proportion of employees with a university education, we construct four dichotomous variables that assign the value 1 to the manufacturing sectors when the values of productivity, exports, R&D spending, and university training of employees are above the average, and the value 0 in the alternative case. When we obtain these dichotomous variables, we multiply them by the firm size variable, which takes value 0 for firms with 200 employees or less on average in the reference period, and value 1 in the case of firms with more than 200 employees on average in the reference period.
As a result of these combinations, we obtain the following four variables: (1) LAR_EF (large and efficient firms) identifies large firms located in manufacturing sectors with above-average productivities; (2) LAR_EXP (large firms with export intensity) identifies large firms located in manufacturing sectors with above-average exporting values; (3) LAR_HC (large firms with intensity in human capital) identifies large firms located in manufacturing sectors with an above-average number of employees with a university education; and (4) SME_R&D (SMEs with R&D intensity) identifies small and medium-sized firms (SMEs) located in manufacturing sectors with above-average R&D expenditure.
All the variables and indicators expressed in nominal terms have been deflated by using a Paasche index referred to the variation in prices of intermediate consumption. This index has been built on two groups of goods: producer goods and energy and services acquired. Because we have no relative weights of producer goods and energy, we add a variation of these two components by using a geometric mean with fixed weights. Thus, the price index of intermediate consumption takes the following form:
where PIINTCON t is the price index of intermediate consumption in period t (to be calculated); VPGE t is the value of the purchases consumed in period t; VINTCON t is the value of the intermediate consumption in period t; PIPGEt is the price variation of producer goods and energy between t-1 and t obtained as PIPGEt= (PIPGt0,95x (PIEt0,5, where PIPG and PIE are the price indices of producer goods and energy provided by the firm; VSER t is the value of the services acquired in period t; and PISER is the price index of the services acquired in the period t-1 and t. Appendix B (Table B1) presents the descriptive statistics of the variables and indicators used in the analysis.
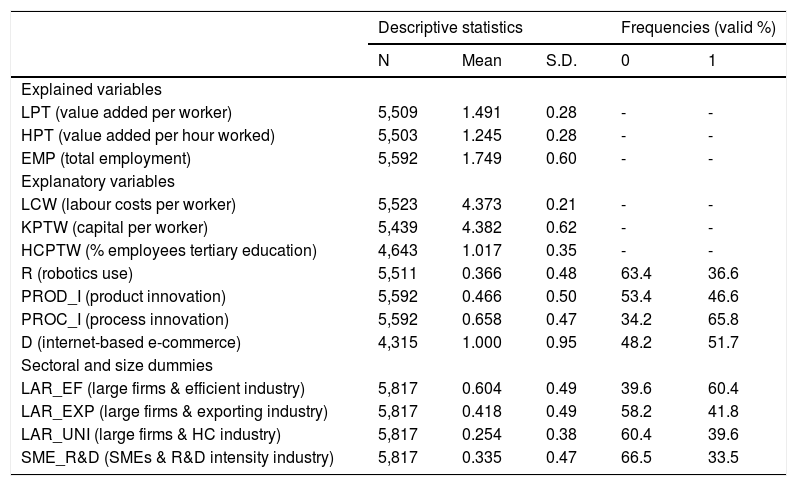
Descriptive and frequency statistics of the variables and analysis indicators in 1991–2016.
| Descriptive statistics | Frequencies (valid %) | ||||
|---|---|---|---|---|---|
| N | Mean | S.D. | 0 | 1 | |
| Explained variables | |||||
| LPT (value added per worker) | 5,509 | 1.491 | 0.28 | - | - |
| HPT (value added per hour worked) | 5,503 | 1.245 | 0.28 | - | - |
| EMP (total employment) | 5,592 | 1.749 | 0.60 | - | - |
| Explanatory variables | |||||
| LCW (labour costs per worker) | 5,523 | 4.373 | 0.21 | - | - |
| KPTW (capital per worker) | 5,439 | 4.382 | 0.62 | - | - |
| HCPTW (% employees tertiary education) | 4,643 | 1.017 | 0.35 | - | - |
| R (robotics use) | 5,511 | 0.366 | 0.48 | 63.4 | 36.6 |
| PROD_I (product innovation) | 5,592 | 0.466 | 0.50 | 53.4 | 46.6 |
| PROC_I (process innovation) | 5,592 | 0.658 | 0.47 | 34.2 | 65.8 |
| D (internet-based e-commerce) | 4,315 | 1.000 | 0.95 | 48.2 | 51.7 |
| Sectoral and size dummies | |||||
| LAR_EF (large firms & efficient industry) | 5,817 | 0.604 | 0.49 | 39.6 | 60.4 |
| LAR_EXP (large firms & exporting industry) | 5,817 | 0.418 | 0.49 | 58.2 | 41.8 |
| LAR_UNI (large firms & HC industry) | 5,817 | 0.254 | 0.38 | 60.4 | 39.6 |
| SME_R&D (SMEs & R&D intensity industry) | 5,817 | 0.335 | 0.47 | 66.5 | 33.5 |
Note: Real monetary data are in log levels. Frequencies of discrete variables in percentages. 0 = no robotic use, no innovation, no digitisation, or no relevance to sectoral and size dummies; 1 = robotics use, innovation, digitisation, or relevance to sectors and size dummies.
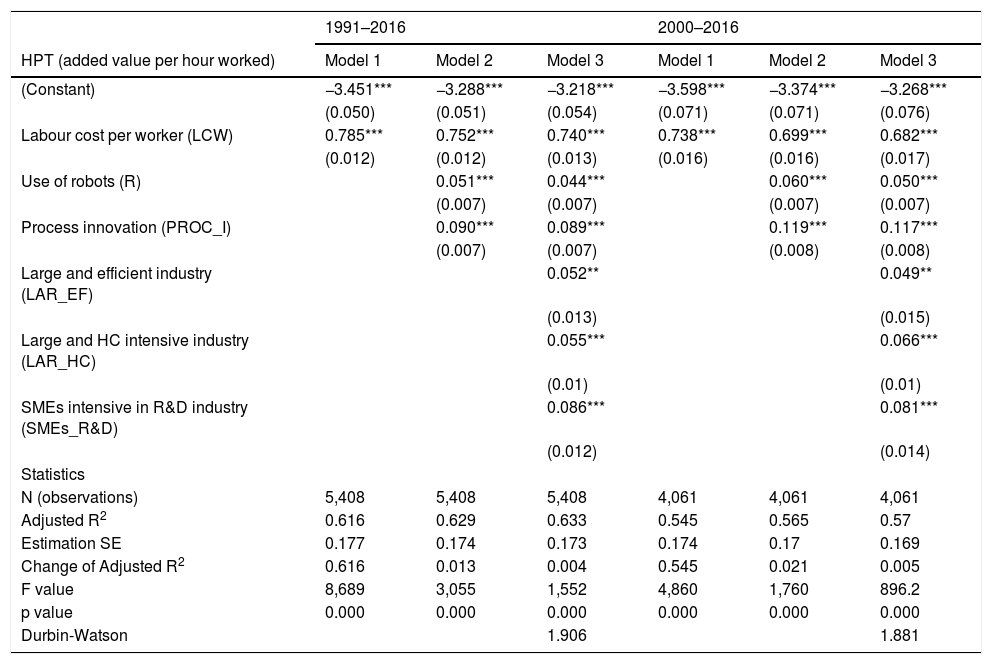
Table 1 presents the individual effects of estimating the long-term trend of productivity level (worked-hourly productivity, HPT). Consistent with Eq. 7, the first column (Model 1) analyses the effects of LCW on productivity. In the second column (Model 2), the effects of knowledge-based technology (robots and process innovation) are incorporated. In the third column (Model 3), size and industry dummies are also integrated.
Labour productivity (added value per hour worked, HPT), individual explanatory factors in Spanish manufacturing firms in 1991–2016 and 2000–2016.
| 1991–2016 | 2000–2016 | |||||
|---|---|---|---|---|---|---|
| HPT (added value per hour worked) | Model 1 | Model 2 | Model 3 | Model 1 | Model 2 | Model 3 |
| (Constant) | −3.451*** | −3.288*** | −3.218*** | −3.598*** | −3.374*** | −3.268*** |
| (0.050) | (0.051) | (0.054) | (0.071) | (0.071) | (0.076) | |
| Labour cost per worker (LCW) | 0.785*** | 0.752*** | 0.740*** | 0.738*** | 0.699*** | 0.682*** |
| (0.012) | (0.012) | (0.013) | (0.016) | (0.016) | (0.017) | |
| Use of robots (R) | 0.051*** | 0.044*** | 0.060*** | 0.050*** | ||
| (0.007) | (0.007) | (0.007) | (0.007) | |||
| Process innovation (PROC_I) | 0.090*** | 0.089*** | 0.119*** | 0.117*** | ||
| (0.007) | (0.007) | (0.008) | (0.008) | |||
| Large and efficient industry (LAR_EF) | 0.052** | 0.049** | ||||
| (0.013) | (0.015) | |||||
| Large and HC intensive industry (LAR_HC) | 0.055*** | 0.066*** | ||||
| (0.01) | (0.01) | |||||
| SMEs intensive in R&D industry (SMEs_R&D) | 0.086*** | 0.081*** | ||||
| (0.012) | (0.014) | |||||
| Statistics | ||||||
| N (observations) | 5,408 | 5,408 | 5,408 | 4,061 | 4,061 | 4,061 |
| Adjusted R2 | 0.616 | 0.629 | 0.633 | 0.545 | 0.565 | 0.57 |
| Estimation SE | 0.177 | 0.174 | 0.173 | 0.174 | 0.17 | 0.169 |
| Change of Adjusted R2 | 0.616 | 0.013 | 0.004 | 0.545 | 0.021 | 0.005 |
| F value | 8,689 | 3,055 | 1,552 | 4,860 | 1,760 | 896.2 |
| p value | 0.000 | 0.000 | 0.000 | 0.000 | 0.000 | 0.000 |
| Durbin-Watson | 1.906 | 1.881 | ||||
Note: Real monetary data are in log levels. Regression analysis: Ordinary least squares with the introduction method. Estimated coefficients: Standardised coefficients. Standard errors of the non-standardised effects are in brackets.
*** p<0.01; ** p<0.05; * p<0.1.
The use of industrial robots and process innovation result in a significant increase in labour productivity. These individual effects are robust (increases in the change of adjusted R2 and models p value=0.000) to the inclusion of LCW and size and industry dummies as explanatory variables, which is evident through column analysis. Both the unit labour cost and the size and industry dummies have significant impacts on the expected signs. However, the unit labour cost coefficient tends to decrease as we incorporate more variables into the regression (Models 2 and 3 compared to Model 1). In the same manner, the robotics use and process innovation coefficients tend to decrease when the size and industry dummies are incorporated (Model 3 compared to Model 2).
The reduction in the unit labour cost coefficient is related to the type of investment and efficiency model of the technology-based firms. Robotisation and process innovation implies a smaller effect of the labour cost in the productivity explanation, which already starts suggesting that there exists a labour-share-displacing effect. In the same manner, the introduction of size and industry dummies reflects the heterogeneity of the firm. Large firms in efficient and human capital-intensive industries and SMEs in R&D-intensive industries tend to be more efficient by themselves, reducing the effects of labour cost and technology on productivity.
The comparison of results between the two constructed data series: 1991–2016 and 2000–2016 capture the differential effects on productivity from the 2000s. For simplicity, we focus on the model that incorporates all the explanatory variables into the analysis (Model 3). The results obtained confirm the significant effects from robotisation and process innovation on productivity. From 1991 to 2016, the marginal effect on the worked-hourly productivity level of one more robotised firm is 0.044 percentage points, and an additional process-innovative firm boosted worked-hourly productivity by 0.089 percentage points. These results have accelerated since the 2000s. From 2000 to 2016, the marginal effect on worked-hourly productivity level of one more robotised firm is 0.050 percentage points, and an additional process-innovative firm boosted worked-hourly productivity by 0.117 percentage points. In addition, there is a greater labour-displacing effect. An additional real euro of labour cost per employee increased worked-hourly productivity by 0.682 percentage points between 2000 and 2016, compared to 0.740 percentage points in 1991–2106. Contrary to what we expected, digitisation (use of electronic commerce) had no significant effect on the productivity explanation (neither per worker nor per hour worked).
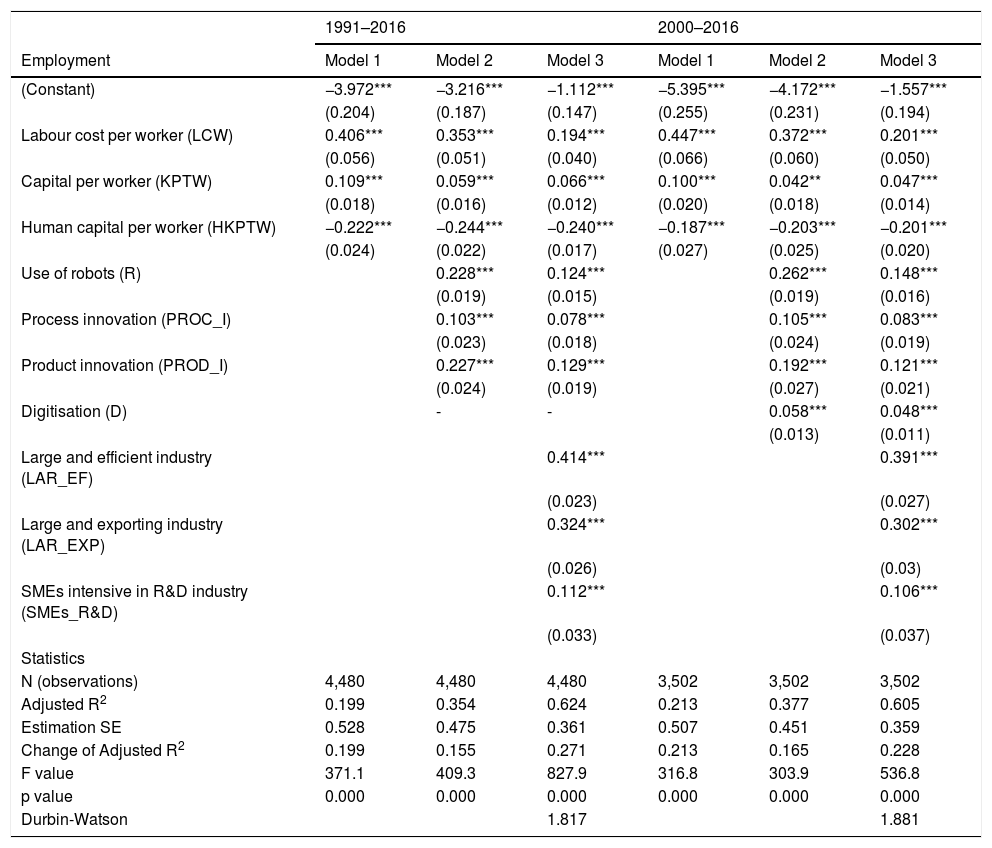
Table 2 presents the individual effects from estimating the long-term trend of the employment level. Unlike productivity, industrial employment has clearly evolved downwards during the periods analysed. Therefore, a positive coefficient implies a positive contribution to the declining trend of employment (i.e. a positive coefficient implies a decrease in employment), and a negative coefficient implies a negative contribution to the downtrend in employment (i.e. a negative coefficient implies an increase in employment). Consistent with Eq. 8, the first column (Model 1) analyses the effects of LCW, capital per worker (financial assets per employee), and human capital per worker (percentage of employees with tertiary education) on employment. In the second column (Model 2), the effects of knowledge-based technology (robotisation, innovation—product and process—and digitisation) are incorporated. In the third column (Model 3), size and industry dummies are also integrated.
Employment and individual explanatory factors in Spanish manufacturing firms in 1991–2016 and 2000–2016.
| 1991–2016 | 2000–2016 | |||||
|---|---|---|---|---|---|---|
| Employment | Model 1 | Model 2 | Model 3 | Model 1 | Model 2 | Model 3 |
| (Constant) | −3.972*** | −3.216*** | −1.112*** | −5.395*** | −4.172*** | −1.557*** |
| (0.204) | (0.187) | (0.147) | (0.255) | (0.231) | (0.194) | |
| Labour cost per worker (LCW) | 0.406*** | 0.353*** | 0.194*** | 0.447*** | 0.372*** | 0.201*** |
| (0.056) | (0.051) | (0.040) | (0.066) | (0.060) | (0.050) | |
| Capital per worker (KPTW) | 0.109*** | 0.059*** | 0.066*** | 0.100*** | 0.042** | 0.047*** |
| (0.018) | (0.016) | (0.012) | (0.020) | (0.018) | (0.014) | |
| Human capital per worker (HKPTW) | −0.222*** | −0.244*** | −0.240*** | −0.187*** | −0.203*** | −0.201*** |
| (0.024) | (0.022) | (0.017) | (0.027) | (0.025) | (0.020) | |
| Use of robots (R) | 0.228*** | 0.124*** | 0.262*** | 0.148*** | ||
| (0.019) | (0.015) | (0.019) | (0.016) | |||
| Process innovation (PROC_I) | 0.103*** | 0.078*** | 0.105*** | 0.083*** | ||
| (0.023) | (0.018) | (0.024) | (0.019) | |||
| Product innovation (PROD_I) | 0.227*** | 0.129*** | 0.192*** | 0.121*** | ||
| (0.024) | (0.019) | (0.027) | (0.021) | |||
| Digitisation (D) | - | - | 0.058*** | 0.048*** | ||
| (0.013) | (0.011) | |||||
| Large and efficient industry (LAR_EF) | 0.414*** | 0.391*** | ||||
| (0.023) | (0.027) | |||||
| Large and exporting industry (LAR_EXP) | 0.324*** | 0.302*** | ||||
| (0.026) | (0.03) | |||||
| SMEs intensive in R&D industry (SMEs_R&D) | 0.112*** | 0.106*** | ||||
| (0.033) | (0.037) | |||||
| Statistics | ||||||
| N (observations) | 4,480 | 4,480 | 4,480 | 3,502 | 3,502 | 3,502 |
| Adjusted R2 | 0.199 | 0.354 | 0.624 | 0.213 | 0.377 | 0.605 |
| Estimation SE | 0.528 | 0.475 | 0.361 | 0.507 | 0.451 | 0.359 |
| Change of Adjusted R2 | 0.199 | 0.155 | 0.271 | 0.213 | 0.165 | 0.228 |
| F value | 371.1 | 409.3 | 827.9 | 316.8 | 303.9 | 536.8 |
| p value | 0.000 | 0.000 | 0.000 | 0.000 | 0.000 | 0.000 |
| Durbin-Watson | 1.817 | 1.881 | ||||
Note: Real monetary data are in log levels. Regression analysis: Ordinary least squares with the introduction method. Estimated coefficients: Standardised coefficients. Standard errors of the non-standardised effects are in brackets.
*** p<0.01; ** p<0.05; * p<0.1.
The use of industrial robots, innovation, and digitisation significantly decreases the employment level (positive contribution to the downtrend in employment). These individual effects are robust (increases in the change of adjusted R2 and models p value=0.000) to the inclusion of LCW, capital per worker, human capital per worker, and size and industry dummies as explanatory variables. Both the unit labour cost and human capital per worker have significant impacts and with the expected signs: as labour cost increases, employment decreases; and tertiary education increases, employment increases. However, the capital per worker and the dummies do not behave as we expected: as the capital per worker increases, the employment decreases. Large firms in efficient and exporting industries and SMEs in R&D-intensive industries tend to be less labour-intensive.
We compare Model 1 with Model 2, and relevant considerations are obtained. In the explanation of the employment reduction, the coefficients of LCW and of capital per worker evolve downwards when the technological variables are incorporated into the analysis. Investment and use of technology displace the labour and capital returns, while an increase in the human capital indicates greater educational needs for a more appropriate use of technology. The comparison of Models 2 and 3 also provides relevant conclusions. The introduction of size and industry dummies reflects firm heterogeneity. Large firms in efficient and exporting industries and SMEs in R&D-intensive industries tend to be less labour-intensive by themselves, reducing the effects of labour cost, human capital, and technology on employment.
The comparison of the results obtained for the 1991–2016 and 2000–2016 intervals allows us to evaluate the explanatory factors of the observed destruction of employment and, more particularly, to analyse whether they have been accentuated since the 2000s. Regarding the technological dimension (Model 3), the results obtained confirm the significant and negative effects of robotisation, process, and product innovation and digitisation on employment. From 1991 to 2016, having one more robotised firm reduced employment levels (increased negative employment trend) by 0.124 percentage points, an additional process-innovative firm decreased employment by 0.078 percentage points, and an additional product-innovative firm decreased employment by 0.129 percentage points.
These results have accelerated since the 2000s. From 2000 to 2016, having one more robotised firm reduced employment levels by 0.148 percentage points, and an additional process-innovative firm lessened employment by 0.083 percentage points. By contrast, the contribution of product innovation fell slightly (0.121 percentage points). Additionally, and in the 2000–2016 interval, digitisation also reduced employment by 0.048 percentage points. There are also greater labour-displacing and human-capital-displacing effects, and a lower capital-displacing effect. An additional real euro of labour cost per employee decreased employment by 0.201 percentage points between 2000 and 2016, compared to 0.194 percentage points between 1991 and 2106. An additional employee with tertiary education increased employment by 0.201 percentage points in the 2000–2016 interval, compared to 0.240 percentage points in the 1991–2016 interval. An additional real euro of capital per worker decreased employment by 0.047 percentage points in the 2000–2016 interval, compared to 0.066 percentage points in the 1991–2016 interval.
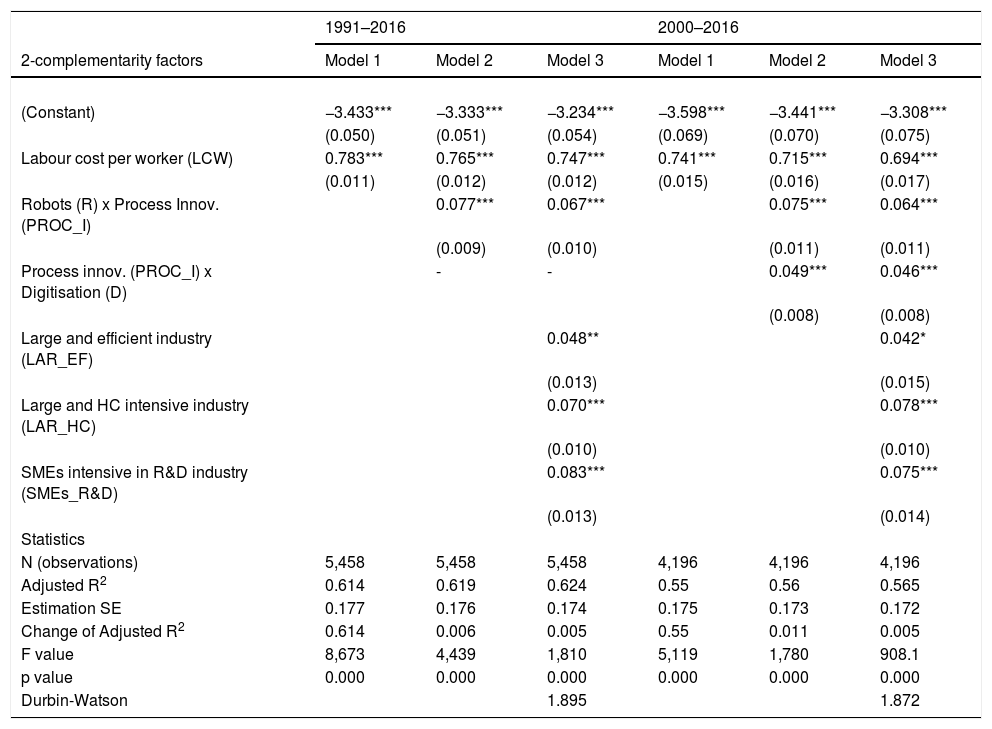
Complementarity effects on productivity and employment estimationsThe complementarity effects obtained from estimating the long-term trend of the productivity level (worked-hourly productivity, HPT) are presented in Table 3 (two-complementarities, Eq. 9) and Table 4 (three-complementarities, Eq. 11). As in the estimation of the individual effects, the first column (Model 1) analyses the effects of LCW on productivity. In the second column (Model 2), the effects of technology complementarities (robots, process innovation, and digitisation) are incorporated. In the third column (Model 3), size and industry dummies are also integrated.
Labour productivity (added value per hour worked, HPT) and two-complementarity explanatory factors in Spanish manufacturing firms in 1991–2016 and 2000–2016.
| 1991–2016 | 2000–2016 | |||||
|---|---|---|---|---|---|---|
| 2-complementarity factors | Model 1 | Model 2 | Model 3 | Model 1 | Model 2 | Model 3 |
| (Constant) | −3.433*** | −3.333*** | −3.234*** | −3.598*** | −3.441*** | −3.308*** |
| (0.050) | (0.051) | (0.054) | (0.069) | (0.070) | (0.075) | |
| Labour cost per worker (LCW) | 0.783*** | 0.765*** | 0.747*** | 0.741*** | 0.715*** | 0.694*** |
| (0.011) | (0.012) | (0.012) | (0.015) | (0.016) | (0.017) | |
| Robots (R) x Process Innov. (PROC_I) | 0.077*** | 0.067*** | 0.075*** | 0.064*** | ||
| (0.009) | (0.010) | (0.011) | (0.011) | |||
| Process innov. (PROC_I) x Digitisation (D) | - | - | 0.049*** | 0.046*** | ||
| (0.008) | (0.008) | |||||
| Large and efficient industry (LAR_EF) | 0.048** | 0.042* | ||||
| (0.013) | (0.015) | |||||
| Large and HC intensive industry (LAR_HC) | 0.070*** | 0.078*** | ||||
| (0.010) | (0.010) | |||||
| SMEs intensive in R&D industry (SMEs_R&D) | 0.083*** | 0.075*** | ||||
| (0.013) | (0.014) | |||||
| Statistics | ||||||
| N (observations) | 5,458 | 5,458 | 5,458 | 4,196 | 4,196 | 4,196 |
| Adjusted R2 | 0.614 | 0.619 | 0.624 | 0.55 | 0.56 | 0.565 |
| Estimation SE | 0.177 | 0.176 | 0.174 | 0.175 | 0.173 | 0.172 |
| Change of Adjusted R2 | 0.614 | 0.006 | 0.005 | 0.55 | 0.011 | 0.005 |
| F value | 8,673 | 4,439 | 1,810 | 5,119 | 1,780 | 908.1 |
| p value | 0.000 | 0.000 | 0.000 | 0.000 | 0.000 | 0.000 |
| Durbin-Watson | 1.895 | 1.872 | ||||
Note: Real monetary data are in log levels. Regression analysis: Ordinary least squares with the introduction method. Estimated coefficients: Standardised coefficients. Standard errors of the non-standardised effects are in brackets.
*** p<0.01; ** p<0.05; * p<0.1.
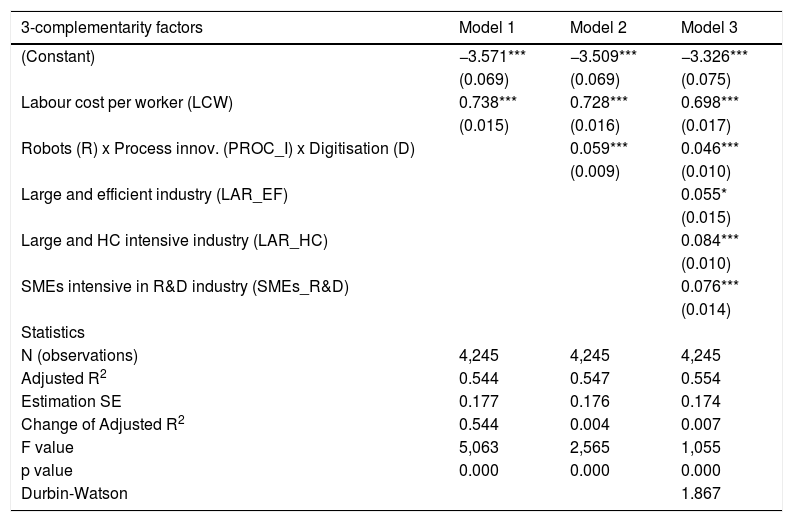
Labour productivity (added value per hour worked, HPT) and three-complementarity explanatory factors in Spanish manufacturing firms in 2000–2016.
| 3-complementarity factors | Model 1 | Model 2 | Model 3 |
|---|---|---|---|
| (Constant) | −3.571*** | −3.509*** | −3.326*** |
| (0.069) | (0.069) | (0.075) | |
| Labour cost per worker (LCW) | 0.738*** | 0.728*** | 0.698*** |
| (0.015) | (0.016) | (0.017) | |
| Robots (R) x Process innov. (PROC_I) x Digitisation (D) | 0.059*** | 0.046*** | |
| (0.009) | (0.010) | ||
| Large and efficient industry (LAR_EF) | 0.055* | ||
| (0.015) | |||
| Large and HC intensive industry (LAR_HC) | 0.084*** | ||
| (0.010) | |||
| SMEs intensive in R&D industry (SMEs_R&D) | 0.076*** | ||
| (0.014) | |||
| Statistics | |||
| N (observations) | 4,245 | 4,245 | 4,245 |
| Adjusted R2 | 0.544 | 0.547 | 0.554 |
| Estimation SE | 0.177 | 0.176 | 0.174 |
| Change of Adjusted R2 | 0.544 | 0.004 | 0.007 |
| F value | 5,063 | 2,565 | 1,055 |
| p value | 0.000 | 0.000 | 0.000 |
| Durbin-Watson | 1.867 |
Note: Real monetary data are in log levels. Regression analysis: Ordinary least squares with the introduction method. Estimated coefficients: Standardised coefficients. Standard errors of the non-standardised effects are in brackets.
*** p<0.01; ** p<0.05; * p<0.1.
The complementarities between industrial robots and process innovation and between process innovation and digitisation result in a significant increase in labour productivity. These complementarity effects are robust (increases in the change of adjusted R2 and models’ p value=0.000) to the inclusion of LCW and size and industry dummies as explanatory variables. Both the unit labour cost and the size and industry dummies have significant impacts and the expected signs. As in the case of individual effects, the two regressions’ model comparison suggests a labour-share-displacing effect and reflects firm heterogeneity. The unit labour cost coefficients tend to be reduced when incorporating technology-based complementarities and size and industry dummies (from Model 1 to Models 2 and 3). In the same manner, the coefficients of technological complementarities are reduced by introducing the dummies effect (from Model 2 to Model 3). In this sense, technological complementarities also introduce changes into the firm efficiency models, with lower contributions from the labour factor. Additionally, the location of the firm in large, efficient, and human-capital-intensive industries or in R&D-intensive SMEs also reduces the contribution of the labour factor and technology complementarities.
The comparison of the coefficients obtained for the two constructed data intervals (1991–2016 and 2000–2016) suggests two notable results. First, we can confirm the significant effects of two technological complementarities (between robotisation and process innovation, and between process innovation and digitisation) and three technological complementarities (between robotisation, process innovation, and digitisation) on productivity. From 1991 to 2016, having one more robotised and process-innovative firm increased worked-hourly productivity level by 0.067 percentage points. However, this complementarity has weakened since the 2000s. From 2000 to 2016, having one more robotised and process-innovative firm increased the worked-hourly productivity level by 0.064 percentage points.
By contrast, the complementarity between process innovation and digitisation has also contributed to the advance in productivity. From 2000 to 2016, having one more process-innovative and digitised firm increased worked-hourly productivity level by 0.046 percentage points. However, the introduction of robotisation to the two-complementarity effect between process innovation and digitisation did not improve the contribution to the productivity advance. The three-complementarity effect (robotisation, process innovation and digitisation) on productivity was 0.046 percentage points in the 2000–2016 interval (the same percentage as in the 1991–2016 interval).
The comparison between the individual and complementarity effects in the explanation of productivity suggests weak results in terms of the combination of technological factors. Considering two-complementarities and the 2000–2016 interval, the overall individual effect of robotisation and process innovation on productivity per hour worked was 0.167 percentage points, clearly above the complementarity effect (0.064). Likewise, the joint individual effect of process innovation and digitisation was 0.166 percentage points; again, well above the complementarity effect (0.046). Additionally, considering three-complementarities, the results obtained are still more differentiated. The overall individual effect of robotisation, process innovation, and digitisation on worked-hourly productivity was 0.216 percentage points in the 2000–2016 interval, and the complementarity effect was much lower (0.046).
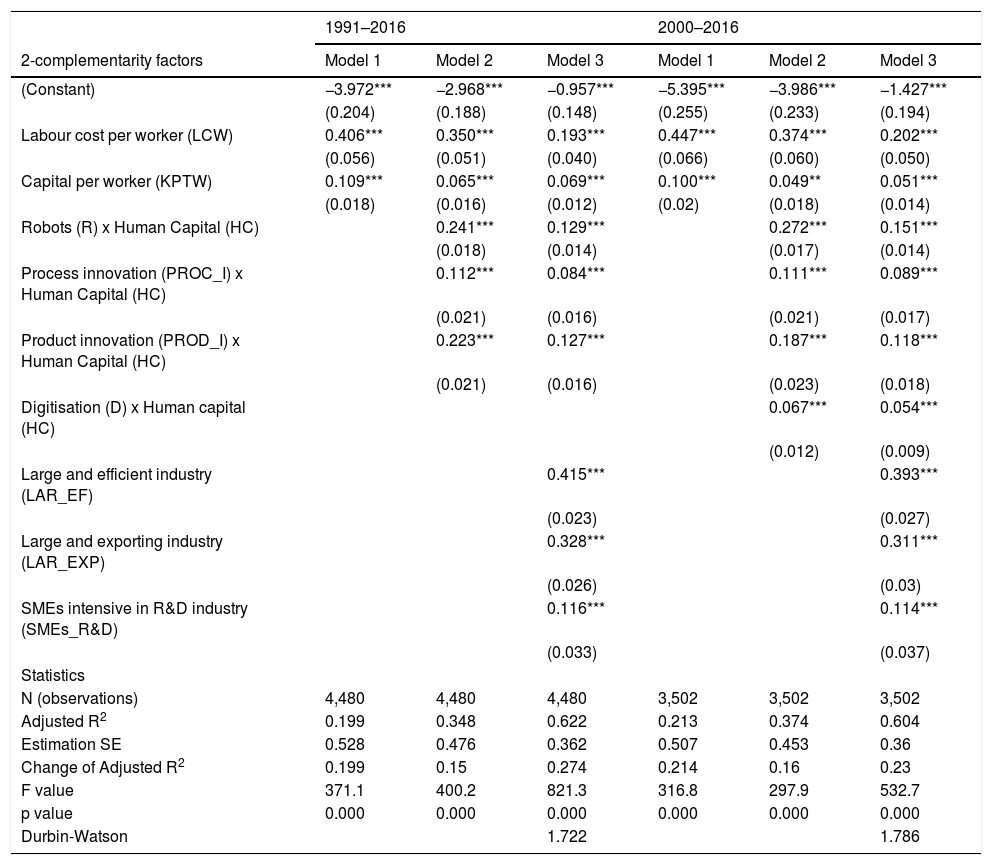
The complementarity effects from estimating the long-term trend of employment level are presented in Table 5 (two-complementarities, Eq. 10), Table 6 (three-complementarities, Eq. 12), and Table 7 (four complementarities, Eq. 13). As for the individual effects of employment estimation, the first column (Model 1) analyses the effects of LCW and capital per worker on employment. In the second column (Model 2), the effects of combined technology (robotisation, innovation –product and process– and digitisation) and human capital are incorporated. In the third column (Model 3), size and industry dummies are also integrated.
Employment and two-complementarity explanatory factors in Spanish manufacturing firms in 1991–2016 and 2000–2016.
| 1991–2016 | 2000–2016 | |||||
|---|---|---|---|---|---|---|
| 2-complementarity factors | Model 1 | Model 2 | Model 3 | Model 1 | Model 2 | Model 3 |
| (Constant) | −3.972*** | −2.968*** | −0.957*** | −5.395*** | −3.986*** | −1.427*** |
| (0.204) | (0.188) | (0.148) | (0.255) | (0.233) | (0.194) | |
| Labour cost per worker (LCW) | 0.406*** | 0.350*** | 0.193*** | 0.447*** | 0.374*** | 0.202*** |
| (0.056) | (0.051) | (0.040) | (0.066) | (0.060) | (0.050) | |
| Capital per worker (KPTW) | 0.109*** | 0.065*** | 0.069*** | 0.100*** | 0.049** | 0.051*** |
| (0.018) | (0.016) | (0.012) | (0.02) | (0.018) | (0.014) | |
| Robots (R) x Human Capital (HC) | 0.241*** | 0.129*** | 0.272*** | 0.151*** | ||
| (0.018) | (0.014) | (0.017) | (0.014) | |||
| Process innovation (PROC_I) x Human Capital (HC) | 0.112*** | 0.084*** | 0.111*** | 0.089*** | ||
| (0.021) | (0.016) | (0.021) | (0.017) | |||
| Product innovation (PROD_I) x Human Capital (HC) | 0.223*** | 0.127*** | 0.187*** | 0.118*** | ||
| (0.021) | (0.016) | (0.023) | (0.018) | |||
| Digitisation (D) x Human capital (HC) | 0.067*** | 0.054*** | ||||
| (0.012) | (0.009) | |||||
| Large and efficient industry (LAR_EF) | 0.415*** | 0.393*** | ||||
| (0.023) | (0.027) | |||||
| Large and exporting industry (LAR_EXP) | 0.328*** | 0.311*** | ||||
| (0.026) | (0.03) | |||||
| SMEs intensive in R&D industry (SMEs_R&D) | 0.116*** | 0.114*** | ||||
| (0.033) | (0.037) | |||||
| Statistics | ||||||
| N (observations) | 4,480 | 4,480 | 4,480 | 3,502 | 3,502 | 3,502 |
| Adjusted R2 | 0.199 | 0.348 | 0.622 | 0.213 | 0.374 | 0.604 |
| Estimation SE | 0.528 | 0.476 | 0.362 | 0.507 | 0.453 | 0.36 |
| Change of Adjusted R2 | 0.199 | 0.15 | 0.274 | 0.214 | 0.16 | 0.23 |
| F value | 371.1 | 400.2 | 821.3 | 316.8 | 297.9 | 532.7 |
| p value | 0.000 | 0.000 | 0.000 | 0.000 | 0.000 | 0.000 |
| Durbin-Watson | 1.722 | 1.786 | ||||
Note: Real monetary data are in log levels. Regression analysis: Ordinary least squares with the introduction method. Estimated coefficients: Standardised coefficients. Standard errors of the non-standardised effects are in brackets.
*** p<0.01; ** p<0.05; * p<0.1.
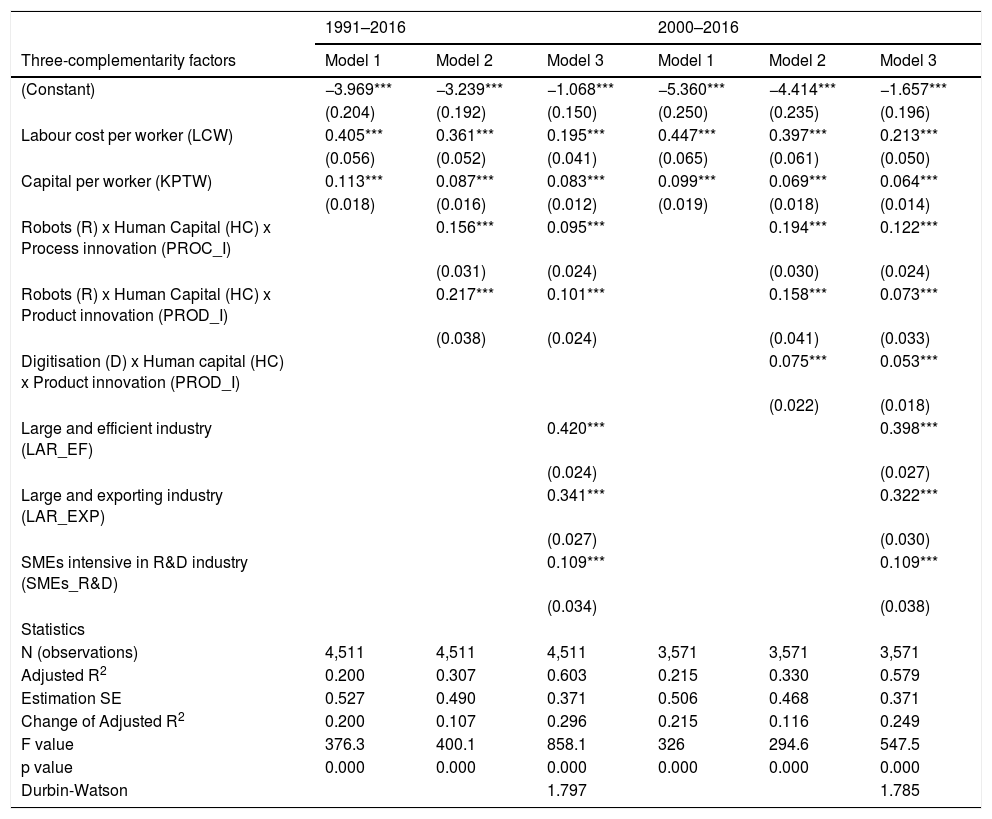
Employment and three-complementarity explanatory factors in Spanish manufacturing firms in 1991–2016 and 2000–2016.
| 1991–2016 | 2000–2016 | |||||
|---|---|---|---|---|---|---|
| Three-complementarity factors | Model 1 | Model 2 | Model 3 | Model 1 | Model 2 | Model 3 |
| (Constant) | −3.969*** | −3.239*** | −1.068*** | −5.360*** | −4.414*** | −1.657*** |
| (0.204) | (0.192) | (0.150) | (0.250) | (0.235) | (0.196) | |
| Labour cost per worker (LCW) | 0.405*** | 0.361*** | 0.195*** | 0.447*** | 0.397*** | 0.213*** |
| (0.056) | (0.052) | (0.041) | (0.065) | (0.061) | (0.050) | |
| Capital per worker (KPTW) | 0.113*** | 0.087*** | 0.083*** | 0.099*** | 0.069*** | 0.064*** |
| (0.018) | (0.016) | (0.012) | (0.019) | (0.018) | (0.014) | |
| Robots (R) x Human Capital (HC) x Process innovation (PROC_I) | 0.156*** | 0.095*** | 0.194*** | 0.122*** | ||
| (0.031) | (0.024) | (0.030) | (0.024) | |||
| Robots (R) x Human Capital (HC) x Product innovation (PROD_I) | 0.217*** | 0.101*** | 0.158*** | 0.073*** | ||
| (0.038) | (0.024) | (0.041) | (0.033) | |||
| Digitisation (D) x Human capital (HC) x Product innovation (PROD_I) | 0.075*** | 0.053*** | ||||
| (0.022) | (0.018) | |||||
| Large and efficient industry (LAR_EF) | 0.420*** | 0.398*** | ||||
| (0.024) | (0.027) | |||||
| Large and exporting industry (LAR_EXP) | 0.341*** | 0.322*** | ||||
| (0.027) | (0.030) | |||||
| SMEs intensive in R&D industry (SMEs_R&D) | 0.109*** | 0.109*** | ||||
| (0.034) | (0.038) | |||||
| Statistics | ||||||
| N (observations) | 4,511 | 4,511 | 4,511 | 3,571 | 3,571 | 3,571 |
| Adjusted R2 | 0.200 | 0.307 | 0.603 | 0.215 | 0.330 | 0.579 |
| Estimation SE | 0.527 | 0.490 | 0.371 | 0.506 | 0.468 | 0.371 |
| Change of Adjusted R2 | 0.200 | 0.107 | 0.296 | 0.215 | 0.116 | 0.249 |
| F value | 376.3 | 400.1 | 858.1 | 326 | 294.6 | 547.5 |
| p value | 0.000 | 0.000 | 0.000 | 0.000 | 0.000 | 0.000 |
| Durbin-Watson | 1.797 | 1.785 | ||||
Note: Real monetary data are in log levels. Regression analysis: Ordinary least squares with the introduction method. Estimated coefficients: Standardised coefficients. Standard errors of the non-standardised effects are in brackets.
*** p<0.01; ** p<0.05; * p<0.1.
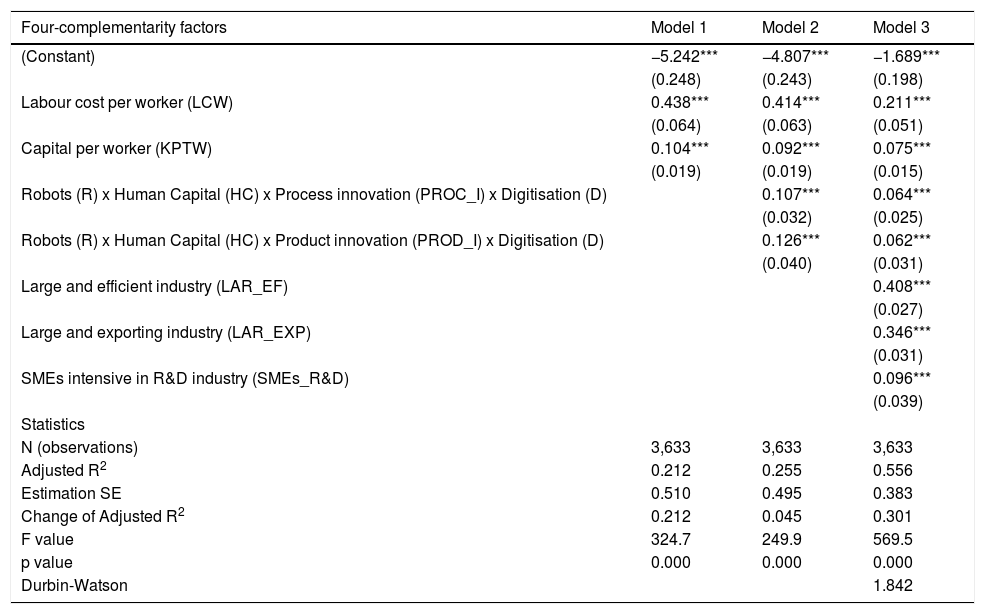
Employment and four-complementarity explanatory factors in Spanish manufacturing firms in 2000–2016.
| Four-complementarity factors | Model 1 | Model 2 | Model 3 |
|---|---|---|---|
| (Constant) | −5.242*** | −4.807*** | −1.689*** |
| (0.248) | (0.243) | (0.198) | |
| Labour cost per worker (LCW) | 0.438*** | 0.414*** | 0.211*** |
| (0.064) | (0.063) | (0.051) | |
| Capital per worker (KPTW) | 0.104*** | 0.092*** | 0.075*** |
| (0.019) | (0.019) | (0.015) | |
| Robots (R) x Human Capital (HC) x Process innovation (PROC_I) x Digitisation (D) | 0.107*** | 0.064*** | |
| (0.032) | (0.025) | ||
| Robots (R) x Human Capital (HC) x Product innovation (PROD_I) x Digitisation (D) | 0.126*** | 0.062*** | |
| (0.040) | (0.031) | ||
| Large and efficient industry (LAR_EF) | 0.408*** | ||
| (0.027) | |||
| Large and exporting industry (LAR_EXP) | 0.346*** | ||
| (0.031) | |||
| SMEs intensive in R&D industry (SMEs_R&D) | 0.096*** | ||
| (0.039) | |||
| Statistics | |||
| N (observations) | 3,633 | 3,633 | 3,633 |
| Adjusted R2 | 0.212 | 0.255 | 0.556 |
| Estimation SE | 0.510 | 0.495 | 0.383 |
| Change of Adjusted R2 | 0.212 | 0.045 | 0.301 |
| F value | 324.7 | 249.9 | 569.5 |
| p value | 0.000 | 0.000 | 0.000 |
| Durbin-Watson | 1.842 |
Note: Real monetary data are in log levels. Regression analysis: Ordinary least squares with the introduction method. Estimated coefficients: Standardised coefficients. Standard errors of the non-standardised effects are in brackets.
*** p<0.01; ** p<0.05; * p<0.1.
The complementarity effects of the use of industrial robots, innovation, digitisation, and human capital significantly decrease the employment level (positive contribution to the downtrend in employment). These individual effects are robust (increases in the change of adjusted R2 and models p value=0.000) to the inclusion of LCW, capital per worker, and size and industry dummies as explanatory variables. In the explanation of the employment reduction, the coefficients of LCW and of capital per worker evolve downwards when the technological and human capital complementarities are incorporated into the analysis (from Model 1 to Model 2). Technological and human capital complementarities seem to displace labour and capital returns. Similarly, the introduction of the size and industry dummies reflects firm heterogeneity. Large firms in efficient and exporting industries and SMEs in R&D-intensive industries tend to be less labour-intensive by themselves, reducing the effects of labour cost and technological and human capital complementarities on employment.
Regarding two-complementarity effects (Model 3 in Table 8), the results obtained confirm the significant and negative effects of robotisation and human capital, process innovation and human capital, product innovation and human capital, and digitisation and human capital on employment. From 1991 to 2016, more robotised and human capital-intensive (employees with tertiary education) firms reduced employment levels (increased negative employment trend) by 0.129 percentage points, an additional process-innovative and human capital-intensive firm decreased employment by 0.084 percentage points, and an additional product-innovative and human capital-intensive firm decreased employment by 0.127 percentage points.
These results have accelerated from 2000 to 2016. Having one more robotised and human capital-intensive firm reduced employment levels by 0.151 percentage points, and an additional process-innovative and human capital-intensive firm decreased employment by 0.089 percentage points. By contrast, the contribution of product innovation and human capital decreased (0.118 percentage points). Additionally, and in the 2000–2016 interval, two-complementarity effects between digitisation and human capital also reduced employment by 0.054 percentage points. There was also a greater labour-displacing and a lower capital-displacing effect. An additional real euro of labour cost per employee decreased employment by 0.202 percentage points between 2000 and 2016, compared to 0.193 percentage points in 1991–2016. An additional real euro of capital per worker decreased employment by 0.051 percentage points in the 2000–2016 interval, compared to 0.069 percentage points in the 1991–2016 interval.
The results related to the three-complementarity and four-complementarity effects (Model 3 in Tables 6 and 7) and are in line with those obtained in the two-complementarity analysis. The complementarity effect between robotisation, process innovation, and human capital reduced employment increasingly (from 0.095 percentage points in the 1991–2016 interval to 0.122 percentage points in the 2000–2016 interval), whereas the interaction between robotisation, product innovation, and human capital behaved inversely, with a lower contribution to the employment downtrend (from 0.101 percentage points in the 1991–2016 interval to 0.073 percentage points in the 2000–2016 interval). Finally, the triple interaction between digitisation, product innovation, and human capital also contributed to the downward trend in employment (0.053 percentage points in the 2000–2016 interval). Four-complementarity effects between robotisation, human capital, digitisation, and process innovation (0.064 percentage points in 2000–2016) and between robotisation, human capital, digitisation, and product innovation (0.062 percentage points in 2000–2016) evolved along the same lines. In addition, three-complementarity and four-complementarity effects are completed with a greater labour-displacing and a lower capital-displacing effect.
The comparison between the individual and complementarity effects in the explanation of employment also suggests weak results in terms of the combination of technological and human capital factors. Considering two-complementarities and the 2000–2016 interval, the joint individual effects of robotisation and human capital (0.053 percentage points), process innovation and human capital (0.118 percentage points), product innovation and human capital (0.080 percentage points), and digitisation and human capital (0.153 percentage points) increased employment, and the two-complementarity effects of robotisation and human capital (0.151 percentage points), process innovation and human capital (0.089 percentage points), product innovation and human capital (0.118 percentage points), and digitisation and human capital (0.054 percentage points) reduced employment.
Likewise, the effects of three-complementarity effects on employment are also clearly lower than the joint individual effects in the 2000–2016 interval. The complementarity effect of robotisation, human capital, and process innovation is 0.122 percentage points, an employment reduction effect clearly superior to that of its three joint individual effects (0.003 percentage points). The complementarity effect of robotisation, human capital, and product innovation is 0.073 percentage points, slightly higher than the effect of its three joint individual effects (0.068 percentage points). Finally, the complementarity effect of digitisation, human capital, and product innovation is 0.053 percentage points, clearly worse than the sum of its individual effects (employment increase of 0.005 percentage points).
We found a less negative result for the complementarity effects only in the complete interaction of all technological factors with human capital. From 2000 to 2016, the four-complementarity effect between robotisation, process innovation, digitalisation, and human capital generated a reduction in employment of 0.064 percentage points, lower than the sum of its four individual effects (0.078 percentage points). Likewise, the four-complementarity effect between robotisation, product innovation, digitisation, and human capital generated a reduction in employment of 0.062 percentage points, much lower than the reduction obtained for the sum of its four individual effects (0.116 percentage points).
DiscussionThis study analyses the relationship between robotisation and digitisation in explaining productivity and employment in the business sector. With that aim, we designed a heterogeneity-knowledge-based firm model with three perfect substitutable inputs (labour, capital, and human capital) and with three technologies (robotisation, innovation, and digitisation) to explain the long-term trends of labour productivity and employment. Our four hypotheses were empirically tested by using a large sample of 5511 Spanish manufacturing firms in the intervals of 1991–2016 and 2000–2016. Our aim was to capture the differential effects on productivity and employment since the 2000s. We contrasted the explanatory factors of productivity and employment by using two types of models. The first model estimated the individual effects and the second model estimated the complementarity effects.
Regarding individual effects, the results obtained confirm the significant and growing effects of robotisation and process innovation on productivity since the 2000s. Contrary to what we expected, digitisation has no significant effect on the productivity explanation. The specific uses of electronic commerce, still very oriented to the relationship with suppliers and customers, would not have transferred all their potential effects to the improvement of the level of productivity. In addition, since 2000 there has also been a greater labour-displacing effect on productivity. By contrast, our results confirm the significant and negative effects of robotisation, process and product innovation, and digitisation on employment. The negative effects of robotisation and process innovation have accelerated since the 2000s. In addition, there are also greater labour-displacing and human-capital-displacing effects and a lower capital-displacing effect on employment.
These results confirm Hypothesis 1 but reject Hypothesis 2, are in accordance with international evidence (Acemoglu & Restrepo, 2019; Autor & Salomons, 2018; Dauth, Findeisen, Südekum, & Woessner, 2017), and suggest a relevant conclusion. The Spanish manufacturing industry has not been able to compensate in the long term for the labour-reducing effects generated by automation technologies in the short term. Despite labour cost savings, capital accumulation, and productivity-augmenting effects, the weakness of the compensatory effect of the long-term trend of employment can be explained in several ways. First, it can be explained by the productivity model in the manufacturing firms, which tends to underutilise the competitive potential of technology. Firm location reduces the explanatory potential of automation technologies on productivity. Robotisation and process innovation reduce their contribution to productivity when the dummies related to large firms in efficient and human capital-intensive industries and SMEs located in R&D-intensive industries are introduced. This finding determines a long path of productivity improvement for firms, especially for the large group of non-R&D-intensive SMEs. Thus, a further topic of research is to study the role that robotisation, digitisation, and innovation complementarities play in the explanation of productivity divergences, especially in the case of industrial SMEs.
Second, it can be explained by employment structure and demand incentives. Automation technologies generate a counterbalanced effect on the labour factor in the employment explanation. Although they increase the importance of human capital, they reduce the unit labour cost coefficient. The need for more trained employees that would receive reduced salaries would explain the weakness of the compensation mechanisms.
Regarding the complementarity effects, the study confirms weak results in terms of the automation technology factors combination. The two-complementarity and three-complementarity effects of robotisation, process innovation, and digitisation on productivity and the two-complementarity and three-complementarity effects of robotisation, human capital, process innovation, and digitisation on employment are much worse than their joint individual effects. These results, which confirm Hypothesis 3 but reject Hypothesis 4, are in accordance with the new international evidence (Brynjolfsson et al., 2018; Seamans & Raj, 2018), which highlights the need to establish complementarity relationships, especially with intangible assets, to consolidate automation technologies as a general purpose technology
Again, the efficiency model of the manufacturing firms and their employment structure explain the weakness of the employment transition mechanism when complementarity effects are operating. First, we are surprised by the modest evolution of robotisation and innovation since the economic crisis. Stating in the 2000s, the number of product-innovative and process-innovative firms has decreased, and the number of robotised firms does not reach 40% of the total. Unfortunately, we have no information on the density or performance of the robots used or on the process and product innovation intensity, but their implementation dynamic clearly limits firms’ competitive potential. Second, localisation effects again restrict the productivity potential of the complementarity factors. In this sense, manufacturing SMEs not located in R&D-intensive sectors are especially sensitive to productivity improvements through technological complementarities. Third, automation-complementarity technologies generate a labour-displacing effect on the employment explanation. The lower weight of labour compensation explains the compensation mechanism weakness from the employees’ demand incentives. A valuable line of further research would be to introduce indicators of internal and external expenditure on training and analyse different training modalities.
ConclusionWe prove the existence of long-term productivity-augmenting and labour-reducing effects as a result of the implementation of automation technologies (robotisation, digitisation, and innovation) in Spanish manufacturing firms. In this sense, and despite labour cost savings, capital accumulation, and productivity-augmenting effects, manufacturing firms have not been able to compensate in the long term for the labour-reducing effects generated in the short term. Therefore, an incomplete employment compensatory effect has been detected. Although there are many reasons for this compensatory weakness, they are related to mainly a productivity model that underestimates the competitive potential of automation technology and a structure of employment that—despite improvements in human capital—reduces LCW.
Against this background, strategic management and public policy should lead efforts to transform firms’ competitiveness models, human capital, and industrial relations into models that emphasise automation skills. The main objective is to increase and develop automation technology uses to more effectively transfer productivity improvements to the labour market. First, it is important to consider the whole set of complementarities that automation technologies can establish among themselves. As the results of our research demonstrate, and despite being negative, in the employment explanation, the only complementarity relations that improve the sum of the individual effects are the set of four complementarities between robotisation, innovation, digitisation, and human capital. In this sense, a possible way to avoid the increasing dispersion of productivity and improve the long-term weakness of the employment compensatory effect is to consider all possible technological complementarities. Second, it is also important to consider the set of knowledge spillover effects generated by automation-based technologies on firm productivity and employment. Partial public policies or manager actions could be clearly counter-productive. For example, promoting second-wave digital transformation processes, such as investment in robotics, without seizing the capitalisation, training, and innovation mechanisms linked to them, could also lead to unexpected results.
María Teresa Ballestar and Ester Camiña gratefully acknowledge the support of the Organización de Estados Iberoamericanos under grant IIEYP-OEI-2020/02/0005 and the Spanish Ministry of Economy and Competitiveness under grant ECO2016-76818-C3-3-P respectively.