


Accurate business failure prediction represents an advantage for market players and is important for risk management. The purpose of this study is to develop a more accurate and stable business failure prediction model by using a majority voting ensemble method with a decision tree (DT) with experimental data on US restaurant between 1980 and 2017. According to the diversity principle and individual optimized principle, DT and logit were selected as basic learning algorithms for the voting ensemble of business failure prediction. Three models, including an entire period (EP) model, an economic downturn (ED) model, and an economic expansion (EE) model, were developed by using WEKA 3.9. The prediction accuracy of the models were 88.02% for the EP model, 80.81% for the ED model, and 87.02 % for the EE model. While the EE model revealed the market capitalization, operating cash flow after interest and dividends (OCFAID), cash conversion cycle (CCC), return on capital employed (ROCE), accumulated retained earnings, stock price, and Tobin’s Q as significant variables, the ED model exposed quite different variables such as OCFAID, KZ index, stock price, and CCC. The EP model combined most of the variables from two sub-divided models except for Tobin’s Q, stock price, and debt to equity (D/E) ratio. The contribution of the paper is twofold. First, this is the first study to comprehensively evaluate the financial and market-driven variables in the context of predicting restaurant failure, especially during economic recessions. This research has employed several accounting-based measures, market-based variables, and a macro-economic factor to improve the relevance and effectiveness of prediction models. And second, by using an ensemble model with a DT, it has improved both the interpretability of the results and the prediction accuracy.
Evaluating the financial health of a firm and assessing its business failure risk are of great interest to stakeholders such as creditors, investors, managers, and government. Accurate business failure prediction represents an advantage for market players and is important for risk management. More precisely, business failure prediction is crucial to the analysis of cash flows, investment budgets, financial markets, the development of the industry, and integrated national economic planning.
The United States is the largest market in terms of consumer restaurant spending. Almost one quarter of consumer spending in the industry was attributable to the US market in 2016 (Lock, 2018). Food and beverage sales in the United States are expected to grow from 379 billion US dollars in 2000 to 825 billion US dollars in 2019 and this is equivalent to 4% of the U.S. gross domestic product (NRA, 2019). Even though the U.S. economy experienced the record 120-month 1991–2001 expansion, U.S. economic growth is possibly expected to slow moderately in the next one or two years (Davies, 2018). The amount of money that consumers have spent on food continues to shrink (Carbonara, 2018), some U.S. restaurant sectors are in decline, and U.S.-based famous restaurant chains such as Applebee’s, Chilis, Buffalo Wild Wings, Hooters, TGI Friday’s, Subway, and Outback Steakhouse, are struggling as a result (Lafuente & Stice, 2017). Applebee’s stock decreased sharply 40% in 2017, while they closed 46 restaurants in 2016, 99 in 2017, and another 60–80 in 2018; Buffalo Wild Wings was purchased by Arby's for 2.9 billion in U.S. dollars; and Ruby Tuesday reported a revenue drop of 12.8 % as of August 2017. Therefore, there is a definite need for the restaurant industry to have a defined business-failure prediction model especially, for economic recessions.
In terms of prediction methodology, many different approaches, including neural network (NN), support vector machine (SVM), decision tree (DT), logistic regression (logit), and multivariate discriminant analysis (MDA) have been widely applied to business failure prediction. In the above individual models, it is difficult to say that the accuracy of one specific model is consistently better than that of another model in all circumstances. In most situations, the performance of these individual models is problem dependent (Dragos et al., 2008). Many researchers have realized the limitation of single classifier, because the performance of a single classifier for a specific problem depends on the sample’s pattern characteristics to some extent and each single classifier has its own uncertainty (Balcaen & Ooghe, 2006; Grice & Dugan, 2010; Lee, Chiu, Chou, & Lu, 2006; Peat, 2008). It is also argued that an individual model may not be able to capture the different features in the data because of the complex nature of the time series (Amore, Boubaker, & Belkacem, 2018), so no method is best for all situations. In fact, in most cases of business failure prediction, it is difficult to obtain a full information set. And even for a given information set, it is still hard to construct a really optimal prediction model (Li, 2005). Still, the use of a combination of method is to reduce the variance of estimated error and improve the recognition performance. The prediction results of each single classifier should be regarded as different information cells, and they can be synthesized by certain combinatorial mechanism to improve prediction performance. Ever since artificial intelligence techniques began to be applied to predict business failure in the 1990s, the techniques have become more sophisticated and refined. Still, creating a good performance classifier for business failure is difficult because unrepresentative samples exist. Hence, even with a highly accurate classifier, misclassification patterns frequently appear (Kim & Sohn, 2004). Recently, one of the main areas of research in business failure prediction has been the creation of methods for constructing ensembles of learning machines. Ensembles are sets of learning machines whose decisions are combined to improve the performance of the overall system. It is now well recognized that the combination of a set of classifiers designed for a given prediction problem achieves higher prediction rates than any of the classifiers applied individually (Assaad, Bone, & Cardot, 2008; Cho, Kim, & Bae, 2009; Esteban, Garcia, Gamez, & Elizondo, 2007; Hua, Wang, Xu, Zhang, & Liang, 2007; Kim, 2018; Maqsood, Khan, & Abraham, 2004; West, Dellana, & Qian, 2005; Yim & Mitchelle, 2002).
The main purpose of this study is: (1) to develop a more accurate and stable business failure prediction model by using an ensemble method with DT with experimental data on U.S. restaurants between 1980 and 2017 to fill the above-mentioned gap, and (2) to comprehensively evaluate the financial and market-driven variables in the context of predicting restaurant failure, especially during economic recessions. This work not only broadens the application of ensemble modeling within prediction methodology but also enriches the interpretability of business failure prediction models. The empirical experiment with the data of U.S. listed companies further indicates its effectiveness.
The rest of the paper is divided into five sections. Section 2 provides a theoretical framework for the research. Section 3 describes the data construction and methodology used in the analysis. Section 4 provides the main results of business failure prediction models and the implications of the finding, and, finally, section 5 presents conclusions and suggestions for future research.
Literature reviewDefinition of business failure and business failure predictorsThis study defines a firm as in business failure if it is delisted from Compustat databases, except in case of merger and acquisition (M&A). This research excludes exits by M&A from the sample, because exits by M&A are quite different from exit by liquidation (Frank & Goyal, 2008; Trecartin, 2003). First, liquidated assets are apt to retrieve low prices when sold in the second-hand asset market. Firms that are targets of takeovers, however, receive large premiums. Second, exit through takeovers alleviates the importance of direct bankruptcy costs (Frank & Goyal, 2008). Third, economic theory has provided diverse reasons for an occurrence of M&A: efficiency-related reasons, which involve economics of scale or synergies; attempts to create market power; and attempts to take advantage of opportunities for diversification (Andrade, Mitchell, & Stafford, 2001; Mitchell & Mulherin, 1996; Schwert, 2000; Rhodes-Kropf, Robinson, & Viswanathan, 2005; Shleifer & Vishny, 2003). Hence, this study limits its definition of business failure to bankruptcy, liquidation, reverse acquisition, leveraged buyout, companies no longer filing with the SEC but whose shares are still priced, or that are now private; while a non-failed business is one which has been consistently listed on Compustat.
Previous studies specify that profitability, solvency, liquidity, activity, and growth ratios are significant indicators in predicting business failure (Chancharat, Davy, McCrae, & Tian, 2007; Dimitras, Zanakis, & Zopounidis, 1996; Fama & French, 2004; Kim, 2011; Laitinen, 2005). Because of the inherent characteristics of financial statements based on conservative principles, however, asset values tend to be underestimated relative to their market values. Failure to incorporate a measure of asset volatility may cause important deficiencies in accounting-based business failure prediction models. Hillegeist, Keating, Cram, and Lundstedt (2004) have provided an optimum alternative for the above-mentioned problems by revealing that accounting-based measures are more informative than market-based scores alone when they are combined with details of market-based pricing and macro-economic influences. Argenti (1976) and McRobert and Hoffman (1997) state that such factors as stock-market share value, return on capital, and reputation with employees, customers, and/or suppliers shape the failure trajectory. Because such evaluations are more difficult for the management of failing firms to conceal, distort, or dress up, they are more reliable. Hence, this study conjoins McRobert and Hoffman’s market-based failure trajectory indicators (1997) with the above-defined five-categorized financial ratios to reinforce the significance of accounting-based information as recommended by Hillegeist et al. (2004).
The profitability of firms was measured using operating cash flow after interest and dividends (OCFAID), accumulated retained earnings (Lewis, 2002; Robb, 1999; Robb & Lewis, 2001; Robb & Attwell, 2015), and return on capital employed (ROCE) (Nouri & Soltani, 2016; Malcolm, Beynon, & Peel, 2001). OCFAID measures both the cash flow and profits (Robb & Lewis, 2001). Robb and Lewis (2001) proved the usefulness of OCFAID, in conjunction with retained earnings, to reveal underlying business problems that are not signaled by reported profits. ROCE uses an operating profit measure rather than the consolidated after-tax profit measure in OCFAID. ROCE is calculated by dividing profit before interest and tax by capital employed (Argenti, 1983). ROCE provides a better indication of financial performance with significant debt, because it considers debt and other liabilities, while other measures such as return on equity (ROE) analyze only profitability related to a firm’s common equity.
The solvency of firms was assessed using the debt-to-equity (D/E) ratio. Chancharat et al. (2007) revealed that financial leverage increases the probability of becoming financially distressed. The cash conversion cycle (CCC), current ratio, and Kaplan and Zingales (1997) (KZ) index (1997) were used to indicate the liquidity of firms. A lower level of liquidity usually has a positive relationship with financial failure. Financial practitioners have demonstrated that traditional measures of corporate liquidity are static in defining what cash resources are ready for use at a given moment to satisfy the current obligations (Chang, 2018; Liang & Pan, 2014; Wang, 2002; Zakari & Saidu, 2016). Gitman (1974) noted the restrictions of traditional static ratios and began to advocate the use of the operating approach and CCC to liquidity analysis. Investors focus on two things: (1) avoiding default situations by emphasizing a firm’s ability to cover its obligations with cash flow from mobilizing inventory and receivable investments within the normal course of firm’s operation, and (2) keeping operating cash flows sensitive to declining sales and earnings during economic recessions (Richards & Laughlin, 1980). In that sense, CCC is a dynamic measure of ongoing liquidity management that combines balance sheet and income statement data to generate a measure that indicates the life expectancies of working capital components depending on four activities of purchasing/ production, sales, collection, and payment across the supply chain (Richards & Laughlin, 1980). While some studies support the notion that aggressive liquidity policy enhance a firm’s profitability and value (Chang, 2018; Lee, 2015; Uyar, 2009), others reveal a positive relationship between CCC and a firm’s profitability and value (Baños–Caballero, Garcoa-Teruel, & Martinez-Solano, 2010; Czyzewski & Hicks, 1992). The current ratio was also included to measure the liquidity of a firm. A firm’s financial constraint level was indicated using Kaplan-Zingales (KZ) index (Andriosopoulos, Gaganis, & Pasiouras, 2016; Chen & Wang, 2012), which was constructed following the methodologies used in Lamon et al. (2001). Financial constraints refer to a firm’s inability to obtain funds to satisfy its investment demands, which could be due to credit limitation, difficulty in borrowing or issuing equity, lack of collateral, or other reasons (Kaplan & Zingales, 1997). The literature employs several financial constraint proxies, including Cleary index (Cleary, 1999), KZ index (Lamon, Christopher, & Saa-Requejo, 2001), and Whited Wu (WW) index (Whited & Wu, 2006). While the Cleary index is based on financial ratios that are mainly related to internal funds, the KZ index measures the impact of financial constraints on firm value by observing stock price movements (Lamont, et al., 2001. Hence, the author chose the KZ index as a proxy for a firm’s financial constraints following the recommendation of Hillegeist et al. (2004). The higher its KZ index, the more financially constrained the firms, and the higher the likelihood of business failure.
Market-based information such as market capitalization (Argenti, 1976; Campbell, Hilscher, & Szilagyi, 2011; Fama & French, 1993; Hess & Huettemann, 2019; Idrees & Qayyum, 2018; McRobert & Hoffman, 1997), stock price (SP) (Campbell et al., 2011; Idrees & Qayyum, 2018; Lukason & Laitinen, 2019; Zavgren, 1982) and the price-to-earnings (P/E) ratio (Penman & Zhang, 2002) were used to reveal the activity of firms. While the stock price evaluates the market’s rating of the firm without the influence of the number of shares issued, market capitalization provides the total market value of the firm. An increasing in market capitalization indicates that the market believes that the firm is improving. Campbell et al. (2011) and Zavgren (1982) have shown that failed firms often have very low stock prices because the price reflects the value of the firms’ equity. Lastly, the P/E ratio reflects the sustainability of current earnings, as it is determined by expected changes in profitability and expected growth in net operating assets (Penman & Zhang, 2002).
The Growth opportunity of the firms was calibrated using Tobin’s Q (Cho, 1998; Saddour, 2006), which is given by the market value of assets divided by the book value of assets. Since Tobin’s Q reveals firm value (Cho, 1998; Wang, 2002) and performance (Kang & Lee, 2015), it can be interpreted as a proxy for a firm’s reputation among customers and suppliers. The notion is that high Q firms have less-collateralizable assets, greater growth opportunities, and lower probabilities of business failure (Opler & Titman, 1993).
Previous studies indicate that macroeconomic factors impact on business failure (Bangia, Diebold, Kronimus, Shchagen & Schuermann, 2002; Figlewski, Frydman, & Liang, 2012; Koopman, Kräussl, Lucas, & Monteiro, 2009; Koopman, Lucas, & Schwaab, 2011). Bangia, Diebold, Kronimus, Schagen, and Schuermann (2002) found that upgrade, downgrade, and default intensities differ across different economic regimes defined by National Bureau of Economic Research (NBER) indicators. Figlewski et al. (2012) revealed that general macroeconomic conditions, which they examined using unemployment rate, inflation, NBER indicators, and Chicago Fed National Activity Index (CFNAI), impacted defaults and major credit rating changes for the period 1981−2002. NBER has categorized each month since 1959 into either peak or trough state that frame economic recessions and expansions (The National Bureau of Economic Research, 2020). The period between a peak of economic activity and its subsequent trough or lowest point is defined as a recession. Because a recession must influence the economy broadly and not be limited to one sector, US Bureau of Economic Analysis (BEA) considers various economy-wide measures such as real gross domestic product (GDP), real gross domestic income (GDI), total payroll employment, personal consumption expenditures, industrial productions, initial claims for unemployment insurance, wholesale-real sales adjusted for price changes, and household employment to define a chronology of business cycle turning points. This study, therefore, includes the NBER recession indicator as a macroeconomic variable for a business failure prediction model. The monthly peak and trough definitions of the NBER was aggregated into yearly expansion and contraction classifications. The authors expect that the probability of business failure would increase during the recessions based on the facts that (1) financial constraints are more often present in times of economic downturn (Lamont, Christopher, & Saá-Requejo, 2001); and (2) recessions create financial distress by tightening the margin between cash flow and debt service (Bernanke, 1981).
Ensemble method for business failure predictionAs mentioned in the introduction, it is hard to say that any one of the widely used methods - NN, SVM, DT, logit, and MDA - is superior to the others, because any individual model is problem dependent (Balcaen & Ooghe, 2006; Dragos et al., 2008; Grice & Dugan, 2010; Lee et al., 2006; Peat, 2008). Above traditional approaches have pros and cons as follows. NN has a black-box problem (Huang, Chen, Hsu, Chen, & Wu, 2004); SVM’s biggest limitation lies in the best choice of the kernel function (Byun & Lee, 2003); Logit is based on an assumption concerning the probability distribution (Hosmer & Lemeshow, 1989); and MDA needs three restrictive assumptions (Zavgren, 1982). NN produces good results even in complicated domains (Ghatasheh, Faris, AlTaharwa, Harb, & Harb, 2020; Ozkan-Gunay & Ozkan, 2007); SVM can make inseparable date sets separable by mapping the data into a higher-dimensional space using a kernel function (Kittler, 2000); and logit and MDA produce continuous scoring models (Balcaen & Ooghe, 2006).
In recent years, as an alternative to a single-classifier approach, the combination of multiple classifiers has been considered. While many single learning algorithms apply local optimization techniques that may get stuck in local optima, ensembles overcome the limited representational capability of single classifier by combining several learning machines (Valentini & Masulli, 2002). The fundamental idea of the combination model is to use the strength of each model to estimate different patterns in the data. Hence, the classifier ensemble systems, which combine several classifiers, achieve higher classification accuracy and efficiency than the original single classifiers (Assaad et al., 2008; Cho et al., 2009; Alfaro-Cortés, Garcia, Gamez, & Elizondo, 2007; Hua et al., 2007; Kim & Kang, 2010; Kittler, 1998; Lee et al., 2006; Maqsood et al., 2004; Optiz & Maclin, 1999; Perrone, Cowan, Tesauro, & Alspector, 1993; West et al., 2005; Yim & Mitchelle, 2002).
For ensemble learning, it has been proven that better performance can be achieved by rejecting weak classifiers (Yang, 2011). Because it is very difficult to find the best architecture (German, Bienenstock, & Doursat, 1992), various methods have been proposed to combine different architectures As diversity plays an important role in ensemble learning, classifiers selection is also made by taking both accuracy and diversity into account. When the number of classifiers and algorithms to be utilized is relatively small, the problem of how to obtain the right combination of classifiers can be solved by a simple method of exhaustive search (Ledezma, Aler, Sanchis, & Borrajo, 2010). According to Vaentini and Masulli (2002), there are three non-generative ensembles, including majority voting, fuzzy aggregation methods, and stacking. Among all the combination methods, majority voting is the simplest method with which to combine classifiers. In majority voting, the outputs of several numbers of individual classifiers are pooled together. Then, the output which receives the largest number of votes is selected as the final classification decision (Kittler, 1998).
In terms of classifier ensemble, the voting method demands no prerequisites from the classifiers (Ji & Ma, 1997). It neither assumes prior knowledge of the behavior of individual classifiers nor requires training on large quantities of representative recognition results from the classifiers (Lam & Suen, 1997). A remarkable improvement in the classification results is obtained regardless of the independence of the classifiers (Lam & Suen, 1997). Majority voting to create an ensemble is an effective strategy and has been put forward as a means of improving algorithmic accuracy (Choi, Son, & Kim, 2018; Fauvel, Chanussot, & Benediktsson, 2006; Foody, Boyd, & Sanchez-Hernandez, 2007; Doan & Foody, 2007). In a recent study, in which the four ensemble strategies- majority voting, weighted voting, DS evidence theory, and fuzzy integral with neural network - were employed on five classifiers; majority voting was more effective than the other complicated schemes in the improving accuracy of the results (Du, Xia, Zhang, Tan, Liu, & Liu, 2012). Dahiya, Handa, and Singh (2015) have proposed an ensemble model for credit evaluation. In comparison with logit, SVM, CART, CHAID, NN, C5.1, and QUEST, a majority voting ensemble with seven base classifiers perform the best for all partitions in credit scoring. Sun and Li (2008) have shown that a majority voting ensemble is more accurate, more stable, and more suitable for financial distress prediction than single classifiers such as MDA, logit, NN, SVM, and case-based reasoning (CBR). Notably, majority voting improves not only accuracy but also stability with relatively less fluctuation in its test curve. Hence, majority voting is an accurate way to combine the base classifiers (Kuncheva, 2014; Verikas, Kalsyte, Bacauskiene, & Gelzinis, 2010; Witten, Frank, Hall, & Pal, 2016).
Previous works have demonstrated that decision trees (DT) are very effective for ensemble modeling (Bauer & Kohavi, 1999; Breiman, 1996; Drucker & Cortes, 1995; Freund & Schapire, 1996; Kim, 2018; Kim & Upneja, 2014; Margineantu & Dietterich, 1997; Quinlan, 1996; Tamon & Xiang, 2000; Zhang, Burer, & Street, 2006). Various studies have found that DT predicts class variables more accurately (Eksi, 2011; Gepp, Kumar, & Bhattacharya, 2010; Kumar & Ravi, 2007; Kuncheva & Rodriguez, 2007). Hung and Chen (2009) developed a selective ensemble DT model for bankruptcy prediction based on the expected probability of classifiers and examined how the prediction accuracy of the model could be improved by replacing voting policies. They concluded that a selective DT ensemble performs better than other stacking ensembles of J4.8, NN, and SVM. Lin and McClean (2001) developed ensemble models integrating NN, C5.0, linear discriminant analysis (LDA), and logit in different combinations to predict corporate failures in the U.K. After comparing the prediction accuracy of each single model and different ensemble models, they concluded that logit + C5.0 outperforms the other two models, LDA + logit + NN + C5.0 and DA + NN + C5.0. Kotsiantis, Tzelepis, Koumanakos, and Tampakas (2007) obtained the best performance of bankruptcy prediction by using a logistic model tree (LMT) (Landwehr, Hall, & Frank, 2003), which is a classification tree with logistic regression functions at the leaves, in comparison with NN, SVM, logit, and DT. They warned that the vote of the majority will lead to worse prediction than the one obtained by using a single classifier, if too many inefficient and uncorrelated classifiers are combined. Kamos et al. (2012) proved the superiority of a hybrid voting ensemble to NN, C4.5, SVM, logit, and stacking for credit rating. But they also admitted the weakness of the proposed method in decreased comprehensibility. Olmeda and Fernandez (1997) revealed that the voting approach to NN + C4.5+logit + DA, NN + logit + multivariate adaptive regression splines (MARS)+DA, and NN + logit outperformed any other single alternatives in predicting bank bankruptcy in Spain. They noticed that including too many marginally inefficient classifiers in an ensemble could conduce to suboptimal performance. Diversity of ensemble members can be achieved at the expense of ensemble accuracy. As mentioned in many studies, tradeoff between accuracy and diversity is desired (Kotsiantis et al., 2007; Kuncheva & Whitaker, 2003; Olmeda & Fernandez, 1997). Therefore, for this research two classifiers of DT and logit were carefully chosen for an ensemble by use of a majority voting strategy to predict business failure, with the awareness that there is a certain trade-off between the number of methods used and the accuracy of the predictions.
Overview of US restaurant failure predictionAs Brigham and Gapenski (1994) explained, the characteristics of one industry differ from those of another. Sun, Li, Huang, and He (2014) however discovered that many studies used cross-industry data to develop a failure prediction model because of insufficient available data. Restaurant failure cases in the United States are numerous enough to develop an industry-specific business failure prediction model. This study, therefore, specifically used a U.S. restaurant-industry sample to develop a more accurate and less varied business failure prediction model.
Considering that the United States is the biggest market for consumer restaurant spending and around one fourth of consumer spending in the global industry is regarded as attributable to the United States (Lock, 2018), it appears appropriate to focus the analysis on U.S. restaurant business failure prediction. The U.S. restaurant industry has been changing and contributing to American culture and the economy since the early twentieth century (Boccardelli, 2015). Significant development of the industry early in the twenty-first century made it the nation’s largest private-sector employer. Today, the industry employs 15.6 million people, which is equivalent to about 10% in working Americans, and the economic impact of the industry is more than 2.5 trillion U.S. dollars (NRA, 2020). Even though the contribution of the restaurant industry to the global and U.S. economic condition is immense, not much research has been devoted to the prediction of restaurant failures, with the few exceptions mentioned below.
Jang et al., (2010) estimated the cashflow risk of U.S. restaurants by using a top-down comparables approach based on first-step regression for two segments, full-service and limited service. Their results showed that the full-service restaurant business has been riskier than limited-service restaurants in terms of cashflow. The study confirmed that cashflow-at-risk (CFaR) could be a good risk measure for the executives of nonfinancial firms, and therefore the company can manage their operating cashflow risk in advance. The results also indicated that the proportion of extreme cashflow shortfalls was bigger for small firms than for larger firms, showing that small firms should prepare to address liquidity risk in advance of an economic downturn. Because their study utilized only three firm-characteristic variables - market capitalization, profitability, and market segment - they suggested including additional characteristics such as capital structure in further studies.
Youn and Gu (2010) developed a U.S. restaurant failure prediction model using logistic regression and an artificial neural network (ANN), with using the data of 31 firms. Their results revealed that the logistic model for bankruptcy was not inferior to ANN for bankruptcy in terms of prediction accuracy and the model indicated how firms could act to reduce the probability of bankruptcy. The authors suggested using the logistic model because it can be easily interpreted by users. The limitation of the study lays on the fact that the research was conducted based on firm-specific microeconomic information. They recommended the inclusion of macro variables such as changes in gross national product, interest rates, or stock price indexes in future research.
Kim and Upneja (2014) examined the key financial distress factors for US restaurants using DTs and AdaBoosted DTs. A large portion of debt in the capital structure demolished restaurants’ financial structure and inability to pay their drastically increased debt jeopardized restaurants to financial distress. By using DTs and AdaBoosted DTs, the study not only overcame the limitation of black-box models such as ANNs but also provided transparent methods for inductive learning from data. The prediction accuracy rate of the AdaBoosted DT model for financial distress was 73.81%. The study expanded the boundary of failure studies from bankruptcy to financial distress, and included the additional predictive variables of board holding ratio, stock price trend, EPS, management practice, and changes in GDP. For future studies, they suggested using causal specifications of underlying economic variables for modeling and to involve the ensemble as an alternative classification technique.
Kim (2018) developed three separate models for the hotel, restaurant, and recreation segments in the hospitality industry by using an SVM-NN-DT stacking method with SVM as a meta classifier. The prediction accuracy rate for financial distress of the restaurant model was 76.19%. And the debt-to-equity ratio, growth in owners’ equity, net profit margin, and stock price trend were chosen as financial distress predictors. Although this study contributed to the field by creating independent models for three segments in the hospitality industry, its implications are limited. Its restaurant model was based on 824 data sets without any consideration of economic fluctuations, despite the performance of the restaurant business is very sensitive to economic changes.
Based on a literature review of U.S. restaurant failures, this study not only encompasses a range of micro variables such as CCC, KZ index, market capitalization, stock price, P/E ratio, and Tobin’s Q but also uses the NBER recession indicator as a macro variable to predict U.S. restaurant failure, especially during economic downturns. There is still room for performance improvement in predicting restaurant failure.
MethodologyDataThe data used in this study are from the Compustat database produced by Standard and Poor's Institutional Market Services. Data of eating places from the Standard Industrial Classification (SIC 5812) from 1980 through 2017 were selected. For the business-failures, the author used financial data from 1 year prior to up to 5 years prior to delisting (e.g., Altman, 1993; Alfaro-Cortés, Gamez, & Garcia, 2008; Kim & Upneja, 2014) for the same period. The most recent fiscal year must have ended at least 1 year prior to the date of delisting. The total number of observations after winsorizing outliers, as Farooq and Qamar (2019) did, was 2747, where 1432 observations were categorized as business failure and the other 1315 observations were categorized as non-business failures. Based on the fact that an appropriate criterion for matching purpose is not evident (Ohlson, 1980), no attempt was made to match the business failures and non-business failures as Grice and Dugan (2010), Kim and Upneja (2014); Lacher, Pamela, Sharma, and Fant (1995); Lin and McClean (2001); Watson (1995), and Zhang (2006) previously did.
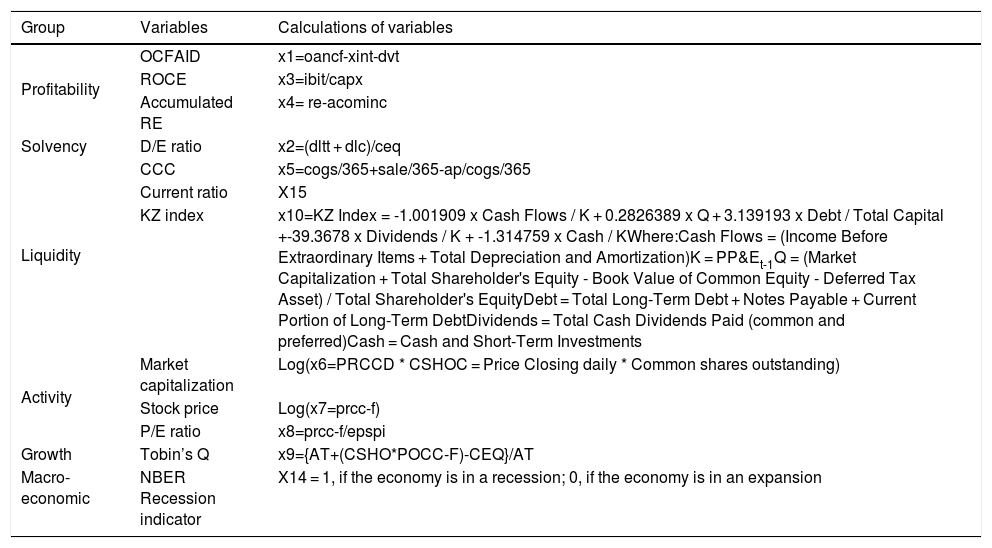
Because macroeconomic factors affect business failure (2011, Bangia et al., 2002; Figlewski et al., 2012; Koopman et al., 2009), this study segmented the entire period into economic recession and economic expansion according to the NBER recession indicator. Economic downturns in 1981, 1983, 1992, 2002, 2003, and 2010 contained 297 observations, while economic expansions comprised the remaining 2450 observations out of the total 2747 observations. Table 1 shows the variables used in the research and how they were calculated.
Research variables.
| Group | Variables | Calculations of variables |
|---|---|---|
| Profitability | OCFAID | x1=oancf-xint-dvt |
| ROCE | x3=ibit/capx | |
| Accumulated RE | x4= re-acominc | |
| Solvency | D/E ratio | x2=(dltt + dlc)/ceq |
| Liquidity | CCC | x5=cogs/365+sale/365-ap/cogs/365 |
| Current ratio | X15 | |
| KZ index | x10=KZ Index = -1.001909 x Cash Flows / K + 0.2826389 x Q + 3.139193 x Debt / Total Capital +-39.3678 x Dividends / K + -1.314759 x Cash / KWhere:Cash Flows = (Income Before Extraordinary Items + Total Depreciation and Amortization)K = PP&Et-1Q = (Market Capitalization + Total Shareholder's Equity - Book Value of Common Equity - Deferred Tax Asset) / Total Shareholder's EquityDebt = Total Long-Term Debt + Notes Payable + Current Portion of Long-Term DebtDividends = Total Cash Dividends Paid (common and preferred)Cash = Cash and Short-Term Investments | |
| Activity | Market capitalization | Log(x6=PRCCD * CSHOC = Price Closing daily * Common shares outstanding) |
| Stock price | Log(x7=prcc-f) | |
| P/E ratio | x8=prcc-f/epspi | |
| Growth | Tobin’s Q | x9={AT+(CSHO*POCC-F)-CEQ}/AT |
| Macro-economic | NBER Recession indicator | X14 = 1, if the economy is in a recession; 0, if the economy is in an expansion |
It is well known that there is no single classification algorithm that is always the most accurate. Because each algorithm has a different inductive bias, making a different assumption about the data, the overall error in different instances can be decreased by using a suitable combination of classifiers (du Jardin, 2021; Kuncheva, 2014). A single classifier is the basis of an ensemble system and it should be chosen based on the system’s performance. There is a consensus that the performance of ensemble systems is based on both the individual performance and the degree of diversity of basic classifiers (Sharkey & Sharkey, 1997). Hence, this study followed the principles of diversity optimization selecting basic classifiers.
The diversity principle assumes that a perfect classifier never exists. Because any basic classifier is not a perfect classifier, certain degree of classifier diversity is required. Thus, when some basic classifiers output wrong predicted labels, other basic classifiers may still possibly output the right predicted label (Kuncheva, 2005). There are three approaches generating diverse basic classifiers. One is to apply different learning algorithms (with heterogeneous model representations) to a single data set. Another is to apply a single learning algorithm with different parameter settings to a single dataset. The third is to apply a single learning algorithm to different versions of a given dataset (Todorowski & Dxeroski, 2003). This study adopted the first approach to generate multiple diverse basic classifiers.
The principle of Individual optimization implies that we should continuously pursue perfect classifiers. Though there is no perfect classifier, the classifier performance can be brought much nearer to that of a perfect classifier by optimizing the model parameters or model structure. Because it generated different basic classifiers by applying different learning algorithms to a single dataset, this research optimized the parameters and model structure, using a confusion matrix and a set of statistical measures, to optimize individual basic classifiers.
A DT model is a powerful knowledge representation and reasoning algorithm under conditions of uncertainty. A DT is a non-parametric, hierarchical classification that predicts class membership by recursively partitioning a data-set into smaller subdivisions or more homogeneous subsets (Joos, Vadhoof, Ooghe, & Sherens, 1998). The major advantage of DTs over many other types of predictive models, such as NN or SVM which have black-box approaches, is that the DT structure represents the inter-relationships among the data-set features. The other advantages of DTs include explicit uncertainty characterization (Joos et al., 1998; Kirkos, Spathis, & Manolopoulos, 2007; Witten et al., 2016), as well as fast and efficient computation (Kirkos et al., 2007). DTs do not require any assumptions of linearity in data (Kim & Upneja, 2014). They are highly adaptive, easy to build, and provide explicit representation of domain-specific knowledge in human reasoning frameworks (Kirkos et al., 2007; Kumar & Ravi, 2007). Furthermore, DTs are useful exploiting the relationships between many candidate input variables and the target variable (Hajaizadeh, Ardakani., & Shahrabi, 2010).
Among existing methods in the literature used to solve supervised learning problems (Caruana & Niculescu-Mizil, 2006; HHastie, Tibshirani, & Friedman, 2009; Witten et al., 2016), linear models and DTs have gained popularity in the data-mining community for the prediction of both nominal classes and numeric values (Loh, 2011). Model combination through averaging reduces variance (Breiman, 1996), and hence error, but only if bias does not increase in the process, or if the concomitant increase in bias is small with respect to the decrease in variance. It is therefore essential that only those models that contribute to accuracy are added and the poorly performing ones are weeded out. Besides its effect on statistical accuracy, each additional model increases the structural diversity. According to the principles of diversity and individual optimization, DT and logit were selected as basic learning algorithms for business failure prediction from the candidates NN, SVM, DT, and logit.
In classifier combination, simple majority voting is among the most widely used combination rules for its improvement in accuracy (Du, Xia, Zhang, Tan, Liu, & Liu, 2012; Tripathi, Edla, Cheruku, & Kuppili, 2019; Verikas et al., 2010). Voting involves obtaining a linear combination of learners. Simple voting is a special case in which all voters have equal weight. This is also known as plurality voting, in which the class taking the majority of votes is the winner. That is, the binary outputs of the base classifier are combined so that the highest number of votes is determined as the final output of the ensemble in the scheme (Dehzangi & Karamizadeh, 2011). After many experiments, the best results were achieved through an exhaustive search. The study applied logit and DT as early mentioned. The best performance was achieved with majority voting among others, which included average of probability, minimum probability, maximum probability, and median combination rules.
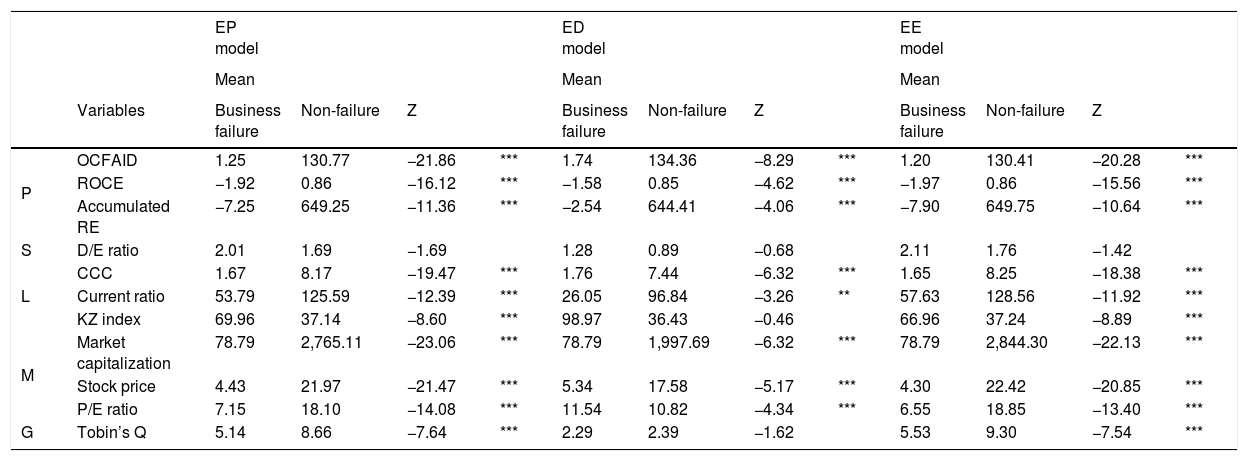
Results of the analysisDescriptive analysisBecause the data did not meet the homogeneity test, the authors used the Mann-Whitney U test to confirm the differences between business failures and non-failures. The results in Table 2 show that two groups differed in most of the variables.
Mann-Whitney U test for differences between failures and non-failures.
| EP model | ED model | EE model | |||||||||||
|---|---|---|---|---|---|---|---|---|---|---|---|---|---|
| Mean | Mean | Mean | |||||||||||
| Variables | Business failure | Non-failure | Z | Business failure | Non-failure | Z | Business failure | Non-failure | Z | ||||
| P | OCFAID | 1.25 | 130.77 | −21.86 | *** | 1.74 | 134.36 | −8.29 | *** | 1.20 | 130.41 | −20.28 | *** |
| ROCE | −1.92 | 0.86 | −16.12 | *** | −1.58 | 0.85 | −4.62 | *** | −1.97 | 0.86 | −15.56 | *** | |
| Accumulated RE | −7.25 | 649.25 | −11.36 | *** | −2.54 | 644.41 | −4.06 | *** | −7.90 | 649.75 | −10.64 | *** | |
| S | D/E ratio | 2.01 | 1.69 | −1.69 | 1.28 | 0.89 | −0.68 | 2.11 | 1.76 | −1.42 | |||
| L | CCC | 1.67 | 8.17 | −19.47 | *** | 1.76 | 7.44 | −6.32 | *** | 1.65 | 8.25 | −18.38 | *** |
| Current ratio | 53.79 | 125.59 | −12.39 | *** | 26.05 | 96.84 | −3.26 | ** | 57.63 | 128.56 | −11.92 | *** | |
| KZ index | 69.96 | 37.14 | −8.60 | *** | 98.97 | 36.43 | −0.46 | 66.96 | 37.24 | −8.89 | *** | ||
| M | Market capitalization | 78.79 | 2,765.11 | −23.06 | *** | 78.79 | 1,997.69 | −6.32 | *** | 78.79 | 2,844.30 | −22.13 | *** |
| Stock price | 4.43 | 21.97 | −21.47 | *** | 5.34 | 17.58 | −5.17 | *** | 4.30 | 22.42 | −20.85 | *** | |
| P/E ratio | 7.15 | 18.10 | −14.08 | *** | 11.54 | 10.82 | −4.34 | *** | 6.55 | 18.85 | −13.40 | *** | |
| G | Tobin’s Q | 5.14 | 8.66 | −7.64 | *** | 2.29 | 2.39 | −1.62 | 5.53 | 9.30 | −7.54 | *** |
P: profitability; S: solvency; L: liquidity; M: market-driven info; G: growth.
*0.10 **0.05 ***0.001.
The big differences between business failures and non-failures in profitability are in OCFIAD, ROCE, and accumulated retained earnings. Profitability shows that business failures are cash cows that generate positive OCFAID but have negative ROCE, while non-failures are star performers who had positive OCFAID and ROCE in all three models of an entire-period model (EP model), an economic-downturn model (ED model), and an economic-expansion model (EE model) (Robb, 2015; Robb & Lewis, 2002). There is an enormous gap between the two groups in accumulated RE. Solvency represented by the D/E ratio indicates that business failures have higher D/E ratios than non-failures, as expected. All three liquidity variables differed significantly between two groups. Showing lower level of CCC and current ratio and higher average values of the KZ index, financially constrained firms had a higher likelihood of business failure. Activity variables show that non-failures significantly outperformed the failures. The P/E ratios of non-failure companies were higher than those of failures. P/E ratio is positively related to future earnings growth and is also negatively related to current earnings growth, because transitory current earnings affect P/E ratio (Penman, 1996). Hence, the P/E ratio should be carefully interpreted, with consideration of its relationship with other variables. Growth opportunity reflected by Tobin’s Q shows that non-failure firms had greater growth opportunities. This tendency in five categories deepens in the EE model compared with the ED model.
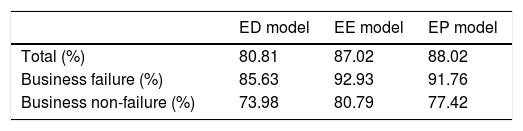
ResultsThree models - an EP model, an ED model, and an EE model - were developed using WEKA 3.9. The prediction accuracies of the models were 88.02% for the EP, 80.81% for the ED, and 87.02% for the EE (Table 3). The ED model accurately predicted 85.63% of business failures and 73.98% of non-failures. The business-failure prediction accuracy of the EE model was 92.93%, while for non-failure was 80.79%. The accuracy of all three models in predicting business failure rate was higher than their accuracy in predicting non-failures. Considering that the consequences of type I error are more expensive, smaller type I error rates in models are preferred. The DT and logit ensemble model substantiated its efficiency, as Kim and Upneja (2014) predicted, by both improving the accuracy rate of the model and decreasing the type I error rates compared with any of the previous restaurant failure prediction models. Therefore, the use of a DT-logit ensemble model is recommended for predicting restaurant failures in the future.
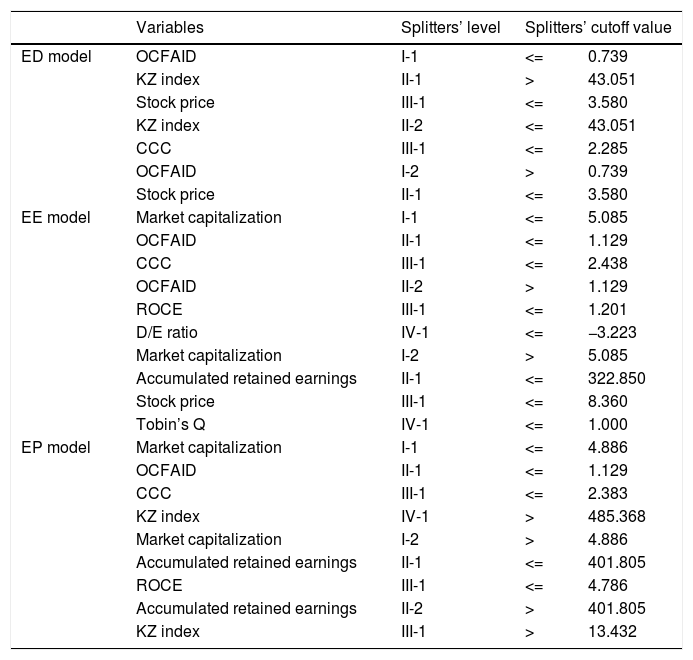
While the EE model revealed the market capitalization, OCFAID, CCC, ROCE, accumulated retained earnings, stock price, and Tobin’s Q as significant variables, the ED models exposed quite different variables such as OCFAID, the KZ index, stock price, and CCC. The EP model combined most of the variables from two sub-divided models except for Tobin’s Q, the stock price, and the D/E ratio (Table 4).
Significant variables for ensemble business failure prediction.
| Variables | Splitters’ level | Splitters’ cutoff value | ||
|---|---|---|---|---|
| ED model | OCFAID | I-1 | <= | 0.739 |
| KZ index | II-1 | > | 43.051 | |
| Stock price | III-1 | <= | 3.580 | |
| KZ index | II-2 | <= | 43.051 | |
| CCC | III-1 | <= | 2.285 | |
| OCFAID | I-2 | > | 0.739 | |
| Stock price | II-1 | <= | 3.580 | |
| EE model | Market capitalization | I-1 | <= | 5.085 |
| OCFAID | II-1 | <= | 1.129 | |
| CCC | III-1 | <= | 2.438 | |
| OCFAID | II-2 | > | 1.129 | |
| ROCE | III-1 | <= | 1.201 | |
| D/E ratio | IV-1 | <= | −3.223 | |
| Market capitalization | I-2 | > | 5.085 | |
| Accumulated retained earnings | II-1 | <= | 322.850 | |
| Stock price | III-1 | <= | 8.360 | |
| Tobin’s Q | IV-1 | <= | 1.000 | |
| EP model | Market capitalization | I-1 | <= | 4.886 |
| OCFAID | II-1 | <= | 1.129 | |
| CCC | III-1 | <= | 2.383 | |
| KZ index | IV-1 | > | 485.368 | |
| Market capitalization | I-2 | > | 4.886 | |
| Accumulated retained earnings | II-1 | <= | 401.805 | |
| ROCE | III-1 | <= | 4.786 | |
| Accumulated retained earnings | II-2 | > | 401.805 | |
| KZ index | III-1 | > | 13.432 | |
During economic downturns, OCFAID is the first splitter. If OCFAID is smaller than or equal to 0.739, the KZ index is important in predicting business failure. If the KZ index is higher than 43.051, the stock price should be more than 3.580 to survive. Otherwise, the company will fail in business. If the KZ index is smaller than 43.051, we should check the CCC. If the CCC is less than or equal to 2.285 under that circumstance, then the company may face failure. If OCFAID is larger than 0.739, we should check the stock price to predict business failure. If the stock price is below 3.580, the company will fail (Table 4).
Most accounting and business texts acknowledge that corporate business failure depends on two factors: profitability and liquidity. It is possible for a company to be profitable but run short of cash, especially where debtors, creditors, and inventory fluctuate and are material. It is even possible for a firm to have no liquidity problems but fail because it is operating at a loss. Net operating cash flow shows the cash generated from operating activities. Most accounting standards require this figure to be shown after taxation and interest paid, but before dividends are paid. However, both interest and dividends are costs of capital and both outflows need to be considered in determining whether the entity has operated successfully. It is a sign of financial weakness if a company must borrow to pay its taxes, interests, or dividends. The results proved that OCFAID is theoretically and practically important in predicting business failure.
The KZ index reflects the cost of external funds, that is, the cost a firm would incur conditional upon using external funds (Hennessy & Whited, 2007). Constrained firms earn lower returns than unconstrained firms, and financially constrained firms do have returns that are significantly more cyclical than average. The results are compatible with those of Lamont et al. (2001). If its stock price does not reach a certain point under financial constraints, a firm will not endure economic turmoil as Idrees and Qayyum (2018) showed. Therefore, if a company is less profitable from the viewpoint of OCFAID and more financially constrained by the KZ index, the stock price must at least be stable for a company to survive during economic downturns. Otherwise, it will fail. The results provide the evidence that OCFAID and KZ index jointly can draw attention to financial difficulties that profit alone may fail to indicate.
If the KZ index is less than or equal to 43.051, the CCC should be checked to predict whether a firm will survive or not. Consistent with the result of Baños–Caballero, García–Teruel, and Martínez–Solano (2010), this study found that a long CCC may increase a firm’s sales and profitability and contribute to its survival. This can be interpreted as meaning that if a company increases its sales by extending a higher trade credit, a stronger relationship with its customers helps the firm to handle economic turmoil (Ng, Smith, & Smith, 1999). If a firm adopts an aggressive working capital policy, it will yield negative returns, as Afza and Nazir (2008) confirmed.
If OCFAID is larger than 0.739, the next splitter is stock price. This means that if the company’s profitability meets certain criteria, an evaluation from the market is more important than liquidity indices such as the KZ index or the CCC. Because the stock prices reflect investor’s expectations of future cash flows or earnings and the company’s earnings are affected by its financial position, a close relationship between stock price and the probability of business failure is expected. It is therefore assumed that a high value of stock price will decrease the probability of business failure, consistent with Kim (2018). In other words, if there exists a persistent bias in securities pricing (Shleifer & Vishny, 1994), the available business-failure-risk information does not impound fully. Therefore, when the negative information is embedded in prices, the most insolvent restaurants earn lower stock returns, or vice versa.
Significant variables for predicting business failure during economic expansions differ from those during economic downturns as show in Table 4. The first splitter is market capitalization. If the market capitalization is less than and equal to 5.085, then OCFAID should be considered to predict business failure. If OCFAID is less than or equal to 1.129 and CCC is less than or equal to 2.438, then the company will fail. If OCFAID is greater than 1.129 and ROCE is less than or equal to 1.201, then the D/E ratio splits the business failure and success. If the D/E ratio is less than or equal to -3.223, the company will fail. If the market capitalization is greater than 5.085 and accumulated retained earnings are less than or equal to 322.850, the stock price and Tobin’s Q should be considered in predicting whether the company will fail. If the stock price is less than or equal to 8.360 and Tobin’s Q is less than or equal to 1.000, then company will fail.
The first splitter, market capitalization, represents the market value and is a proxy for firm size. If the market value of a firm’s equity is discounted by market participants or investors, it entails a reduction in the debt holders’ equity cushion. This decline in the level of equity, induced by a negative investors’ judgment of the firm’s financial standing, can systematically move towards the value of liabilities until it reaches the point where it is insufficient to serve the firm’s debt obligation. Therefore, a high value of market capitalization should entail a low probability of business failure. Conversely, a relatively small-sized company has a high probability of business failure. As a proxy for firm size, market capitalization also represents a firm’s ability to access capital markets. Small firms face difficulties in accessing capital markets because they are typically young, less known, and thus more vulnerable to capital markets imperfections. The results are compatible with that of Almeida, Campello, and Weishbach (2004). As a result, smaller firms with lower market capitalization as a result are typically associated with higher business failure risk, while larger firms are perceived by the market to have lower business failure risk, as demonstrated by Jones (2017).
If the OCFAID of smaller firms with lower market capitalization does not satisfy a certain criterion and the CCC is too short, then the firm will fail. If the OCFAID of a smaller firm satisfies the minimum criterion, ROCE and the D/E ratio should be additionally confirmed to predict its survival. As outlined in the descriptive analysis, business failures are categorized as cash cows that have positive OCFAID and negative ROCE while non-failures are categorized as star performers with positive OCFAID and ROCE, according to their mean values. The EE model identified that OCFAID and ROCE as the second and third splitters for predicting business failure. If ROCE is below a certain positive threshold, such as 1.201 and the D/E ratio is negative, then the firm will fail. Interestingly, the minimum threshold for ROCE is still positive in the EE model. The predictive model seems to have a buffer zone of ROCE in which a company will not easily fail.
Larger firms with higher market capitalization have different predictors for business failure such as accumulated retained earnings, stock price, and Tobin’s Q. If a company is large enough to be acknowledged by the market but the accumulated retained earnings do not reach a certain point, then the stock price might be similarly low. In this case, the firm’s growth potential, represented by Tobin’s Q, is critical to survival. Tobin’s Q goes high when a company has valuable intangible assets in addition to physical capital, such as monopoly power, goodwill, a stock of patents, or good managers. A Tobin’s Q greater than 1 means that the company is recognized as having strong growth potential, providing an investment opportunity; hence the possibility of survival is high. The results are consistent with those of Cho (1998) and López-Gutiérrez, Sanfilippo-Azofra, and Torre-Olmo (2015). Otherwise, a company will fail because it will not have the same access to capital markets that the others do. Still, this is the case only for larger firms with higher market capitalization during economic expansions.
For the entire period, the first significant splitter is market capitalization, as it is for economic expansions. If the market capitalization is larger than 4.886, then we must check the accumulated retained earnings to predict a business failure. If the accumulated retained earnings are smaller than or equal to 401.805 and ROCE is smaller than or equal to 4.786, the company has a high propensity to fail. If accumulated retained earnings are larger than 401.805 but the KZ index is larger than 13.432, then the company will fail. If its market capitalization is smaller than or equal to 4.886 and OCFAID is smaller than or equal to 1.129, the CCC and KZ index should be considered. If the CCC is smaller than or equal to 2.383 and the KZ index is larger than 485.368, then the company is in danger of failing.
The entire pattern of the EP model is very similar to that of the EE model, except that the EP model includes the KZ index rather than the D/E ratio, stock price, or Tobin’s Q. This can be interpreted as meaning that a firm’s degree of financial constraints is a crucial factor for this model at some points.
The results have several managerial and practical implications especially during economic recessions. A restaurant management team may consider the findings of this study when developing corporate financial strategies for financial risk management. Taking account of the fact of restaurants’ financial vulnerability during economic recessions, this study’s findings could provide industry-specific and timely valuable insights. When the profitability of a firm is not assured during economic turmoil, the management should tightly control the financial constraints, stabilize its stock price, and/or increase the CCC to solidify the relationship between the firm and its suppliers in supply chain systems. It also should be noted that the increase in profitability is conditional on the stock price a firm’s survival during such periods. Considering the interaction between these two variables, the firm should aggressively invigorate its activity in the market when the company’s profitability is guaranteed during economic downturns. OCFAID in the ED model directs attention on business concerns of generating decent profitability and liquidity arising from operations. It is easy to apply for practitioners because all data are produced as a part of financial reporting procedure or can be derived from the financial statements. And presenting the relationship between OCFAID and KZ index during economic downturns can expose underlying business problems that are not warned by profits alone.
Furthermore, when there exists a default risk during economic downturns, financial markets appear as less proficient for evaluating the default risk embedded in the firm and do not demand for sufficiently higher risk premium to be compensated for default risk. This means that the probability of restaurant failure is high, if the stock price falls below a certain threshold during economic recessions. US restaurant investors and analysts can use the findings when developing their investment strategies or evaluating their portfolios.
Conclusions and suggestions for future researchEven though a business failure causes significant direct and indirect costs to various stakeholders, developing a predictive model of business failure is not a common practice in the hospitality industry, excepting the studies by Jang, Park, and Lee (2011); Kim (2018); Kim and Upneja (2014), and Noronha and Singal (2004). Furthermore, prediction of failure during economic downturns has not previously been addressed.
The aim of this study is to develop an accurate business-failure prediction model for the restaurant industry during economic recessions with more relevant variables by using an ensemble model with a DT. Although there is a significant body of literature focusing on the relationship between financial variables and business failures, our paper is the first to comprehensively evaluate financial and market-driven variables in the context of predicting restaurant business failure with a focus on economic downturns.
The results show that any company with low OCFAID, a high KZ index, and a low stock price should especially be alert during economic downturns. As Robb and Lewis (2002) indicated, OCFAID is useful in uncovering underlying business problems that are not signaled by reported profits, because it measures both the cash flow and profits. No prior of any hospitality research has focused on OCFAID. The importance of cash flow in addition to profit, however, cannot be overemphasized in the restaurant industry, where cash flow is crucial to a firm’s staying afloat. Considering that the KZ index signifies the cost of external funds, a company with a high stock price, indicating a positive evaluation by the market, and long CCC, reflecting a strong relationship between the firm and suppliers in the supply chains, has a higher probability of surviving during economic recessions. The results of the study can be applied to various aspects of restaurant management. To survive economic downturns, management should carefully control the cumulative OCFAID in upward sloping. In addition to vigilant attention to this accounting-based measure, the management team should alert other failure trajectory indicators such as the KZ index and the CCC. Because the KZ index assesses the impact of financial constraints on a firm’s value by observing in stock price movement, it can be interpreted as consumers’ assessment of the firm. While static cash flow indicators limit the firm’s readiness at a given moment, the CCC can dynamically control ongoing liquidity in accord with purchasing, production, sales, collection, and payment in the supply chain. Firms are advised to maintain a strong customer relationship, for example, by extending higher trade credits.
The contribution of this research can be defined in two areas. First, it emphasizes the importance of the interpretability of the results in conjunction with accuracy. A true useful classifier ensemble has three attributes: accuracy, easy interpretation of the classified results (Hsieh & Hung, 2010), and effectiveness (Valentini & Masulli, 2002). Because accuracy is not the only measure used to evaluate the performance of expert and intelligent system, researchers should be aware that the interpretability of prediction models is also important for precise understanding of the data and practical implementation of the results in the real world. This study fulfilled the objectives of (1) improving the performance accuracy of the restaurant failure prediction, and (2) boosting the interpretability of the restaurant prediction model. This study’s second contribution is to broaden the assessment frame of business-failure prediction by incorporating a measure of asset volatility related to economic fluctuations with typical characteristics of financial statements. As Hillegeist et al. (2004) recommended, this study combines accounting-based measures with McRobert and Hoffman’s (1997) market-based failure trajectory indicators to create an optimum alternative for widely used business failure predictors.
This study has several limitations that can be further addressed in subsequent studies in the future. First, while market-price indicators have a strong theoretical basis in business failure prediction, they also suffer limitations. Market-price indicators rely on capital markets, but this market may not efficiently aggregate all publicly available information (Sloan, 1996). It might be also the case that some market prices incorporate random information that is not directly relevant to the business failure or financial insolvency process, as discussed by Rees (1995). Second, it is possible for managers to manipulate cash flows, just as it is possible for them to manipulate the calculation of the year’s profit and loss. Researchers should be aware that profit and operating cash flow may have been improved by a company’s undisclosed policy of capitalizing interest and other expenses, especially if managers are being remunerated with bonuses based on accounting profits. Third, the study’s current sample consists only of publicly traded U.S. restaurant firms. The findings, therefore, might be limited its generalizability. To relieve this limitation, further research could extend the study’s range to other forms such as, but not limited to, independent U.S. restaurants or non-U.S. restaurant companies. Fourth, this study limits the definition of business failure to delisting from Compustat databases. It will be interesting to specify the key predictors of restaurant for different types of financial distress such as liquidation, merger and acquisition, privatization, or bankruptcy in future research.