


Very few quantitative studies assess the impact of IPR protection mechanisms on the competitiveness of companies, particularly those whose creation and existence is often attributed to high technology/knowledge intensity. The present study aims to fill this gap. Through a direct survey targeting startups located in S&T parks and incubators, we assess the direct and indirect impact of IPR protection mechanisms. Logistics estimations based on a sample of 48 Portuguese companies suggest that, considered globally, formal IPR protection is detrimental to the companies’ competitiveness. Notwithstanding, when IPR protection mechanisms are discriminated by type, the results indicate that the use of informal protection mechanisms, such as lead time and trade secrets, fosters the companies’ competitiveness, whereas the use of formal protection mechanisms, in particular, patents, trademarks and geographical indications, negatively impacts on competitiveness. The size and innovation profile of the company intermediates the influence of IPR protection on its competitiveness.
Most companies develop technologies in order to improve their competitiveness in the market and patent them around the world to protect their intellectual property (Park, Lee, & Jun, 2015). The competitive power of a company depends therefore on the technologies it develops (Banerjee, 2014).
The management of Intellectual Property (IP), especially in the form of patents, has garnered increasing importance to small and medium-sized technology companies, which adopt many different strategies to explore and exploit knowledge, from research and development (R&D) to technology commercialization (Kay, Youtie, & Shapira, 2014). Companies look for an effective IP management strategy which allows them to maximize returns on their investments in R&D aimed at developing new technologies and innovative products, processes and services, and to protect and possibly improve their competitiveness (Kay et al., 2014). Bos, Broekhuizen, and Faria (2015) suggest that companies can achieve competitive advantages only by effectively appropriating value from protecting their innovation activities from use by competitors.
The strategic management of Intellectual Property Rights (IPRs) is particularly important in the academic context because the inventions generated here, although typically underdeveloped, are often at the frontier of scientific breakthroughs (Colyvas et al., 2002), with many and varied risks associated to the validation, industrialization and commercialization of these inventions (Munari, Pasquini, & Toschi, 2015).
Sophisticated investors such as venture capitalists (VCs) may be reluctant to invest in these ventures due to high transaction costs, information asymmetries (at least in the early stages) regarding the firm's market value and its potential growth, and the high risks associated to the uncertainty of its commercial potential (Gubitta, Tognazzo, & Destro, 2015). This situation sometimes leads to a funding gap to support technology transfer activities and Academic Spin-Offs (ASOs)1 (Munari & Toschi, 2014). However, high competition and rapid development of technologies have attracted growing interest from governments in fostering the establishment of closer relations between universities and industry, to facilitate effective research and technology transfer (Teixeira & Mota, 2012).
It is not yet clear how companies (including ASOs) choose intellectual property protection mechanisms in open innovation and how this choice affects their performance/competitiveness (Stefan & Bengtsson, 2017). Patents are the protection mechanism that attracts the most attention in management research (Candelin-Palmqvist, Sandberg and Mylly, 2012; Levitas & McFadyen, 2009; McGahan & Silverman, 2006). In contrast, mechanisms such as copyrights, lead time or secrecy have received much less attention in the literature (Bos et al., 2015). Additionally, some studies suggest that smaller companies, most notably, technological startups (Block, De Vries, Schumann, & Sandner, 2014), tend to choose informal protection mechanisms due to the lack of resources (e.g., Olander, Vanhala, & Hurmelinna-Laukkanen, 2014).
In this context, the present study aims primarily to assess the impact of IPR protection mechanisms and types on the competitiveness of ASOs located in science and technology parks and incubators. Additionally, it intends to uncover the reasons behind the decision to adopt formal or informal protection mechanisms, and how such choices affect firm performance/competitiveness.
In terms of structure, “IPR protection and competitiveness: literature review” section presents a literature review on the issue of IPR protection and competiveness. Then, “Methodology” section briefly describes the study's methodological underpinnings. The empirical results are detailed in “Empirical Results” section. Finally, “Discussion and conclusions” section concludes the study, highlighting the main outcomes, limitations and avenues for future research.
IPR protection and competitiveness: literature reviewIPR protection and competitiveness have been connected in the literature since the 1970s, although more prevalently during the late 1970s and 1980s, when IPR protection started to be framed as a competitiveness issue (Muzaka, 2013).
Currently, IPR protection, more than being used by companies as a tool to attract investment (Glass & Saggi, 2002; Smarzynska, 2004) and create wealth (Schneider, 2005), has been recognized as a source of competitive advantage (Singh, 2015). IPR protection prevents firm innovations from being exposed without any kind of protection and explored by competitors, giving the companies a portion of market power and, sometimes, monopoly power, materialized in the exclusive use and commercialization of their innovations, since they are legally protected from potential violations (Sey, Lowe, & Poole, 2010).
The type of IPR protection used seems to help companies to create and sustain competitive advantage in several ways (Reitzig, 2004a): it can provide a temporary technological lead (incumbency advantages), protect strong brands, help to establish a standard in the market, and to protect key components, thus increasing switching costs.
The use of patents by companies can provide a temporary technological lead and shape industry structure (Reitzig, 2004a). Patenting of incumbent products may discourage the establishment of new businesses, operating as a barrier to competitors in the market, especially in sectors whose development and approval are more time-consuming and costly (e.g., health care sectors) (Calabrese, Baum, & Silverman, 2000). At the same time, it favors the development of economies of scale by the companies that own the patent. In order to sustain competitive advantage, companies can opt to use a patent fence, which consists in protecting not only the core invention of the product developed but also a set of substitutes, which could be easily built by competitors (Cohen, Nelson, & Walsh, 2000).
Trademarks and geographical indications allow companies to develop products and services with consistent quality which cannot be produced by competitors imitating their distinctive marks (Fisher, 2001). For this reason, they can protect strong brands, forming a promotional advantage (Reitzig, 2004a).
IPR protection can also be used to increase switching costs, by establishing a standard in the market, since technologies developed further are required to fit or be compatible with the standard, or protecting key components required to operate patented technology (Reitzig, 2004a), which gives the company holding the protection a certain market monopoly in the production and commercialization of these components.
IPRs also foster creativity and innovation of businesses, which are a measure of firm performance. They encourage companies to invest in R&D to develop new, innovative products and services, in the expectation of full returns thereof, if the company is granted an appropriate, stricter protection regime of its innovations, with severe legal sanctions for those who attempt to copy or imitate them (Mani & Nelson, 2013); otherwise, the prevalence and scope of innovation most likely decreases. In other words, they operate as a safeguard for creators, innovators and producers, since they feel more at ease to invest time, money and effort on research and development of new technologies and products, knowing that they belong to them even if they are not successful (Singh, 2015).
Hence, IPR protection assumes particular strategic importance for smalls companies, because the success of these companies depends greatly on creativity and innovation of the products and services provided (Singh, 2015). Some of them are dedicated to creating new products, services and processes, while other are specialized in adapting existing technologies to specific market niches. Furthermore, IPR protection also allows these companies to develop innovative business models (Singh, 2015).
Competitiveness has been associated with the IPR protection of radical innovations that introduce technological breakthroughs and contribute to the vertical differentiation of the products and services provided by several companies (Reitzig, 2004a). Prior studies have shown that startups play a key role in the generation of radical innovations (Colombo, Doganova, Piva, D’Adda, & Mustar, 2015). Therefore, an appropriate IPR protection in this type of company can impact on their competitiveness.
Patents and trademarks have been widely used throughout industrial history to obtain competitive advantage (Singh, 2015), as well as business method patents (Vaver, 2006). Patents and trademarks, as well as industrial design and copyrights, seem to be very useful especially in small businesses, in the textile, toy, publishing, biotechnology and retail sectors, among others (Chaudhuri, Goldberg, & Jia, 2003).
Taking the arguments above, we hypothesize that:H1 Companies that protect their assets are more competitive.
The literature has suggested that IPR protection often corresponds to the appropriability problem of knowledge (Greenhalgh & Rogers, 2007). Nevertheless, there are some factors that influence the companies’ choice of (formal or informal) protection mechanisms as an appropriation strategy which allows them to protect an innovation from imitation and achieve innovation returns, thus, improving their competitiveness. According to Leiponen and Byma (2009), the appropriation strategies companies pick are qualitatively different, depending on whether they are small or large companies. In fact, the majority of small and medium enterprises (SMEs) prefer informal protection mechanisms instead of IPR protection because they consider them more familiar, cheaper, and less time-consuming. Moreover, they tend to be considered more effective in some cases,2 mostly because the operating knowledge in this type of company is predominantly tacit (Macdonald, 2003), which, therefore, cannot be converted into coded information (Thomä & Bizer, 2013).
Other reasons for SMEs to use less IPRs than large companies are poor awareness of IPR protection benefits in the business context, the perception of IPR protection as an expensive and complicated process, and greater difficulty in obtaining and enforcing this kind of protection (Lanjouw & Schankerman, 2004; Macdonald, 2004). The literature shows that SMEs have been less successful in patent applications than large companies due the insufficient knowledge of the IP system, lack of information, poorly developed applications, and low access to legal counseling (Sey et al., 2010).
However, owners of small companies do not consider obtaining IPR protection an obstacle to successfully appropriating the returns from their innovations because they only choose IPRs over informal protection mechanisms under specific conditions, wherein acquisition and enforcement costs are insignificant compared to their potential benefits (Thomä & Bizer, 2013). In other words, the decision of small companies to protect IPRs or not seems to be the result of weighting the costs and benefits of formal protection methods.
Several studies have relativized the importance of IPRs as a way of obtaining innovation returns, highlighting lead time, secrecy, and complementary assets as appropriation methods which, in some cases, are more effective than patents (Cohen et al., 2000; Laursen & Salter, 2005). Sey et al. (2010) confirmed that SMEs have chosen to use informal methods to protect their innovations, such as trade secrets, product quality maintenance, customized services and continued innovation, rather than formal IPR protection methods, which have not been used as a competitive advantage. IPR protection is only relevant for the SMEs’ competitiveness if it is considered an integrated approach that takes into account several factors, such as knowledge of the benefits of appropriate IPR protection, access to the proper IPR protection services ensuring effective IPR enforcement, while pursuing other competitive strategies, such as improving the quality of the products and services provided, protection of cultural artifacts, and dissemination of national trademarks (Sey et al., 2010). From this point of view, increasing IP registration and enforcing IPRs per se does not ensure an increase in the SMEs’ competitiveness.
Although the use of informal protection mechanisms in small companies seems to be more profitable in terms of the appropriation of returns from innovation, these appropriation methods are sometimes considered more valuable when they are complemented with some kind of IPR protection (Thomä & Bizer, 2013). This shows that adopting appropriation strategies that results from the combination of different formal and informal protection mechanisms may be advantageous, and that these mechanisms are not mutually exclusive.
According to Thomä and Bizer (2013), apart from the size of the companies, a key factor in choosing formal or informal protection mechanisms, the business context (more innovative or less innovative) seems to be equally important. These authors suggest that the most innovative companies, given their larger investment in R&D, feel a greater need to protect their innovations with patents in order to achieve the returns thereof, differently from companies that invest less in innovation. Large companies seek IPR protection more often due to their increased commitment to R&D and the introduction in the market of radical innovations. In contrast, SMEs, given their greater responsiveness to fast-changing market conditions, usually bet on the incremental improvement of the quality of existing products and services, focusing rather on customer needs (Baldwin & Gellatly, 2003; Mazzarol & Reboud, 2009). As such, IPR protection gets less attention.
Moreover, appropriation strategies also differ depending on the type of innovation considered (Thomä & Bizer, 2013): product innovation or process innovation. These authors found that product innovations tend to be protected using informal methods or also IPRs. In turn, non-protection of process innovations seems to be equally effective as another appropriation strategy.
Taking the arguments above, we hypothesize that:H2 The type of IPR strategy – formal vs. informal – influences the competitiveness of the companies. The size of the company intermediates the influence of IPR protection on its competitiveness. The innovative character of the company intermediates the influence of IPR protection on its competitiveness.
Summing up, there are essentially three factors that influence the choice of IPR protection as an appropriation strategy by companies: the company's size, its innovation profile, and the business context (e.g., region, sector). Despite the importance that size seems to have in the choice of (formal or informal) protection mechanisms as a competitive strategy, the business context where the companies operate, and their innovation profile are equally important. Fig. 1 shows the integrated conceptual framework and the hypotheses to be tested.
MethodologyAim of the study
The study intends specifically to assess the impact of IPR protection mechanisms on the competitiveness of startups. This purpose differs from that of the qualitative studies carried out by Reitzig (2004a, 2004b) and Sey et al. (2010), whose main aims were to explore IPR protection management strategies. It targets academic spin-offs (ASOs), more precisely, startups located in science and technology parks and incubators. Despite the (apparent) importance of science and technology parks and incubators in the process of defining the best IPR management, the topic of IPR management and the extent to which it contributes to ASO performance/competiveness has received little attention in the literature. It is not yet clear which type of intellectual property protection mechanisms these startups choose, if any, and how these choices affect their performance/competitiveness (Stefan & Bengtsson, 2017).
Given that no relevant information is publicly available on this matter, it was necessary to collect information from primary sources, i.e., the companies. We therefore collected information through a survey in line with some authors who have made efforts to discover which appropriation strategies small companies choose (e.g., Leiponen & Byma, 2009; Thomä & Bizer, 2013), and how these strategies have affected firm performance (e.g., Calabrese et al., 2000; Cohen et al., 2000; Laursen & Salter, 2005).
Given our purpose, the most suitable methodology is quantitative analysis (see Creswell, 2014), most notably causality/multivariate econometric techniques, which we detail further ahead, in Section 3.3.
Data gathering processTarget populationDue to time and resources constraints, it would be impossible to include in this analysis all the academic spin-offs (ASOs)/startups located in Portuguese science and technology parks and incubators. Notwithstanding, previous studies (see Teixeira, 2017, chap. 9) show that ASOs are concentrated in four main science and technology parks and incubators located in mainland Portugal: UPTEC, associated to the University of Porto; Instituto Pedro Nunes (IPN) Incubator and TecBIS, associated to the University of Coimbra; TAGUSPARK, associated to the University of Lisbon; and UAlgCria associated to the University of Algarve. Geographically, these four science parks cover all NUTs II regions of mainland Portugal and encompass a set of diversified activities/business sectors.
In order to select the companies to be analyzed, we established a minimum period of 3 years in business in order to be able to get data from the three last years. Additionally, in line with the most recent ‘European Startup Monitor’ (ESM, 2016), we considered only those companies that had been in business for 10 years or less.
Describing the surveyThe survey administered to the companies was built from scratch because there were no surveys developed in this research area that could serve as a model. Nevertheless, it was based on an extensive and updated literature review of the variables under analysis, which meant the survey was devised to be as focused as possible, so as to obtain only the information that was strictly necessary to reach the study's goals. The concern with the survey's brevity was also motivated by the need to achieve a reasonable response rate.
We chose to prepare an online survey3 for several reasons: broadest reach at the lowest possible cost (the means to reach a large number of companies from different geographical locations at almost no cost; quality and reliability of the answers); it allows people to respond when it is most convenient to them, without the influence of the researcher; highest profitability of time (it enables real-time responses monitoring and exporting of the collected information to a spreadsheet).
Considering that the target respondents were Portuguese, the online survey was written in Portuguese.
Data gathering proceduresAlthough the targeted companies were located in science and technology parks and incubators with online websites, the information about these companies was limited to their name, business sector and contacts. For this reason, the process of data collection was very time-consuming, requiring great effort and dedication over four months.
The first phase of data collection was focused on gathering information about the foundation year of all companies located in science and technology parks and incubators, as only those in business for at least 3 years but not more than 10 were to be selected for further analysis. We built 4 databases (one for each park or incubator) containing the following information: company name, business sector, foundation year and contacts. These databases were built with information found on the online websites of the parks or incubators and, by reference, on the websites of the companies themselves, when they existed.
Finding the foundation year of the companies was not an easy task, since such information was, in general, inexistent in the companies’/parks’ or incubators’ websites. For this reason, it was necessary to establish email and phone contacts with the companies in order to obtain this information in a reliable manner.
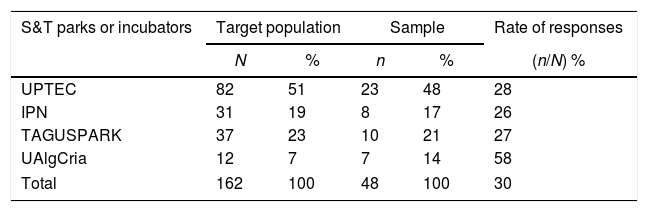
On the 17th February 2016, an email was sent to all relevant companies, in a total of 355 (168 from UPTEC, 57 from IPN, 110 from TAGUSPARK, and 20 from UAlgCria). Only 46 companies responded by email. Consequently, the companies that did not answer the email where contacted by telephone, in order to obtain information about their foundation year. This task was performed over nearly two months and it was completed on 31st March 2016. At the end of the first phase, we obtained the ‘effective’ target population, composed of 162 startups aged 3 to 10 years (82 from UPTEC, 31 from IPN, 37 from TAGUSPARK and 12 from UAlgCria).
In order to harmonize the sector of activity, we used the “Sistema de Informação da Classificação Portuguesa de Atividades Económicas” (SICAE),4 which is an online database that contains permanently updated and harmonized information about the activity code of companies and similar entities. Each of the 162 startups’ activity codes were checked one-by-one. Given that in some cases (17) there was a discrepancy between the company's name found on the websites of the parks or incubators and the name used in its commercial register, no result emerged from the online platform. Again, we contacted the companies by phone in order to solve the discrepancy. Once this was done, we started preparing the online survey as well as the email to send to the companies.
On the 28th April 2016, we sent an email to the 162 companies corresponding to our ‘effective’ target population, asking them to cooperate in the online survey. Several rounds of personal phone contacts were made. At the end of this process, we obtained 48 responses to the survey – 23 from UPTEC, 8 from IPN, 10 from TAGUSPARK and 7 from UAlgCria –, representing an effective rate of response of 30%. The sample is fairly representative by technological infrastructure/location (see Table 1).
Model specificationIn order to complement the descriptive analysis and answer the research question put forward – Do IPR protection mechanisms matter for ASO competitiveness? –, the study resorts to a multivariate econometric model, more specifically, a logistic regression. In concrete, this estimation procedure enables us to assess how the various determinants, most noticeably IPRs, affect the companies’ competitiveness.
According to our theoretical framework (see Fig. 1), IPRs, IPR types and the interaction between IPR mechanisms and the companies’ size and innovation profile are likely to impact on the companies’ competitiveness, taking into account business context (sector and region) and the companies’ human capital endowments.
Our dependent variable ‘Top competitive company versus Non top competitive company’ is a dummy-variable which assumes the value of 1 when the company is classified as top competitive in terms of three main economic indicators: sales per capita, gross value added per capita, and Earnings Before Interest, Taxes, Depreciation and Amortization (EBITDA). We considered the averages of these indicators over the three-year period, 2013–2015. To compute the top companies, we took into account the percentile distribution of the three main indicators and considered the top 25% and top 50%. We thus have 6 distinct indicators for the dependent variable.
As our dependent variable is a dummy, the most suitable estimation model is logistic regression because we cannot expect a normal distribution and we need to interpret the results as probabilities - this would not be possible with a conventional (OLS) estimation technique.5 Therefore we resort to the general framework of probabilistic models.
According to the conceptual model, the ‘propensity of being top competitive’, as mentioned earlier (cf. “IPR protection and competitiveness: literature review” section), depends on a set of determinants, most notably, IPR mechanisms used, the type of IPR mechanism, the interaction between the use of IPRs and the companies’ size and innovativeness, human capital, R&D intensity, and business context (region and sector).
Rewritten in terms of the odds (ratio of the probability that the event occurs to the probability of the event not occurring) of an event occurring, the logit model becomes:
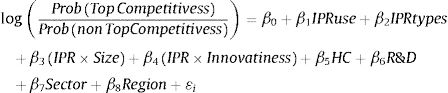
The logistic coefficient can be interpreted as the change in the log odds associated with a one-unit change in the independent variable. Then, e raised to the power βi is the factor by which the odds change when the ith independent variable increases by one unit. If βi is positive, this factor will be greater than 1, which means that the odds are increased; if βi is negative, the factor will be less than one, which means that the odds are decreased. When βi is 0, the factor equals 1, which leaves the odds unchanged.
The next section details the empirical results obtained through the statistical treatment of the gathered data.
Empirical resultsThe 48 respondent companies operate chiefly in computer consulting and programming-related activities (14 companies, 29% of the total), architecture, engineering and related technical activities (11 companies, 23%), and R&D and information-related activities (11 companies, 23%), are small (employing, on average, approximately 9 individuals), with reasonable business experience (they have been in business for 6 years, on average), highly intensive in knowledge and technology (more than one third of the companies present a ratio R&D to turnover above 50%), and present a highly educated labor force (about 10% of their collaborators have a PhD).
Regarding intellectual property rights, we found that 73.6% of these companies use informal protection mechanisms, while 49.6% use formal protection mechanisms. In more detail, the most common informal protection mechanisms used are complementary assets and lead time, whereas the most used formal protection mechanism are the copyright and rights related with copyright and the trademarks (see Fig. 2).

Regardless of the type of formal and informal IPR protection mechanisms, the companies justify their use based on their effectiveness in terms of protection (see Fig. 3). This is particularly the case of patents (83% of the companies that use this IPR state that it is due to its effectiveness), trademarks (76%), and geographical indications (73%). Simplicity in use and implementation is particularly important for 63% of the companies that use industrial designs. Low cost is only important for a reduced number of companies, and to a greater extent for companies that use trade secrets (21%), copyright and rights related to copyright (20%), and trademarks (19%).
 and reasons for choosing each IPR mechanism (in % of the total number of companies that use the mechanism).")
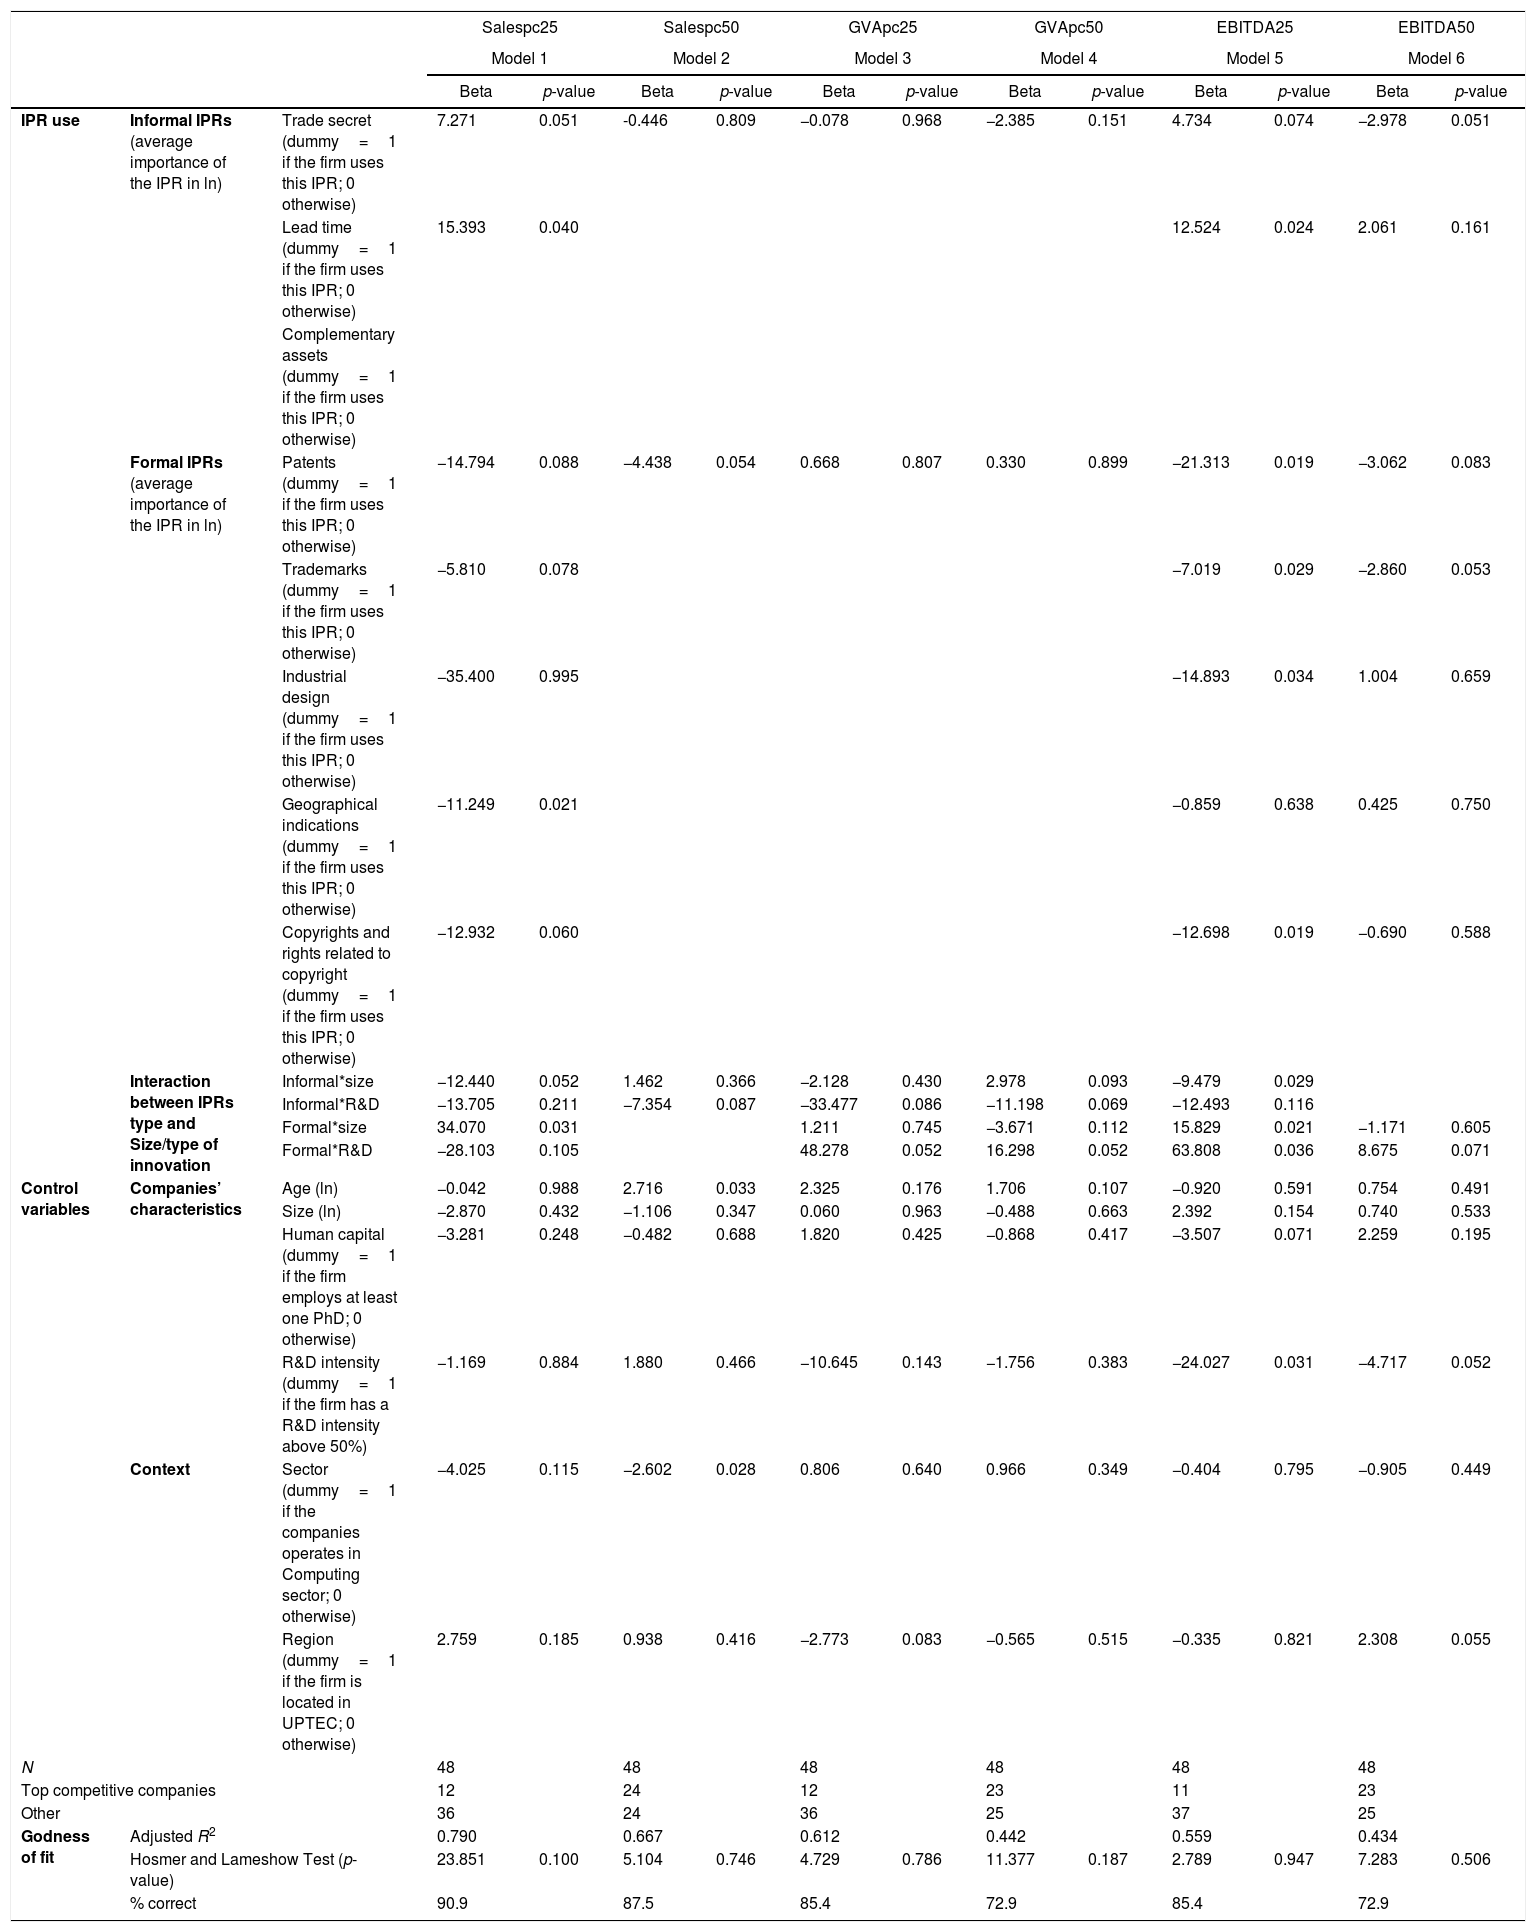
Given that there were some high correlations between the independent variables, namely lead time and complementary assets, the estimated models included these variables separately to avoid multicollinearity issues. Table 2 presents a selection of the estimated econometric specifications.6
Logistic estimations (dependent variable: log odds of competitiveness).
| Salespc25 | Salespc50 | GVApc25 | GVApc50 | EBITDA25 | EBITDA50 | |||||||||
|---|---|---|---|---|---|---|---|---|---|---|---|---|---|---|
| Model 1 | Model 2 | Model 3 | Model 4 | Model 5 | Model 6 | |||||||||
| Beta | p-value | Beta | p-value | Beta | p-value | Beta | p-value | Beta | p-value | Beta | p-value | |||
| IPR use | Informal IPRs (average importance of the IPR in ln) | Trade secret (dummy=1 if the firm uses this IPR; 0 otherwise) | 7.271 | 0.051 | -0.446 | 0.809 | −0.078 | 0.968 | −2.385 | 0.151 | 4.734 | 0.074 | −2.978 | 0.051 |
| Lead time (dummy=1 if the firm uses this IPR; 0 otherwise) | 15.393 | 0.040 | 12.524 | 0.024 | 2.061 | 0.161 | ||||||||
| Complementary assets (dummy=1 if the firm uses this IPR; 0 otherwise) | ||||||||||||||
| Formal IPRs (average importance of the IPR in ln) | Patents (dummy=1 if the firm uses this IPR; 0 otherwise) | −14.794 | 0.088 | −4.438 | 0.054 | 0.668 | 0.807 | 0.330 | 0.899 | −21.313 | 0.019 | −3.062 | 0.083 | |
| Trademarks (dummy=1 if the firm uses this IPR; 0 otherwise) | −5.810 | 0.078 | −7.019 | 0.029 | −2.860 | 0.053 | ||||||||
| Industrial design (dummy=1 if the firm uses this IPR; 0 otherwise) | −35.400 | 0.995 | −14.893 | 0.034 | 1.004 | 0.659 | ||||||||
| Geographical indications (dummy=1 if the firm uses this IPR; 0 otherwise) | −11.249 | 0.021 | −0.859 | 0.638 | 0.425 | 0.750 | ||||||||
| Copyrights and rights related to copyright (dummy=1 if the firm uses this IPR; 0 otherwise) | −12.932 | 0.060 | −12.698 | 0.019 | −0.690 | 0.588 | ||||||||
| Interaction between IPRs type and Size/type of innovation | Informal*size | −12.440 | 0.052 | 1.462 | 0.366 | −2.128 | 0.430 | 2.978 | 0.093 | −9.479 | 0.029 | |||
| Informal*R&D | −13.705 | 0.211 | −7.354 | 0.087 | −33.477 | 0.086 | −11.198 | 0.069 | −12.493 | 0.116 | ||||
| Formal*size | 34.070 | 0.031 | 1.211 | 0.745 | −3.671 | 0.112 | 15.829 | 0.021 | −1.171 | 0.605 | ||||
| Formal*R&D | −28.103 | 0.105 | 48.278 | 0.052 | 16.298 | 0.052 | 63.808 | 0.036 | 8.675 | 0.071 | ||||
| Control variables | Companies’ characteristics | Age (ln) | −0.042 | 0.988 | 2.716 | 0.033 | 2.325 | 0.176 | 1.706 | 0.107 | −0.920 | 0.591 | 0.754 | 0.491 |
| Size (ln) | −2.870 | 0.432 | −1.106 | 0.347 | 0.060 | 0.963 | −0.488 | 0.663 | 2.392 | 0.154 | 0.740 | 0.533 | ||
| Human capital (dummy=1 if the firm employs at least one PhD; 0 otherwise) | −3.281 | 0.248 | −0.482 | 0.688 | 1.820 | 0.425 | −0.868 | 0.417 | −3.507 | 0.071 | 2.259 | 0.195 | ||
| R&D intensity (dummy=1 if the firm has a R&D intensity above 50%) | −1.169 | 0.884 | 1.880 | 0.466 | −10.645 | 0.143 | −1.756 | 0.383 | −24.027 | 0.031 | −4.717 | 0.052 | ||
| Context | Sector (dummy=1 if the companies operates in Computing sector; 0 otherwise) | −4.025 | 0.115 | −2.602 | 0.028 | 0.806 | 0.640 | 0.966 | 0.349 | −0.404 | 0.795 | −0.905 | 0.449 | |
| Region (dummy=1 if the firm is located in UPTEC; 0 otherwise) | 2.759 | 0.185 | 0.938 | 0.416 | −2.773 | 0.083 | −0.565 | 0.515 | −0.335 | 0.821 | 2.308 | 0.055 | ||
| N | 48 | 48 | 48 | 48 | 48 | 48 | ||||||||
| Top competitive companies | 12 | 24 | 12 | 23 | 11 | 23 | ||||||||
| Other | 36 | 24 | 36 | 25 | 37 | 25 | ||||||||
| Godness of fit | Adjusted R2 | 0.790 | 0.667 | 0.612 | 0.442 | 0.559 | 0.434 | |||||||
| Hosmer and Lameshow Test (p-value) | 23.851 | 0.100 | 5.104 | 0.746 | 4.729 | 0.786 | 11.377 | 0.187 | 2.789 | 0.947 | 7.283 | 0.506 | ||
| % correct | 90.9 | 87.5 | 85.4 | 72.9 | 85.4 | 72.9 | ||||||||
The goodness-of-fit indicators show that all models are adequate: both the R2 and the percentage of observations estimated correctly are very high; moreover, the Hosmer and Lemshow test indicates that the models represent the reality well.
The estimation results reveal that, in general, IPR protection is not positively related to the companies’ competitiveness, at least directly, which contradicts our Hypothesis 1 (Companies that protect their assets are more competitive). Indeed, when the estimated coefficient is statistically significant (Model 2, in Table 2), the use of formal protection mechanisms impacts negatively on the companies’ competitiveness. Additionally, informal IPR mechanisms indirectly (through R&D) negatively impact on companies’ competitiveness.
When we discriminate the IPR protection mechanism used by companies by type we obtained rather varied results. In general, we found that the use of informal protection mechanisms, most notably, trade secrets and lead time, foster the companies’ competitiveness, whereas the use of formal protection mechanisms, in particular, patents, trademarks and geographical indications, negatively impact on that same competitiveness (see Table 2, Models 1, 5 and 6).
These results support Hypothesis 2, The type of IPR strategy – formal vs. informal – influences the competitiveness of the companies.
In relation to the interaction variables, the estimation results convey that the impact of informal protection mechanisms on the companies’ competitiveness is higher the smaller the company's size.7 Regarding the formal protection mechanisms (see Table 2, Models 1 and 5), their impact on the companies’ competitiveness is stronger the larger the company. Such results corroborate Hypothesis 3, The size of the company intermediates the influence of IPR protection on its competitiveness.
Lastly, informal protection mechanisms tend to increase the companies’ competitiveness the less R&D-intensive the company (see Models 2–4, in Table 2). In contrast, the higher the R&D intensity of a company, the stronger the positive impact of formal protection mechanisms on its competitiveness (see Models 3–6, in Table 2). This confirms Hypothesis 4, The innovation profile of the company intermediates the influence of IPR protection on its competitiveness.
Discussion and conclusionsThe analysis of the purposes related to IPR mechanisms by respondent companies revealed that they protect their assets mainly to gain competitive advantage, as sustained by the most recent literature (see Singh, 2015). Validating other previous studies (e.g., Glass & Saggi, 2002; Smarzynska, 2004), the companies reported that the attraction of investment was also an essential purpose that led them to IPR protection. Equally important for academic spin-offs was the intention to enter the international market and to exclusively use and commercialize a product or service. Additionally, we found that the most competitive companies are those that attribute lower importance to attracting funding and investment and higher importance to obtaining market power, exclusively use and commercialize a product or service, gaining competitive advantage, protecting an innovation from imitation and exploitation by competitors, increasing market competitiveness, increasing market share, entering international markets. This suggests that the most competitive academic spin-offs (ASOs) effectively recognize the importance of IPR protection to gain competitive advantage and not only to access or obtain additional financial sources.
Regardless of the type of IPR protection mechanisms (formal or informal), the companies justify their use based on their effectiveness in terms of protection, particularly in the case of patents – as expected for small companies that invest heavily in R&D (Thomä & Bizer, 2013) such as ASOs – and trademarks (Singh, 2015), but also in the case of geographical indications. Furthermore, we found that simplicity in use and implementation is particularly important for companies that use industrial designs, whereas low cost is the least important reason when deciding to protect their IPRs.
The results of the present study have established that, in general, the most competitive companies are those that use less formal IPR protection. Moreover, when we discriminate the IPR protection mechanisms by type, we found that the use of informal protection mechanisms, most notably, lead time and trade secrets, fosters the companies’ competitiveness, whereas the use of formal protection mechanisms, in particular, patents, trademarks and geographical indications, negatively impacts on that same competitiveness. Such results seem at odds with extant literature that highlights the importance of formal IPR protection mechanisms, especially in small businesses (Chaudhuri et al., 2003), and their extensive use throughout industrial history to obtain competitive advantage (Singh, 2015). Thus, in line with Sey et al. (2010), the most competitive academic spin-offs surveyed tend to use informal instead of formal IPR protection mechanisms. Summing up, the type of IPR strategy influences the companies’ competitiveness.
We further discovered that the impact of informal protection mechanisms on the companies’ competitiveness is higher the smaller the company's size. This finding is in line with other authors (e.g., Thomä & Bizer, 2013): the use of informal protection mechanisms by small companies is more profitable in terms of the appropriation of innovations returns. In contrast, the impact of formal protection mechanisms on the companies’ competitiveness is stronger the larger the company. Similarly, and in line with Thomä and Bizer (2013), the higher the R&D commitment to achieve the returns from innovation, the stronger the impact of formal protection mechanisms on the ASOs’ competitiveness. Hence, the use of formal protection mechanisms seems to be an added value to high R&D-intensive companies. In contrast, the results suggest that the impact of informal protection mechanisms is higher for the least R&D-intensive companies. This latter evidence seems to be in line with studies (e.g., Baldwin & Gellatly, 2003; Mazzarol & Reboud, 2009) that show that small companies are less R&D-intensive and, therefore, opt for more informal protection mechanisms.
This research study has some limitations that may constitute avenues for further research. The most obvious is related with the reduced number of responses and the focus on a unique type of companies, the ASOs. Although the sample is representative of the population, it would be interesting to include not only ASOs but other types of startup companies in the analysis. Additionally, competitiveness was assessed over a very small period of time (three years). The consideration of a longitudinal analysis, involving a longer time period, and resorting to panel data techniques would certainly enrich the analysis.
Academic Spin-Offs (ASOs) are new ventures generated within a university setting and based on technology derived from academic research (Rasmussen & Borch, 2010).
Only small companies that invest heavily in R&D and have partnerships with universities are more inclined to consider patents the most effective protection tool (Thomä & Bizer, 2013).
The Portuguese version of the online survey is available at https://docs.google.com/forms/d/1duIJM1-uIp2I8ctAYx_c13R1lvPvoCF5OEi_RR-Lwoc/viewform.
Available in http://www.sicae.pt/Consulta.aspx.
The distribution of errors is not normal and the predicted values cannot be interpreted as probabilities – they are not constrained to fall in the interval between 0 and 1.
The full estimations for the top 25% and 50% more competitive companies according to the three competitiveness indicators considered are available from the corresponding author upon request.
Considering the top 50% most competitive companies according to the average GVA per capita, we obtained the opposite result, although at the limit of the statistical significance (p-value=0.093) (see Table 2, Model 1B).
articles