


A number of studies focus on the effects of open innovation on firm performance. However, in our view, previous contributions suffer from two main limitations: at first, there is still no homogeneity in the proposition of what “firm performance” is, according to extant literature. In addition, we see a heterogeneity of implications for the relationship between openness and performance, since there is still no consensus among authors on whether the relationship between openness and firm performance is positive, negative or non-linear.
We address this issue through an empirical analysis of a cross-national unbalanced panel data of European firms listed in the five major European markets in the years 2008–2013. We seek to sort the impact of the level of inbound openness, derived by the amount invested in internal development versus the external acquisition of intangible assets on firm performance according to three dimensions: economic performance, measured as the amount of firm turnover; firm financial performance, measured with shares value; and human resources performance, measured as the level of employment.
Results of panel data regression show that the effects of both internal development and external acquisition are positive and significant across different dimensions, but their output varies in terms in magnitude and distribution both variables are positively and significantly correlated with firm turnover, and that their effect on the latter is almost equal. In addition, we find that only internal development is positively and significantly correlated with the other two dimensions of performance, once we control for firm-specific time trends. Once we control for relative size of firms in the sample, we see that the effect of openness is more spread out across different class sizes, while the effect of internal development of intangibles influences the economic performance only for larger firms, and increases employment only for relatively smaller firms, while it has no effect on the financial side of performance.
Una serie de estudios centrados en los efectos de la innovación abierta en el desempeño de la empresa. Sin embargo, en nuestra opinión, las contribuciones anteriores sufren sobretodo de dos limitaciones principales: en principio, todavía, no tenemos ninguna homogeneidad en lo que podemos definir como “desempeño de la empresa” basándonos en los escritos existentes. Además, notamos una heterogeneidad de conceptos y opiniones distintas sobre la relación entre apertura y rendimiento, ya que todavía no hay ningún consenso entre los autores sobre si la relación entre la apertura y el desempeño de la empresa pueda ser algo positivo, negativo o discontinuo.
Vamos así profundizando este tema a través de un análisis empírico basado en la comparación de los datos de las empresas europeas que figuran en los cinco principales mercados europeos en los años 2008-2013. Intentamos así de clasificar el impacto del nivel de apertura entrante, derivado del monto invertido para el desarrollo interno -por un lado- y la adquisición externa de bienes intangibles en el rendimiento de la empresa -en el otro- de acuerdo con tres dimensiones: Desempeño económico, medido como la cantidad de rotación de la empresa; desempeño financiero de la empresa, medido con el valor de las acciones; desempeño de los recursos humanos, medido como el nivel de empleo.
Los resultados de la elaboración de los datos de nuestro panel muestran que los efectos tanto del desarrollo interno como de la adquisición externa son positivos y significativos en varias y distintas dimensiones, pero su producción puede variar en términos de cantidad y distribución. Ambas las variables se correlacionan positivamente y significativamente en cuanto a la rotación de la empresa y su efecto sobre el último es casi lo mismo. Además, encontramos que solo el desarrollo interno se correlaciona positivamente y significativamente con las otras dos dimensiones del desempeño de la empresa una vez que controlamos las tendencias de tiempo específicas de la empresa misma. Una vez que controlamos el tamaño relativo de las empresas consideradas, nos damos cuenta que el efecto de la apertura está más extendido en diferentes tamaños de clase, mientras que el efecto del desarrollo interno de intangibles influye en el rendimiento económico solo para las empresas más grandes y aumenta el empleo solo para las empresas relativamente más pequeñas; mientras que no tiene ningún efecto en el lado financiero de ningún tipo empresa.
Open innovation (OI) is one of the hottest topics in management literature in the past decade. According to Scopus dataset, ever since the introduction of the term in 2003, over 3600 articles have been published on the topic. Following the original definition, OI represents a new model to pursue activities where “[…] firms commercialize external (as well as internal) ideas by deploying outside (as well as in-house) pathways to the market”. (Chesbrough, 2003). Enkel, Gassmann, and Chesbrough (2009) distinguish three dimensions of open innovation: “outside-in”, “inside-out” and “coupled”. In particular, the outside-in (inbound) process aims at enriching the company knowledge capital by internalizing externally developed technologies. Firms search for valuable sources of knowledge in their environment, leveraging on potential sources of ideas arising from other players, i.e. suppliers, customers, competitors or universities. Drivers of acquisition of external assets include lower cost of development, lower risks and faster time-to-market (Wallin & Von Krogh, 2010).
Building on the resource-based view of the firm (Barney, 1991), We join the current debate in OI literature by seeking to answer to the following question: How is inbound openness related with firm performance?
So far, a number of studies focused on the effects of OI on firm performance (Chiang & Hung, 2010; Hung & Chou, 2013; Lichtenthaler, 2009). However, OI literature is yet to find consensus in defining the determinants of openness, as well as in sorting its effect on performance. Extant studies present three main limitations in determining such relationship: first, we believe there is a bias in the measurement of firm level of openness in extant studies, since they mostly rely on self-reported measures of openness derived from secondary data. In addition, there is no consensus in the definition of what “firm performance” is in open innovation studies. Finally, results of extant studies on the relationship between inbound openness and performance are heterogeneous: multiple authors argue the presence of a positive relationship between openness and performance (Nitzsche, Wirtz, & Goettel, 2016; Rass, Dumbach, Danzinger, Bullinger, & Moeslein, 2013), while others argue there is a negative or non-linear relation between such variables (Laursen & Salter, 2006; Love, Roper, & Bryson, 2011; Suh & Kim, 2012).
We seek to contribute to extant literature by proposing an empirical analysis of the effects of openness – focusing on the nature of acquired intangible assets versus internally developed assets – on firm performance, measured according to three dimensions: (1) Economic performance – through the value of turnover; (2) Financial performance – the value of firm stock prices; and (3) Human capital performance – the level of firm employment. To do so, we use an unbalanced panel data of 329 European companies listed in the five major markets – United Kingdom, Germany, France, Italy and Spain, over the period 2008–2013.
Results show that the effects of both internal development and external acquisition are positive and significant across different dimensions, but their output varies in terms in magnitude and distribution: both variables are positively and significantly correlated with turnover, and their effect is almost equal. In addition, we find that only development is positively and significantly correlated with the other two dimensions of performance, once we control for firm-specific time trends. Once we control for relative size of firms in the sample, we see that the effect of openness is more spread out across different class sizes, while the effect of development of intangibles influences the economic performance only for larger firms, and increases employment only for relatively smaller firms, while it has no effect on the financial side of performance.
The structure of the paper is the following: in the next paragraph, we will briefly review the OI literature to sort out how performance is measured by extant contributions and the direction of the relationship between openness and performance proposed by scholars. Then, we introduce the research design and methodology used in our study. In the findings section, we present the results of the econometric analysis. Finally, we list the article's contributions and implications for academics and professionals in the field, we address the limitations of the study and include suggestions for further research.
Literature reviewOpen innovation and performanceHow is open innovation measured?Ever since the introduction of the term “open innovation” (Chesbrough, 2003), a number of studies focused on the effects of “openness” on firm performance. The seminal contribution in this OI topic is Laursen and Salter's (2006) article, where the authors address the role of openness in determining firm's innovation performance. They introduce two variables: search breadth – the number of external sources the firm relies on in conducting innovation – and search depth – the extent on which firms deeply rely on each of these sources. They operationalize the two measures by analyzing the level of interaction firms have with various categories of external actors, including: market sources, institutional sources, specialized sources, or other sources. They find that both indicators have a curvilinear relationship with innovation performance.
The same indicators have been widely adopted by subsequent studies (including Bogers & Lhuillery, 2011; Chiang & Hung, 2010; Vahter, Love, & Roper, 2014), becoming the de facto standard measures to evaluate openness.
These indicators bring an effective and comparable measure to evaluate the firm level of openness, i.e. the organizational propensity toward the external environment. However, they are self-reported and subjective, thus failing to consider the actual investments in external assets conducted by the firm. So far, extant literature has focused on the propensity to cooperate with various stakeholders, without measuring the value of such transactions. In our view, more objective measures are required to evaluate the impact of acquired assets over performance. Since the choice of development of assets or their acquisition represents alternative choices, such measures should allow for comparisons between the effects of externally acquired and internally developed assets on performance.
How is firm performance measured?Starting from Laursen and Salter's (2006) contribution, a number of studies have tried to address the relationship between openness and performance. However, various authors have so far used the same label – performance – to measure different dimensions such as: firm's performance (Zubielqui, Jones, & Lester, 2016; Rass et al., 2013), Research & Development (R&D) performance (Suh & Kim, 2012), firm's success (Nitzsche et al., 2016), firm growth (Love et al., 2011), innovativeness/innovation performance (Chen, Chen, & Vanhaverbeke, 2011; Egbetokun, 2015; Spithoven, Frantzen, & Clarysse, 2010) and product/NPD performance (Gesing, Antons, Piening, Rese, & Salge, 2015; Praest Knudsen & Bøtker Mortensen, 2011).
We list the number of extant quantitative studies which address the relationship between openness and performance – with particular attention to the variables used in the analysis – in Table 1.
Extant literature contributions on openness and performance.
| Authors | Year | Sample | Dependent variable | Independent variables | Control variables | Moderating variables |
|---|---|---|---|---|---|---|
| Hwang, J; Kim, E; Kim, S | 2009 | - Large-scale survey | 1. Technologically new product innovation, | 1. Total network (TOTALNET), | ||
| - 157 OSS Korean company | 2. Technologically improved product, | 2. Domestic network (DOMNET), | ||||
| - 91 respondents, 86 accepted | 3. Technological process innovation | 3. Global network (GLOBNET), | ||||
| - Logistic regression | 4. State-Supported Network (STATESUP), | |||||
| 5. Outside Developer Network (COMMU), | ||||||
| 6. Code Developer Weight (COREDEV), | ||||||
| 7. Market Structure (CR3), | ||||||
| 8. Age (AGE), | ||||||
| 9. Size (SIZE and SIZE^2) | ||||||
| Stam, W | 2009 | - Large-scale survey | 1. Innovative performance – n. of new products introduced by the firm | 1. Community participation – 5-point Likert scale | 1. Firm size – log of Full Time Employees | |
| - OSS firms in the Netherlands | 2. Financial performance – self-reported measures of firms’ financial performance relative to competitors: sales growth, market share, gross profits, and net profit margin. | 2. R&D Intensity – share of R&D investments over previous years’ sales | 2. Firm age – log of years | |||
| - 125 firms involved, 121 responses from 90 firms received (72% response rate) | 3. OSS Specialization – % of revenues generated from OSS | |||||
| 4. OSS Projects – n. of projects | ||||||
| 5. Self-initiated OS projects – % of projects started from the focal firm | ||||||
| Wincent, J; Anokhin, S; Boter, H | 2009 | - Focus on Swedish small-firm networks | 1. Network innovative performance, 1–7 Likert Scale | 1. Network continuity (% of directors with >1-year continuity) | 1. Financial indicators, | |
| - 53 networks sample | 2. Size of board, | |||||
| - Industries: engineering, food, health, tourism, wood, telecommunications, IT | 3. Network age, | |||||
| 4. Competence diversity within the board, | 1. Network size (n. of firms in the network each year) | |||||
| 5. Frequency of meetings, | ||||||
| 6. Board independence, | ||||||
| 7. Board compensation | ||||||
| Chiang, YH; Hung, KP | 2010 | - Large-scale questionnaires | 1. Incremental innovation performance | 1. Search breadth and depth | 1. Market potential | |
| - 800 randomly selected Taiwanese electronic product manufacturing companies | 2. Radical innovation performance | 2. Technological turbulence | ||||
| - 220 valid responses (27%) in phase 1. | 3. R&D intensity | |||||
| - 184 effective responses (23%) after phase 2 | 4. Company size (as a surrogate) | |||||
| Faems, D; de Visser, M; Andries, P; Van Looy, B | 2010 | - Community Innovation Survey, 2005 | 1. Diversity of Technology Alliance Portfolio | 1. Internal innovation efforts, | 1. Industry, | |
| - 2075 Belgian manufacturing firms, 888 respondents (42.8% response rate). | 2. Product innovation performance, | 2. Firm size, | ||||
| - 526 selected firms in the final sample | 3. Financial performance, | 3. If the firm is part of a divisional entity, | ||||
| 4. Personnel costs in value added, | 4. Past financial performance | |||||
| 5. Profit margin | ||||||
| Spithoven, A; Frantzen, D; Clarysse, B | 2010 | - CIS dataset | 1. Research intensity (LRDI) – log of R&D/Sales; | 1. Knowledge externalities (KEXT) – importance of different interfirm linkages (KEXT ^ if) and inter-organizational linkages (KEXT ^ io) | 1. CRES – complex research, ratio between information sourced from universities, government and conferences over all information sources | |
| - Two stratification variables: (1. the number of employees (as the average of 1998, 1999, and 2000) as an indication of size; and (2) the sector the enterprise belonged to | 2. Innovative revenue (LIREV) – log of new or innovative products/Sales; | 2. Research cooperation (COOP), dummy variable of interfirm cooperation (COOP ^ if) and inter-organizational cooperation (COOP ^ io) | 2. PROC – dummy variable for process innovation | |||
| 3. Growth in revenue (GREV) – logSales^2000-logSales^1998. | 3. Appropriability (APPR), dummy variable measuring the degree on which the firm pursues strategic protection | 3. LHEI – log of share of employees with higher education | ||||
| - Belgium | 4. LEXI – log of share ofexports over revenues | |||||
| - 4482 firms sample, 2035 responses were received, containing both innovating (1310) and non-innovating (725) firms | 5. LSIZE – log of number of employees | |||||
| - 1987 firms final sample | 6. GRMS – dummy variable for “mother” or “subsidiary” firm | |||||
| 7. Industry-specific dummy variables, five sectors: | ||||||
| - ISUP – supplier-dominated | ||||||
| - ISCL – scale-intensive | ||||||
| - ISPS – specialized suppliers | ||||||
| - ISCB – science-based | ||||||
| - IINF – information intensive | ||||||
| Bogers, M; Lhuillery, S | 2011 | - Swiss innovation survey, 1991–1993 | 1. Product innovation-related variables (R&D Prod, Manufacturing Prod, Marketing Prod) | 1. Customers, Suppliers, Competitors, Group members (part of the same conglomerate), | 1. Appropriation, for both product and process innovation; | |
| - 659 observations | 2. Process innovation-related variables (R&D Proc, Manufacturing Proc, Marketing Proc) | 2. PROs (including universities of applied sciences, universities and public research institutes) | 2. Size; | |||
| 3. Consulting (also including private research institutes), for both product and process innovation. | 3. Group; | |||||
| 4. Price competition; | ||||||
| 5. Non-price competition; | ||||||
| 6. Duration of innovative project; | ||||||
| 7. Financial constraints; | ||||||
| 8. Diversification; | ||||||
| 9. Industry | ||||||
| Mention, AL | 2011 | - CIS survey, years 2002–2004 | 1. Innovation novelty – binary variable. Its value is 1 when firms do introduce innovations that are new to the market and is worth 0 when innovations are only new to the firm. | 1. Co-operation practices: market-based, science-based, intra-group co-operation and co-opetition practices. | ||
| - 1052 service firms in Luxembourg | Each type of co-operation is a binary variable and receives the value one if co-operation has occurred with at least one partner of the group. | |||||
| Pullen, AJJ; de Weerd-Nederhof, PC; Groen, AJ; Fisscher, OAM | 2012 | - 751 Dutch companies in medical devices (complete population) | 1. Innovation performance – 5 items measured on a 7-point Likert scale | Network characteristics – 1. Goal complementarity, 2. Fairness trust, 3. Reliability trust, 4. Resource complementarity and 5. Network position strength | ||
| - up to 250 full time employees | ||||||
| - 105 companies identified | ||||||
| - 97 available for study | ||||||
| - 60 final sample, response rate 61.9% | ||||||
| Segarra-Cipres, M; Bou-Llusar, JC; Roca-Puig, V | 2012 | - Spanish survey on business strategies (ESEE) 2003–2006 | 1. Firm's innovation outcome (RDO) – N. of new products, patents and utility models registered by the firm | 1. Contribution of external sources – technological alliances with customers, suppliers, competitors and universities, joint ventures and hiring R&D employees with and without R&D experience | 1. Firm size (LGS) – log number of employees, | |
| - Two groups: 1. Firms with more than 200 employees, and 2. Firms with 10 to 200 employees | 2. Firm's age (LGA) – log of years, | |||||
| - 2.188 firms surveyed | 3. Mean R&D in the last two years (MRDO) | |||||
| - 1277 firms sample, of which 362 innovative | ||||||
| Barge-Gil, A | 2013 | - PITEC dataset | 1. Percentage of sales obtained in the last year of the period of analysis, from products new to the market, introduced in the previous three years (LNEWMK) | Openness strategy – 4 dummy variables: | 1. Firm size | |
| - Spanish manufacturing firms | 1. Closed – no collaborative or inbound OI links | 2. R&D intensity | ||||
| - 2004–2008 | 2. Semi-open – new products were obtained mainly by the enterprise on its own | 3. Sector | ||||
| 3. Open – new products were achieved mainly through cooperation with other organizations | 4. Export behavior | |||||
| 4. Ultra-open – new products are the result predominantly of the efforts of third parties | 5. Obstacles to innovation | |||||
| 6. Belonging to a group | ||||||
| 7. Market share | ||||||
| 8. Appropriability conditions | ||||||
| Berchicci, L | 2013 | - Surveys of Italian Manufacturing firms | 1. Share of innovative sales – share of turnover from new or significantly improved products. | 1. External R&D – percentage of outsourced R&D activities over total R&D activities. Percentage value. | 1. Size – total number of employees. Log function. | |
| - 1992–2004 original sample, 2001–2004 observations considered for analysis (covering 1998–2003) | Percentage value | 2. R&D capacity – number of R&D employees over total n. of employees | 2. Age – total number of years. | |||
| - 8969 observations (and 6872 firms) | Log function. | |||||
| - Final sample of 2905 observations (and 2537 firms) | 3. Export – dummy variable for firm exporting activities. | |||||
| 4. Wave 2004 – dummy variable for firms included in the 2004 survey. | ||||||
| Hung, KP; Chou, C | 2013 | - Taiwanese high tech manufacturers | 1. Firm performance – firm's | 1. Internal R&D effort – ratio between company R&D expenditure over sales. | 1. Industry sectors – dummy variables for sectors (chemical & pharmaceuticals, Mechanical and electric equipment, Semiconductors, and Electronics) | |
| - Online questionnaire | Tobin q: ratio of firm market value to the replacement cost of its assets | 2. Technological turbulence – change rate of technology used in the business | 2. Size – number of employees. | |||
| - 791 companies selected for analysis | 3. Market turbulence – speed of change in customer needs and preferences in competitor actions | Log measure | ||||
| - 176 responses (22.3% response rate) | ||||||
| Roper, S; Vahter, P; Love, JH | 2013 | - Irish Innovation Panel (IIP) | 1. Proportion of plants’ sales derived from products that were either newly introduced or improved during the previous three years. | 1. Measures of the breadth of innovation linkages (based on Laursen & Salter, 2006) | ||
| - 1994–2008 | 2. Product innovation dummy | |||||
| Caner, T; Sun, J; Prescott, JE | 2014 | - USPTO database | 1. Invention output – average number of patents granted over a three-year period | 1. Centrality – degree centrality, the number of direct ties in a firm's early stage R&D alliance network. Log value. | 1. Therapeutic area diversity – 22 therapeutic areas Herfindahl index measure. | |
| - Bio-pharmaceutical firms in the US | 2. Inward technology transfer – sum of the count of patent citations made in a firm's patents to patents held by other organizations, over five years (t−5 to t−1. Log value. | 2. Size – number of employees. | ||||
| - 1990–2007 | 3. Outward technology transfer – sum of the number of out- licensing agreements over a five- year period (t−5 to t−1. Log value. | Log value | ||||
| - 2209 firm observations for 287 firms | 4. Interactions – Centrality*Inward knowledge transfer, Centrality*Outward knowledge transfer, Inward knowledge transfer*Outward knowledge transfer, and Centrality*Inward knowledge transfer*Outward knowledge transfer | 3. Age – n. of years | ||||
| 4. R&D intensity – R&D expenditure over total assets. | ||||||
| 5. Available slack – Ratio of current assets to current liabilities | ||||||
| 6. Recoverable slack – working capital to sales ratio | ||||||
| 7. Potential slack – debt to equity ratio | ||||||
| 8. Time – dummy variables for years. | ||||||
| Cheng, CCJ; Huizingh, EKRE | 2014 | - 24 in-depth interviews | Innovation performance – Four items: | 1. Outside-in | 1. Market turbulence | 1. Entrepreneurial orientation |
| - Pilot study for validity with 39 senior management | 1. New product/service innovativeness | 2. Inside-out | 2. Technological turbulence | 2. Market orientation | ||
| 2. New product/service success | 3. Coupled | 3. Competitive intensity | 3. Resource orientation | |||
| 3. Customer performance | 4. Firm size | |||||
| 4. Financial performance | 5. Industry | |||||
| Du, JS; Leten, B; Vanhaverbeke, W | 2014 | - Cross sectional dataset on R&D projects | 1. Financial performance – measured as the total revenues that are generated by the ‘transferred’ outcomes of an R&D project to one, or multiple, business departments between the start of the project and the latest year of data collection (i.e. mid-2013. | 1. Open innovation partnerships – dummy variable on whether the firm participated in a collaboration with a science-based on market-based partner during the project. | 1. Project resources – n. of full time equivalents working on the project | |
| - Focus on large multinational, multi-business, European-based manufacturing companies. | 2. Science-based partnership – dummy | 2. Technology fields – dummy variables for technologies involved in the project | ||||
| - 2003–2009 | 3. Market-based partnership – dummy | 3. Firm patent stock – n. of patents (developed in the previous 5 years) accessible to project team | ||||
| - 489 R&D projects sample | 4. Project management formality- 5-value scale measure | 4. Project patent – dummy variable on whether the project resulted in a patent application | ||||
| 5. Sponsor departments – dummy variables identifying the department sponsoring the project | ||||||
| 6. Development departments – dummy variables identifying the department in charge of developing the project after its conclusion | ||||||
| 7. N. of projects under management | ||||||
| 8. Project initiating year – dummy variables | ||||||
| 9. Project ending year – dummy variables | ||||||
| Sabidussi, A; Lokshin, B; de Leeuw, T; Duysters, G; Bremmers, H; Omta, O | 2014 | - Community Innovation Survey | 1. Innovation performance – “total innovation”: total sales derived from new products, with the share of sales from products new to the market and new to the firm (jointly). Log (Percentage of sales from new products/number of employees)+1 | Strategy – firm strategy. Dummy variables for three approaches: | 1. R&D intensity – Log (R&D intensity/n. of employees) +1 | |
| - Netherlands | 1. M&A strategy | 2. Alliance partner diversity – Dummy variables for 7 categories: customers, suppliers, competitors, commercial laboratories, research institutes, universities, and subsidiary companies). | ||||
| - 1996, 1998, 2000 reference years (covering 1994–2000) | 2. Alliance strategy | 3. Firm size – Log of n. of employees. | ||||
| - 3657 observation and 2862 firms | 3. Integration strategy. | 4. Sources of innovation – Dummy variables for three categories: I. Export, II. MNE, III. Domestic group | ||||
| 5. Sector – Dummy variables for industry classification. | ||||||
| Vahter, P; Love, JH; Roper, S | 2014 | - Irish Innovation Panel (IIP) | 1. Proportion of plant sales derived from products that were either newly introduced or improved during the previous three years. Percentage (0–100) | 1. OI Breadth – number of different types of innovation linkages | 1. In-house R&D – dummy variable | |
| - 1994–2008 | 2. SCL – dummy variable for linkages inside the supply chain (suppliers and/or customers) | 2. Multi nationality – dummy variable | ||||
| - 2170 small plants in the sample, 1672 medium and large | 3. UNILAB – dummy variable for linkages with universities or labs | 3. Workforce with degree – percentage | ||||
| 4. OTHER – dummy variable for other linkages – with competitors, joint ventures or consultants | 4. Public support – dummy variable on whether firms have received public support for their innovation activity | |||||
| 5. Herfindahl index – proxy for sectoral competition | ||||||
| Cruz-Gonzalez, J; Lopez-Saez, P; Navas-Lopez, JE; Delgado-Verde, M | 2015 | - Spain | 1. Firm performance – 7-point Likert Scale based on six item variables on subjective scale for firm performance (Venktatraman, 1989). | 1. External search breadth – 7-point Likert scale, based on the importance of 16 external sources | 1. Past performance | 1. Technological dynamism – 7-point Likert Scale based on 4-item questions |
| - Multi-industry sample: Chemical, pharmaceutical, computer electronic and optical products, electrical equipment, machinery and equipment, motor vehicles trailer and semi-trailers, and other transport equipment. | 2. External search depth – 7-point Likert scale, based on the importance of 16 external sources | 2. Part of a group | ||||
| - Large- and medium-sized firms (>50 FTE) | 3. Foreign | |||||
| - 1188 firms in the initial sample, reduced to 1142 | 4. Firm R&D | |||||
| - Large-scale survey | 5. Innovation strategy | |||||
| - 248 respondents (21.7% response rate) | 6. Technological diversification | |||||
| 7. Industry R&D | ||||||
| 8. Industry sales growth | ||||||
| 9. Other environmental instability | ||||||
| Gesing, J; Antons, D; Piening, EP; Rese, M; Salge, TO | 2015 | - Cross-sectoral data from German firms operating in 21 distinct manufacturing and services sectors. | 1. Revenue share from new-to-firm products – Estimated percentage share of a firm's total revenues in 2007, which can be attributed to products launched between 2005 and 2007 that are new to the focal firm, but not to its target market. | The combination of: | 1. Firm size – log of number of FTE | 1. R&D intensity – ratio of total |
| - Of the 18,109 German firms surveyed, 6684 returned usable questionnaires (response rate of 36.9%). | 2. Revenue share from new-to-market products – Estimated percentage which captures firms’ success in launching and commercializing radically new products that constitute true market novelties. | 1. Two partner types for innovation collaborators: 1. Business customers and 2. Universities and research institutes | 2. Human capital – ratio of employees holding a university degree | 2. R&D expenditures over total revenues | ||
| - After accounting for missing data on the variables included in the model, 2502 German firms remain in the final sample | 2. Three governance modes: 1. Informal, self-enforcing governance (never contract based); 2. Hybrid governance (partly contract based); and 3. Formal, contractual governance (always contract based) | 3. Export intensity – ratio between international revenues over total revenues | ||||
| - Among these 2502 German firms, 1486 (59.4%) were operating in manufacturing sectors and 1016 (40.6%) in service sectors. | Six dummy variables: | 4. Firm location – dummy variable for West Germany (0) or East Germany (1. | ||||
| 1. Informal market-focused collaboration, | 5. Industry dummies – 21 categories | |||||
| 2. Hybrid market-focused collaboration, | ||||||
| 3. Formal market-focused collaboration, | ||||||
| 4. Informal science-focused collaboration, | ||||||
| 5. Hybrid science-focused collaboration, and | ||||||
| 6. Formal science-focused collaboration | ||||||
| Bianchi, M; Croce, A; Dell’Era, C; Di Benedetto, CA; Frattini, F | 2016 | - Spanish Business Strategy Survey | 1. Product Innovation | R&D Outsourcing – ratio of expenditures for R&D outsourcing over total sales, spent in the last three years | 1. R&D Internal – ratio of expenditures for R&D over total sales, spent in the last three years. | 1. R&D Consultants – dummy variable |
| - 1999–2007 sample of 1856 firms | Performance – n. of new products developed and commercialized by the firm in reference year | 2. Existing products – log of products commercialized by the firm in the reference year. | 2. R&D Unit – dummy variable | |||
| - 841 firms selected for the analysis, 6161 firm-year observations. | 3. Patents stock – log of firm's patent stock at reference year. | |||||
| 4. Patents – dummy variable | ||||||
| 5. Export – dummy variable | ||||||
| 6. Export intensity – share of sales from exports | ||||||
| 7. Subsidized – dummy variable | ||||||
| 8. Employees – log of n. of employees (proxy for firm size) | ||||||
| 9. Age – log of n. of firm's years | ||||||
| Chen, YF; Vanhaverbeke, W; Du, JS | 2016 | - China | Innovation performance – ratio of sales derived from new or substantially improved products | Collaboration with different types of partners – nine types of potential partners in the survey: lead users, major clients, suppliers, competitors, firms in other industries, universities and research institutions, technology agencies, intellectual property organizations, and venture capitalists | 1. Internal R&D activities – R&D intensity, ratio of R&D expenditures over sales | |
| - Two waves of survey conducted among innovative firms in Zhejiang province | 2. Firm size – n. of employees | |||||
| - 2006–2007 and 2013 | 3. Firm age – n. of years since firm establishment | |||||
| - 478 firms in the final sample | 4. Employees with higher degree – n. of employees with high-education degree divided by the total number of employees | |||||
| 5. Nature of firm ownership – dummy variables on whether the firm is state-owned, privately owned, joint venture or fully-owned subsidiary of a foreign firm. | ||||||
| 6. Stage of growth – dummy variables on whether the firm is in its initial stage, growth stage, expansion stage or maturity stage. | ||||||
| 7. Industries – dummy variables | ||||||
| 8. Year of survey – dummy variables | ||||||
| De Zubielqui, GC; Jones, J; Lester, Lv | 2016 | - Adelaide Metropolitan area of South Australia | Firm performance – ordinal sales growth+ordinal market share growth | 1. External knowledge inflows from market-based actors (EKMK) – three indicators: 1. n. of methods/channels of external knowledge inflows from market-based actors (0–15.; 2. Whether firms had used external ideas from market-based actors for innovation activities (0–4.; and 3. Count of which market-based actors the firms collaborated with (0–6. | 1. Absorptive capacity – dummy variables on whether the firm possesses engineering or scientific skills (0–6) | |
| - SMEs (<200 employees) | 2. External knowledge inflows from science-based actors (EKINST) – three indicators: 1. n. of methods/channels of external knowledge inflows from science-based actors (0–14.; 2. Whether firms had used external ideas from science-based actors for innovation activities (0–4.; and 3. Count of which science-based actors the firms collaborated with (0–8). | 2. Innovation outcomes – dummy variables on whether the firm undertake different types of innovation activities | ||||
| - 14,206 target firms | ||||||
| - 4788 firms (33.7) not available | ||||||
| - Final dataset of 9418 firms | ||||||
| - 1226 questionnaires received, 838 used for analysis (8.9% response rate) | ||||||
| Sikimic, U; Chiesa, V; Frattini, F; Scalera, VG | 2016 | - Spanish Business Strategy Survey (SBSS) | Technology Out-Licensing Volume (TOLV) – log of revenues from out-licensing of technology | 1. Technology Licensing Investments (TILI) – distributed lags (t−1. t−2 and t−3) of in-licensing investments | 1. R&D intensity (RNDI) – ratio of R&D investments over sales | |
| - 1998–2007 | 2. Number of Years Firm In-Licensed (NYFIL) – n. of years the firm has engaged in in-licensing prior to year t. | 2. Patent Portfolio (PP) – count of new patent registered by the firm in the reference year | ||||
| - The questionnaire was sent to all firms with more than 200 workers and to a random sample of firms with less than 200 workers, but more than 10 workers. | 3. Firm Continuously In-Licensed (FCIL) – dummy variable on whether the firm in-licensed in all the three years previous to year t. | 3. Number of New Product Innovations (NNPI) – n. of new product innovations the firm generated internally | ||||
| - Unbalanced panel data | 4. Manufacturing Assets (MA) – ratio of firm's tangible fixed assets over total assets | |||||
| - 837 firms | 5. Size – n. of employees | |||||
| 6. Age – n. of years of company from foundation | ||||||
| 7. Industry – dummy variables | ||||||
| 8. Year – dummy variables | ||||||
| Thanasopon, B; Papadopdulos, T; Vidgen, R | 2016 | - IT service providers in Thailand who had participated in the FFE of service innovation projects. | 1. Financial success | Openness competence – four-components: | 1. Years of experience | |
| - 598 Bangkok-based firms in the initial sample | 2. Non-financial success | I) Searching capability (SEARCH), | 2. Experience of the project team | |||
| - 200 firms randomly selected | 3. Market uncertainty reduction | II) coordination capability (COOR), | 3. Innovativeness | |||
| - 83 firms agreed to participate | 4. Technical uncertainty reduction | III) collective mind (CMIND) | 4. Firm size | |||
| - 122 valid responses in the final sample | IV) absorptive capacity (AB_CAP) | |||||
| Martinez, MG; Zouaghi, F; Garcia, MS | 2017 | - Technological Innovation Panel (PITEC) | Firm innovation performance – 2- item ratio of sales from innovation: | Alliance portfolio diversity – 8- item construct of cooperation agreements in the last two years: | 1. Firm size – log | 1. R&D human capital – 2- item construct based on education and skills |
| - Spain | I) radical – ratio from products new to the world introduced in the last two years; II) incremental – ratio from products new to the firm introduced in the last two years | 1. Customers, | 2. Alliance experience – dummy variable on firm's previous external collaboration experience | 2. R&D education intensity – ratio of R&D staff with third level education or higher | ||
| - 2005–2012 | 2. Suppliers, | 3. R&D intensity – ratio of firm's R&D expenditure over total sales | 3. R&D skills intensity – ratio of top-skilled R&D staff | |||
| - 32,836 observations, 14,740 for high tech sectors and 18,096 for low tech sectors | 3. Competitors, | 4. Export intensity – log of ratio of export over total sales | ||||
| 4. Firms belonging to the same enterprise group, | 5. Industry effects – high-tech and low-tech dummy variables | |||||
| 5. Universities, | 6. Year – dummy variable | |||||
| 6. Public research organizations, | ||||||
| 7. Technological centers, | ||||||
| 8. Commercial laboratories/R&D enterprises. | ||||||
| In addition, geographical dummy variables are added: I) Spain, II) Europe, III) Other countries | ||||||
We argue that extant contributions present two main limitations: sample specific restrictions and the definition of the output “performance” variable.
As regards the first issue, all the contributions presented in Table 1 use country or sector-specific samples. While this choice favors the recognition of specific patterns of openness, it does not allow confrontation of results across various contexts, thus failing to address the existence of cross-national or cross-sectoral patterns over time. In addition, much literature focuses on various “innovation-related” measures as the performance output, including scale measures for innovation performance (Cruz-González, López-Sáez, Navas-López, & Delgado-Verde, 2015; Pullen, De Weerd-Nederhof, Groen, & Fisscher, 2012), continuous measures of innovation outputs, such as the number of new or significantly improved products (Hwang, Kim, & Kim, 2009; Mention, 2011), or percentage measures, such as the share of sales from innovative products/services (Chen, Vanhaverbeke, & Du, 2016; Gesing et al., 2015). While these measures provide objective indicators of the output of innovation efforts put through by companies, they do not directly address the effect on firm overall performance: using ratios of innovation over firm revenues does not guarantee that the firm will experience an increase in the latter, since the increasing incidence of innovation may come at expenditure of overall sales results.
To avoid distortion of results, we rely on objective and comparable performance measures of firm performance, namely firm sales, shares value and employment levels.
Openness and performanceOI literature is yet to find consensus on the openness – performance relationship. In the next paragraphs, we review significant extant contributions in the field.
Positive effectsChen et al. (2011) show that both scope and depth of openness have a positive effect on the company's innovation performance. Similarly, Pullen et al. (2012), study the effects of firm network characteristics on innovation performance and find that goal complementarity is positively related to innovation performance. Rass et al. (2013) posit a positive relationship between the implementation of OI instruments and performance, and a positive relationship between the former and firm social capital. Results show that firm social capital acts as a positive moderator, positively influencing firm performance in the implementation of OI practices. Gesing et al. (2015) address the effects of governance modes and collaboration types on firm NPD performance, measured as the share of revenues from products that are new to the firm and the share of revenues from products that are new to the market. They find that formal collaborations with both market-based and science-based partners show a stronger positive and significant effect on revenue shares from new-to-the-firm and new-to-the-market products compared to informal collaborations. Egbetokun (2015) finds that the breadth of firms’ network portfolio – the number of external knowledge sources – has a positive effect on both the firms’ overall innovation and product innovation performance. In addition, the variety of informal collaboration has a positive impact on firms’ innovativeness, while the variety of formal arrangements has a minor impact, as it only partially increases the overall innovation performance. Nitzsche et al. (2016) show that absorptive capacity, open culture, connectivity, strategic and structural flexibility all have a positive and significant effect on firm's innovation success.
Negative and non-linear resultsSuh and Kim (2012) study the effects of four different type of collaboration activities – in-house R&D, technology acquisition or licensing, R&D collaboration and networking – on firm R&D performance, measured in terms of product/service innovation, process innovation and patents produced by firms, find that non-collaboration (in-house R&D) is an efficient strategy, while networking is the most inefficient strategy when considering all innovation outputs. Again, Laursen and Salter (2006) find that both search breadth and depth have an inverted U-shaped relationship with innovation performance. Similarly, Garcia Martinez, Zouaghi, and Sanchez Garcia et al. (2017) find an inverted U-shape correlation between the impact of alliance portfolio diversity on firm incremental and radical innovation performance. Love et al. (2011) find that firms’ internal organization, the presence of external public support and increasing competition, and the creation of ties with commercial laboratories have a positive effect on the firm innovative performance – innovative sales – while increasing openness is positively but non-significantly related with innovation.
SummaryIn short, extant OI literature has so far focused on defining the level of openness of the company – measured through the extent of relationships with external counterpart, failing to consider the value of the acquired assets, and their effects of performance in comparison with the development of the same products on performance. In addition, while the use of “innovation” related indicators as the output of the innovation process provides a useful indicator on the success of innovation-related activities, it does not tell us how such output influences firm's overall performance, i.e. revenue growth. Finally, we see heterogeneous views in defining the relationship between openness and performance, since the multiple works show that openness has beneficial effects on performance, while other studies argue that the relationship is negative, or rather non-linear. Hence, we seek to contribute to extant literature by proposing an empirical analysis of the effects of openness – focusing on the nature of acquired intangible assets versus internally developed assets – on performance, measured in terms of overall sales, firm shares value, and the level of employment. To do so, we use an unbalanced panel data of 329 European companies listed in the five major markets – United Kingdom, Germany, France, Italy and Spain, over the period 2008–2013. Details about the research design are presented in the following section.
Research designSampleThe empirical analysis relies on a panel regression analysis. The data collection process consisted of two main steps. First, a preliminary analysis was conducted on all companies listed on stock market exchanges (London, Frankfurt, Paris, Milan and Madrid) of the five largest European countries. All these countries have adopted IFRS (International Financial Reporting Standards) provisions, hence the data is assumed to be comparable.
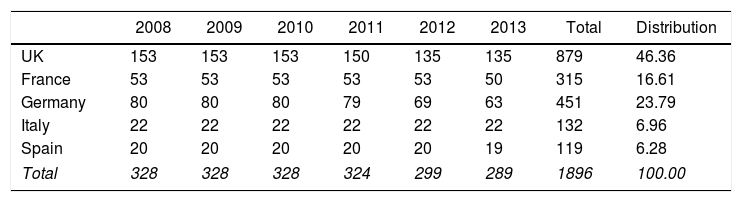
The data collection process started with the collection of all 2178 companies listed on the abovementioned Stock Exchange markets for fiscal year 2008. From this first group, we excluded all the companies that did not provide financial information using IAS/IFRS principles. Then we continued excluding firms that did not meet our selection criteria: identifiability, control and the existence of future economic benefits. Moreover, all the companies involved in financial services were excluded from the sample.1 The same collection procedures have been accepted in previous studies (Denicolai, Ramirez, & Tidd, 2014; Denicolai, Cotta Ramusino, & Sotti, 2015; Denicolai, Ramirez, & Tidd, 2016). From the initial sample, we were able to select 328 companies following all the eligibility criteria. We extended the original sample by including the following years, up to 2013. The final sample consists of 328 companies over 2008–2013, thus 1968 firm-year observations. From this value, we subtracted a number of companies which have been removed from listing or acquired in the reference period. The final sample is an unbalanced panel data consisting of 1896 firm-year observations. Country and industry distribution of the sample are presented in Tables 2 and 3. We complemented the data with the extraction of the same dataset using Bureau van Dijk's ORBIS Software.
Sample distribution by country and year.
| 2008 | 2009 | 2010 | 2011 | 2012 | 2013 | Total | Distribution | |
|---|---|---|---|---|---|---|---|---|
| UK | 153 | 153 | 153 | 150 | 135 | 135 | 879 | 46.36 |
| France | 53 | 53 | 53 | 53 | 53 | 50 | 315 | 16.61 |
| Germany | 80 | 80 | 80 | 79 | 69 | 63 | 451 | 23.79 |
| Italy | 22 | 22 | 22 | 22 | 22 | 22 | 132 | 6.96 |
| Spain | 20 | 20 | 20 | 20 | 20 | 19 | 119 | 6.28 |
| Total | 328 | 328 | 328 | 324 | 299 | 289 | 1896 | 100.00 |
Distribution column is expressed in percentages.
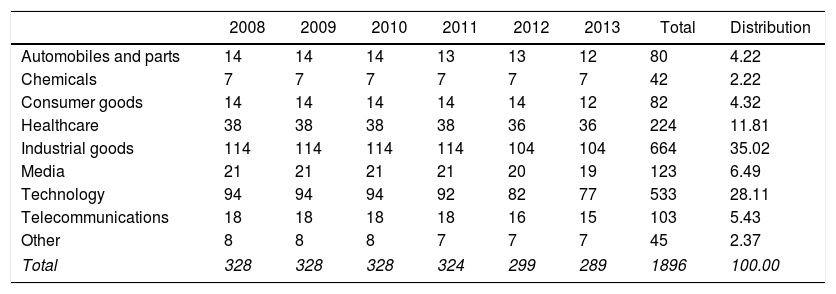
Sample distribution by industry and year.
| 2008 | 2009 | 2010 | 2011 | 2012 | 2013 | Total | Distribution | |
|---|---|---|---|---|---|---|---|---|
| Automobiles and parts | 14 | 14 | 14 | 13 | 13 | 12 | 80 | 4.22 |
| Chemicals | 7 | 7 | 7 | 7 | 7 | 7 | 42 | 2.22 |
| Consumer goods | 14 | 14 | 14 | 14 | 14 | 12 | 82 | 4.32 |
| Healthcare | 38 | 38 | 38 | 38 | 36 | 36 | 224 | 11.81 |
| Industrial goods | 114 | 114 | 114 | 114 | 104 | 104 | 664 | 35.02 |
| Media | 21 | 21 | 21 | 21 | 20 | 19 | 123 | 6.49 |
| Technology | 94 | 94 | 94 | 92 | 82 | 77 | 533 | 28.11 |
| Telecommunications | 18 | 18 | 18 | 18 | 16 | 15 | 103 | 5.43 |
| Other | 8 | 8 | 8 | 7 | 7 | 7 | 45 | 2.37 |
| Total | 328 | 328 | 328 | 324 | 299 | 289 | 1896 | 100.00 |
Distribution column is expressed in percentages.
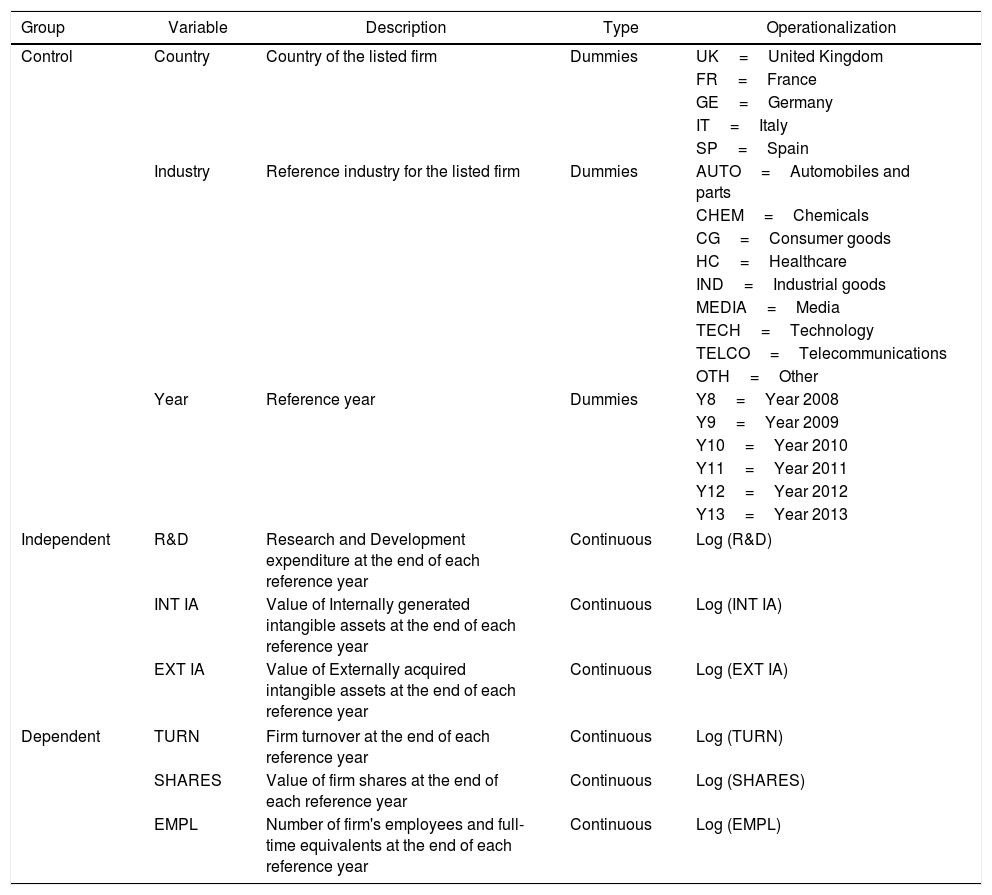
We adopted three different indicators to express performance: (1) economic performance, measured through firm turnover, in logarithmic form (TURN); (2) financial performance, measured through the value of shares at the end of each year included in the sample (SHARES); and (3) human capital performance, measured through the number of employees and full-time equivalents reported at the end of each year included in the sample (EMPL).
Independent variablesIndependent variables considered in the model include internally generated intangible assets, externally acquired intangible assets and dummy variables to indicate the specific types of assets the company invested into.
Internally developed intangible assets (INT IA), include intangibles that arose from internal activities during the fiscal year considered, besides goodwill. Externally acquired intangible assets (EXT IA), conversely, include all externally generated intangible assets, both singularly acquired and or acquired as part of a business combination. For both variables, we use the logarithmic value of the amount spent by the firm, in Euros.
Control variablesFinally, we included control variables, namely industry effects and country effects through, using dummy variables. In addition, we controlled for innovation propensity of firms, expressed as the logarithmic value of amount of R&D expenditure reported at the end of each year included in the sample, in Euros. A summary of the variables used is presented in Table 4.
Operationalization of variables.
| Group | Variable | Description | Type | Operationalization |
|---|---|---|---|---|
| Control | Country | Country of the listed firm | Dummies | UK=United Kingdom |
| FR=France | ||||
| GE=Germany | ||||
| IT=Italy | ||||
| SP=Spain | ||||
| Industry | Reference industry for the listed firm | Dummies | AUTO=Automobiles and parts | |
| CHEM=Chemicals | ||||
| CG=Consumer goods | ||||
| HC=Healthcare | ||||
| IND=Industrial goods | ||||
| MEDIA=Media | ||||
| TECH=Technology | ||||
| TELCO=Telecommunications | ||||
| OTH=Other | ||||
| Year | Reference year | Dummies | Y8=Year 2008 | |
| Y9=Year 2009 | ||||
| Y10=Year 2010 | ||||
| Y11=Year 2011 | ||||
| Y12=Year 2012 | ||||
| Y13=Year 2013 | ||||
| Independent | R&D | Research and Development expenditure at the end of each reference year | Continuous | Log (R&D) |
| INT IA | Value of Internally generated intangible assets at the end of each reference year | Continuous | Log (INT IA) | |
| EXT IA | Value of Externally acquired intangible assets at the end of each reference year | Continuous | Log (EXT IA) | |
| Dependent | TURN | Firm turnover at the end of each reference year | Continuous | Log (TURN) |
| SHARES | Value of firm shares at the end of each reference year | Continuous | Log (SHARES) | |
| EMPL | Number of firm's employees and full-time equivalents at the end of each reference year | Continuous | Log (EMPL) | |
The identification strategy is based on panel data regression where we are able to control for firm-level fixed effects and firm-specific linear time trend and on a GMM-system estimator (Blundell & Bond, 1998).
Our baseline empirical specification is the following:
where Dkjt are sector (j) – country (k) – year (t) dummies, i.e. triple interactions of these variables; OIit is our variable of interest, that is the amount of money invested in OI practices by firm i in year t and Xit is a vector of time-variant firm-specific controls.
In our baseline specification (1) we are not able to control for firm level time-invariant heterogeneity that could affect performance and OI practices at the same time. In order to include these factors, we rely on a second specification where we add firm-specific Fixed Effects (FEs) and year dummies:
In this specification, the identification of our parameter of interest β1 relies on within-firm variation in OI over time (i.e. firms are allowed to start from different intercepts). FEs allow us to control for time-invariant unobserved heterogeneity which might affect performance.
We also estimate a more demanding specification including both firm specific intercepts and firm specific time trends, allowing them to follow different trends in the outcome variables, which is:
where the β3is are the firm-specific linear time trends.
This may address the concern that firms who saw an improvement in performance associated to an increase in OI activities may have been already on an increasing trend before the investments in OI practices.
Finally, we include a quantile regression analysis in order to check for differences in the effect of OI at different percentiles of the outcome variables.
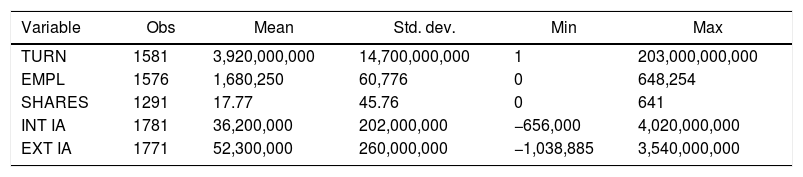
FindingsDescriptive resultsTable 5 shows the summary statistics of the variables used in the econometric analysis. In particular, firms in the sample spend, on average, 36 million Euros per year in development of intangible assets and 52 million Euros per year in acquisition of intangible assets over the 2008–2013 period. As regards dependent variables, firms in the sample have an average turnover of 3.9 Billion Euros on average, employ 16.800 full-time personnel per year and have an average stock price of 17.77 Euros over the selected period.
Summary statistics.
| Variable | Obs | Mean | Std. dev. | Min | Max |
|---|---|---|---|---|---|
| TURN | 1581 | 3,920,000,000 | 14,700,000,000 | 1 | 203,000,000,000 |
| EMPL | 1576 | 1,680,250 | 60,776 | 0 | 648,254 |
| SHARES | 1291 | 17.77 | 45.76 | 0 | 641 |
| INT IA | 1781 | 36,200,000 | 202,000,000 | −656,000 | 4,020,000,000 |
| EXT IA | 1771 | 52,300,000 | 260,000,000 | −1,038,885 | 3,540,000,000 |
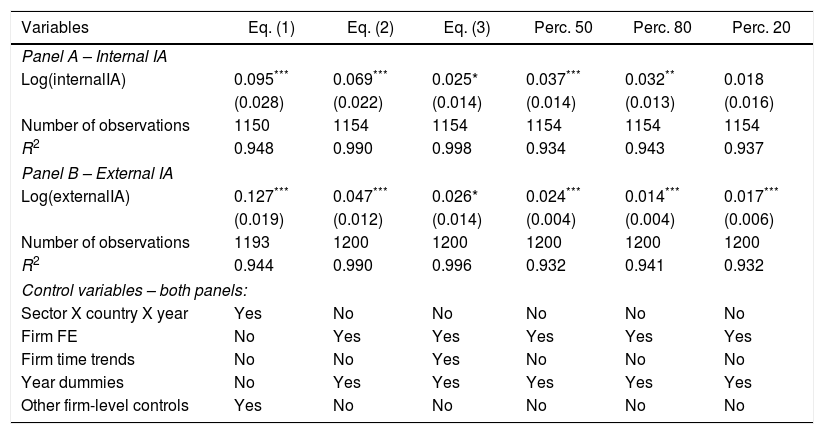
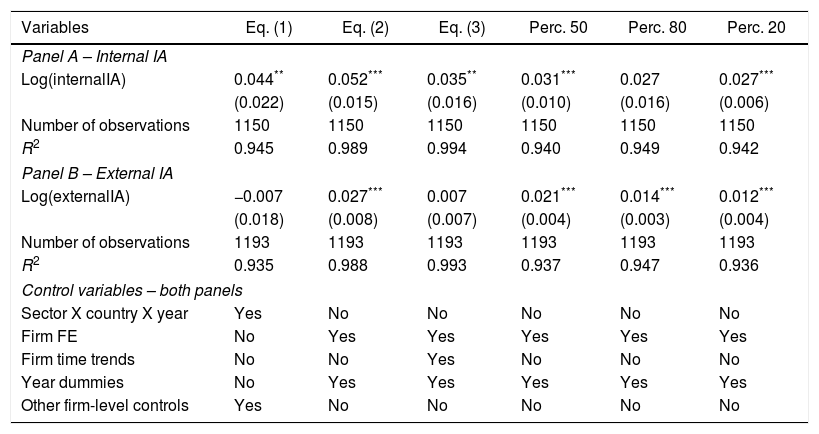
The following tables (Tables 6–8) show the results of the econometric models used in the study. All tables consist of two panels. Panel A reports the results using the expenditure in internally generated intangible assets and panel B those using expenditure in externally acquired intangible assets. Column (1) presents the estimates of the specification with triple interactions (Eq. (1)), column (2) shows the estimated values from the equation with firm-specific FEs, in column (3) firm-specific time-trends are added to the specification in column (2). Finally, in columns (4)–(6) we present estimates for the quantile regressions at the 50th, 80th and 20th percentiles.
Effect of expenditure of Intangible Assets on firms’ log (turnover).
| Variables | Eq. (1) | Eq. (2) | Eq. (3) | Perc. 50 | Perc. 80 | Perc. 20 |
|---|---|---|---|---|---|---|
| Panel A – Internal IA | ||||||
| Log(internalIA) | 0.095*** | 0.069*** | 0.025* | 0.037*** | 0.032** | 0.018 |
| (0.028) | (0.022) | (0.014) | (0.014) | (0.013) | (0.016) | |
| Number of observations | 1150 | 1154 | 1154 | 1154 | 1154 | 1154 |
| R2 | 0.948 | 0.990 | 0.998 | 0.934 | 0.943 | 0.937 |
| Panel B – External IA | ||||||
| Log(externalIA) | 0.127*** | 0.047*** | 0.026* | 0.024*** | 0.014*** | 0.017*** |
| (0.019) | (0.012) | (0.014) | (0.004) | (0.004) | (0.006) | |
| Number of observations | 1193 | 1200 | 1200 | 1200 | 1200 | 1200 |
| R2 | 0.944 | 0.990 | 0.996 | 0.932 | 0.941 | 0.932 |
| Control variables – both panels: | ||||||
| Sector X country X year | Yes | No | No | No | No | No |
| Firm FE | No | Yes | Yes | Yes | Yes | Yes |
| Firm time trends | No | No | Yes | No | No | No |
| Year dummies | No | Yes | Yes | Yes | Yes | Yes |
| Other firm-level controls | Yes | No | No | No | No | No |
Effect of expenditure of Intangible Assets on firms’ log (share price).
| Variables | Eq. (1) | Eq. (2) | Eq. (3) | Perc. 50 | Perc. 80 | Perc. 20 |
|---|---|---|---|---|---|---|
| Panel A – Internal IA | ||||||
| Log(internalIA) | 0.057 | 0.067** | 0.066** | 0.033 | 0.038 | 0.046 |
| (0.053) | (0.026) | (0.028) | (0.027) | (0.028) | (0.036) | |
| Number of observations | 922 | 922 | 922 | 922 | 922 | 922 |
| R2 | 0.685 | 0.950 | 0.987 | 0.813 | 0.835 | 0.837 |
| Panel B – External IA | ||||||
| Log(externalIA) | 0.075* | 0.045** | −0.007 | 0.031*** | 0.037*** | 0.011 |
| (0.044) | (0.020) | (0.014) | (0.009) | (0.007) | (0.010) | |
| Number of observations | 997 | 997 | 997 | 997 | 997 | 997 |
| R2 | 0.608 | 0.939 | 0.982 | 0.796 | 0.822 | 0.814 |
| Control variables – both panels | ||||||
| Sector X country X year | Yes | No | No | No | No | No |
| Firm FE | No | Yes | Yes | Yes | Yes | Yes |
| Firm time trends | No | No | Yes | No | No | No |
| Year dummies | No | Yes | Yes | Yes | Yes | Yes |
| Other firm-level controls | Yes | No | No | No | No | No |
Effect of expenditure of Intangible Assets on firms’ log (employment).
| Variables | Eq. (1) | Eq. (2) | Eq. (3) | Perc. 50 | Perc. 80 | Perc. 20 |
|---|---|---|---|---|---|---|
| Panel A – Internal IA | ||||||
| Log(internalIA) | 0.044** | 0.052*** | 0.035** | 0.031*** | 0.027 | 0.027*** |
| (0.022) | (0.015) | (0.016) | (0.010) | (0.016) | (0.006) | |
| Number of observations | 1150 | 1150 | 1150 | 1150 | 1150 | 1150 |
| R2 | 0.945 | 0.989 | 0.994 | 0.940 | 0.949 | 0.942 |
| Panel B – External IA | ||||||
| Log(externalIA) | −0.007 | 0.027*** | 0.007 | 0.021*** | 0.014*** | 0.012*** |
| (0.018) | (0.008) | (0.007) | (0.004) | (0.003) | (0.004) | |
| Number of observations | 1193 | 1193 | 1193 | 1193 | 1193 | 1193 |
| R2 | 0.935 | 0.988 | 0.993 | 0.937 | 0.947 | 0.936 |
| Control variables – both panels | ||||||
| Sector X country X year | Yes | No | No | No | No | No |
| Firm FE | No | Yes | Yes | Yes | Yes | Yes |
| Firm time trends | No | No | Yes | No | No | No |
| Year dummies | No | Yes | Yes | Yes | Yes | Yes |
| Other firm-level controls | Yes | No | No | No | No | No |
Table 6 investigates the effect of expenditure on intangible assets on firms’ turnover.
Results in Column (1) show that both development and acquisition of intangible assets is significantly correlated with turnover (0.095, p-value<0.001 and 0.127, p-value<0.001, respectively). If we assume firms are homogeneous, it seems that intangible assets generate positive results on turnover, irrespective of their source. Specifically, the acquisition of external intangible assets generates a vis-à-vis greater effect on the dependent variable. The argument is aligned with the finding of positive effects of openness – measured as the extent of acquisition of external intangible assets (i.e. Chen et al., 2011; Rass et al., 2013).
Adding controls for firm fixed effects and year dummies in column (2), results still show a positive and significant correlation for both asset development and acquisition with turnover (0.069, p-value<0.001 and 0.047, p-value<0.001, respectively). By controlling for firm heterogeneity, results show that both development and acquisition of intangibles have a positive effect on turnover, and that the effect of the former exceeds the latter: a 1% increase in expenditure for development generates a 0.069% increase in turnover, while a 1% increase in expenditure for acquisition generates a 0.043% increase. While the argument is still aligned with the positive effect on turnover generated by inbound openness, results in this specification show that the degree of incidence is vis-à-vis lower than the one generated by development.
To address this issue, we control for the presence of firm-specific time trends in column (3). Again, results return a positive and significant correlation with turnover for both development (0.025) and acquisition (0.026), both significant at the 10% level. By isolating the effects of firm-specific time trend, we see that external assets have a marginally greater effect on turnover than internally developed assets: a 1% increase in the former leads to a 0.025% increase in turnover, while a 1% increase in the latter leads to a 0.026% increase in turnover. Results show that positive effects are consistent throughout the specifications, and their influence on the dependent variable, once we add controls, is almost equal.
For further specification, we added quantile regressions to verify whether there are differences in magnitude when compared to firm size. Results in column (4)–(6) show that the effects of development are positive and consistent for larger firms – in the 50th and 80th percentile of the sample – while for relatively smaller firms they are not. In contrast, the positive relationship between acquisition of intangibles and turnover is consistent throughout size classes, with a marginally greater effect for firms in the 50th percentile (0.024, p-value 0.001) than in the 20th and 80th percentile (0.017, p-value 0.001 and 0.0014, p-value 0.01, respectively).
In this light, we argue that asset acquisition (i.e. increasing inbound openness) generates positive results on firm performances, irrespective of their size, while development generates positive results (an increase in sales) only when companies are sufficiently large to exploit the outcomes of internal R&D. This, we believe, confirms that internal and external intangible assets are complements, rather than substitutes (Denicolai et al., 2016).
In Table 7 we repeat the same analysis with a different dependent variable, stock prices. Results in column (1) show a non-significant relationship between development of intangible assets and financial performance (shares value), and a positive relationship between acquisition and the dependent variable (0.075, p-value<0.1). By isolating the effects of sector, country and year specification, the expenditure on development of internal intangible assets does not appear to be correlated with financial performance, while expenditure on acquisition seems to be positively correlated with an increase in stock prices.
In column (2), results for both variables are both positive and consistent (0.067 and 0.045, respectively). Both results are consistent at the 5% level.
When controlling for firm-specific time trends in column (3), results show contrasting results to column (1): development is positively associated with firm stock price (0.066), and the relationship is consistent at the 5% level. In contrast, the effect of acquisition is negative (−0.007), although close to zero and non-significant.
Quantiles in column (4)–(6) show that development is not-significantly related with share values across all groups, while asset acquisition has a positive and significant effect for relatively larger firms in the 50th and 80th percentile (0.031 and 0.037, respectively), and such effects are significant at the 1% level, while for relatively smaller firms – in the 20th percentile – the relationship is positive but non-significant.
Here, we argue that results are consistent with the resource-based view of the firm (Barney, 1991) since firms’ proprietary technologies may represent the source of competitive advantage on the market, hence they reflect a positive effect on investors’ expectations which in turn increases the stock value. In contrast, acquisition of external technology does not influence financial performance, since purchased technology is seldom unique, and therefore easily replicable by competitors.
Again, in Table 8 we repeat the same analysis, using the level of employment as the dependent variable.
Results in column (1) show the presence of a positive and significant relationship between development of intangible assets and the level of employment (0.044, p-value<0.05). A 1% increase in firm's expenditure for development of intangibles creates a 0.044% increase in the number of employees. In contrast, acquisition of intangible assets is not significantly correlated with employment.
In column (2), both explanatory variables are positively and significantly related with the dependent variable at the 1% level, and the effect of development (0.052) is higher than the effect of acquisition (0.027): while both actions increase firm employment, the impact of the former is vis-à-vis greater than the latter.
Results in column (3) show that – however – only development appears to be positively and significantly related with the level of employment (0.035, p-value<0.05). Acquisition, in contrast, has a positive effect on the dependent variable, although it is close to zero (0.007) and non-significant. Quantile distribution shows that the effects of development for relatively smaller groups of firms – 20th and 50th percentile – are positive and significant at the 1% level (0.027 and 0.031, respectively), while for firms in the 80th percentile the effect on employment is non-significant. Acquisition of intangible assets, in contrast, generates positive and significant results on employment across all size classes.
We argue that – in terms of employment – development of resources generates higher returns: when investing creating new technology, companies tend to bring in additional employees to conduct R&D. Instead, when they leverage on the acquisition of technology, they tend not to increase the number of employees, but rather rely on the firm's absorptive capacity (Cohen & Levinthal, 1990; Denicolai et al., 2016) to integrate the acquired assets.
SummarySummarizing the results, we see that when controlling for sector-, country-, and year-specific effects, development and acquisition of intangible assets generate different results: both affect the economic side of performance of a firm, measured in terms of turnover. Their effects on the financial and human capital side of performance, however, is different: development of intangible assets generate a positive effect on the level of employment, while acquisition of external intangible assets has a marginally positive effect on financial performance – measured as the value of firm stocks.
Controlling for firm-specific fixed effects, we find a positive and significant effect of both internally developed and external intangible assets. Results are consistent across all models: both variables generate positive results in terms of economic, financial and human capital performance. For all three dimensions, the effect of development is marginally greater than acquisition.
In column (3), we find that both explanatory variables are positively related with firms’ economic performance, and that the effects of both variables on turnover is almost equal: a 1% increase in development of intangibles generate a 0.025% increase in turnover, while the same increase in acquisition generates a 0.026% increase. In addition, we find that development of intangible assets is correlated with the other two performance dimensions, while acquisition is not.
Quantile distributions show that acquisition has a positive and consistent correlation among all class sizes with the economic and human capital dimension of performance, while in terms of financial performance the effect is significant only for relatively larger-sized firms (in the 50th and 80th percentile of the sample). Differently, development of assets generates a positive result on economic performance only for relatively larger firms, and a positive effect on the level of employment only for relatively smaller firms, while we find no significant correlation with financial performance.
DiscussionThe article builds on OI literature to measure the relationship between the level of openness and firm performance, measured through various dimensions. Results show that the effects of both development and acquisition are positive and significant across different dimensions, but their output varies in terms in magnitude and distribution: both variables are positively and significantly correlated with turnover, and that their effect on the latter is almost equal. In addition, we find that only development is positively and significantly correlated with the other two dimensions of performance, once we control for firm-specific time trends. Once we control for relative size of firms in the sample, we see that the effect of openness is more spread out across different class sizes, while the effect of development of intangibles influences the economic performance only for larger firms, and increases employment only for relatively smaller firms, while it has no effect on the financial side of performance.
ContributionsWe argue that the article provides many contributions to existing literature: first, it clarifies the dimensions considered to evaluate the level of openness, the level of performance and the relationship between the two dimensions. Then, it builds on extant literature to overcome existing limitations, proposing the measurement of inbound openness through the use of objective indicators, the amount invested in the acquisition of externally developed intangible assets and the amount invested by the firm in the development of intangible assets. Such variables provide more reliable indicators of firm propensity to openness than scale measures adopted so far by OI literature (Egbetokun, 2015; Ferreras-Méndez, Newell, Fernández-Mesa, & Alegre, 2015; Laursen & Salter, 2006). In addition, the paper proposes the study of the effects of development versus acquisition on three different dimensions for performance: (1) economic; (2) financial; and (3) human capital.
LimitationsWe argue that in this form the paper suffers from three main limitations: first, since it studies the effects of openness versus development using a sample of European companies, it misses out on the behavior of firms from different regions. In addition, since the sample only refers to listed company, we cannot control for smaller-sized firms. Finally, we did not control for the types of intangible assets – whether internal or external – the firms in the sample invest into, therefore missing on sorting out differences among various categories (patents, trademarks, concessions, etc.).
ImplicationsWe believe the article is of interest for both scholars and practitioners. For researchers, the paper provides the basis for overcoming current limitations of OI studies in evaluating the relationship between openness and performance. The inclusion of objective measures of firm propensity for openness – i.e. the level of investment in external intangible assets – provides a more reliable indicator than scale measures derived from secondary data. In addition, the definition of multiple dimensions of performance helps in highlighting the presence of different effects of development versus acquisition across the dimensions.
For managers, we argue that the choice in investing on development of intangibles versus acquisition leads to similar positive results in terms of economic performance, although it seems that the latter is marginally more effective than the former. In contrast, such investments do not directly affect other dimensions such as financial and human capital performance, although we see a marginally significant lagged effect of development on employment.
Further studiesFor scholars, the work leaves room for the proposition of similar quantitative studies in different regions, provided that financial data are exhaustive and adopt the same accounting standards across countries. In addition, the inclusion of small- or medium-sized firms could highlight the presence of differences of behavior across size-classes, as posited by previous works (Vrande, de Jong, Vanhaverbeke, & de Rochemont, 2009). Finally, the inclusion of indicators for the amount invested by each company in different intangible asset classes could provide more suitable implications for professionals in the innovation field.