


Here, we use an input distance function approach to determine the shadow price of carbon dioxide (CO2), technical efficiency and potential for emission reductions of the industrial sectors of China and Korea, and impact of carbon trading on costs. Data from 20 industries in the manufacturing sectors of South Korea and China were analyzed during 2015–2019. The potential for CO2 emission reductions and cost-saving effects of emissions trading were compared between the two countries. The average technical efficiency score of 20 manufacturing industries in Korea was 0.71, indicating that production costs could be reduced by almost 30%, while for China, the potential cost savings were 4% higher. The average marginal abatement cost in Korea was estimated as US$6.46/ton, while the weighted average marginal abatement cost for CO2 emissions (p^us), was US$15.1/ton. For China, the respective values were similar, at US$3.21/ton and US$6.57/ton.
China relied on a cheap labor force at the beginning of its economic reform and opening-up period, which began in the late 1970s, and has been under pressure from the international community to reduce its carbon dioxide (CO2) emissions. The 2019 novel coronavirus has had a significant impact on global carbon emissions. In the past year, the global economy has faced unprecedented challenges, including environmental protection and energy supply.
In the 14th Five-Year Plan (2021–2025), improvements in industry and manufacturing quality in China are emphasized, along with autonomy, safety, stability, competitiveness, and efficiency, as well as modernization of the industrial chain (Table 1).1
Comparison of carbon dioxide emissions by major industries in China and Korea, 2020. (Unit: millionMtCO2e).
| Industrial process | Transportation | Construction industry | Manufacturing | Agriculture | Power industry | |
|---|---|---|---|---|---|---|
| China | 846.3 | 979.24 | 563.72 | 2536.7 | 724.61 | 5460.78 |
| Korea | 24.7 | 103.66 | 50.76 | 70.63 | 14.93 | 401.2 |
Note: Data were taken from CAIT's database.
The Korean manufacturing sector is gradually reducing its dependence on foreign trade. Last year, the Ministry of Industry, Trade, and Energy of Korea announced the "Blueprint for the Future of the Era of Manufacturing Revival." The President of Korea stated that the government's goal was to ensure that the manufacturing industry of Korea was among the top four in the world by 2030. The pursuit of quantity dictated by the current industrial model is to be replaced by greater focus on the value-added ratio; the goal is to increase the current value-added ratio from 25% to 30% by 2030.
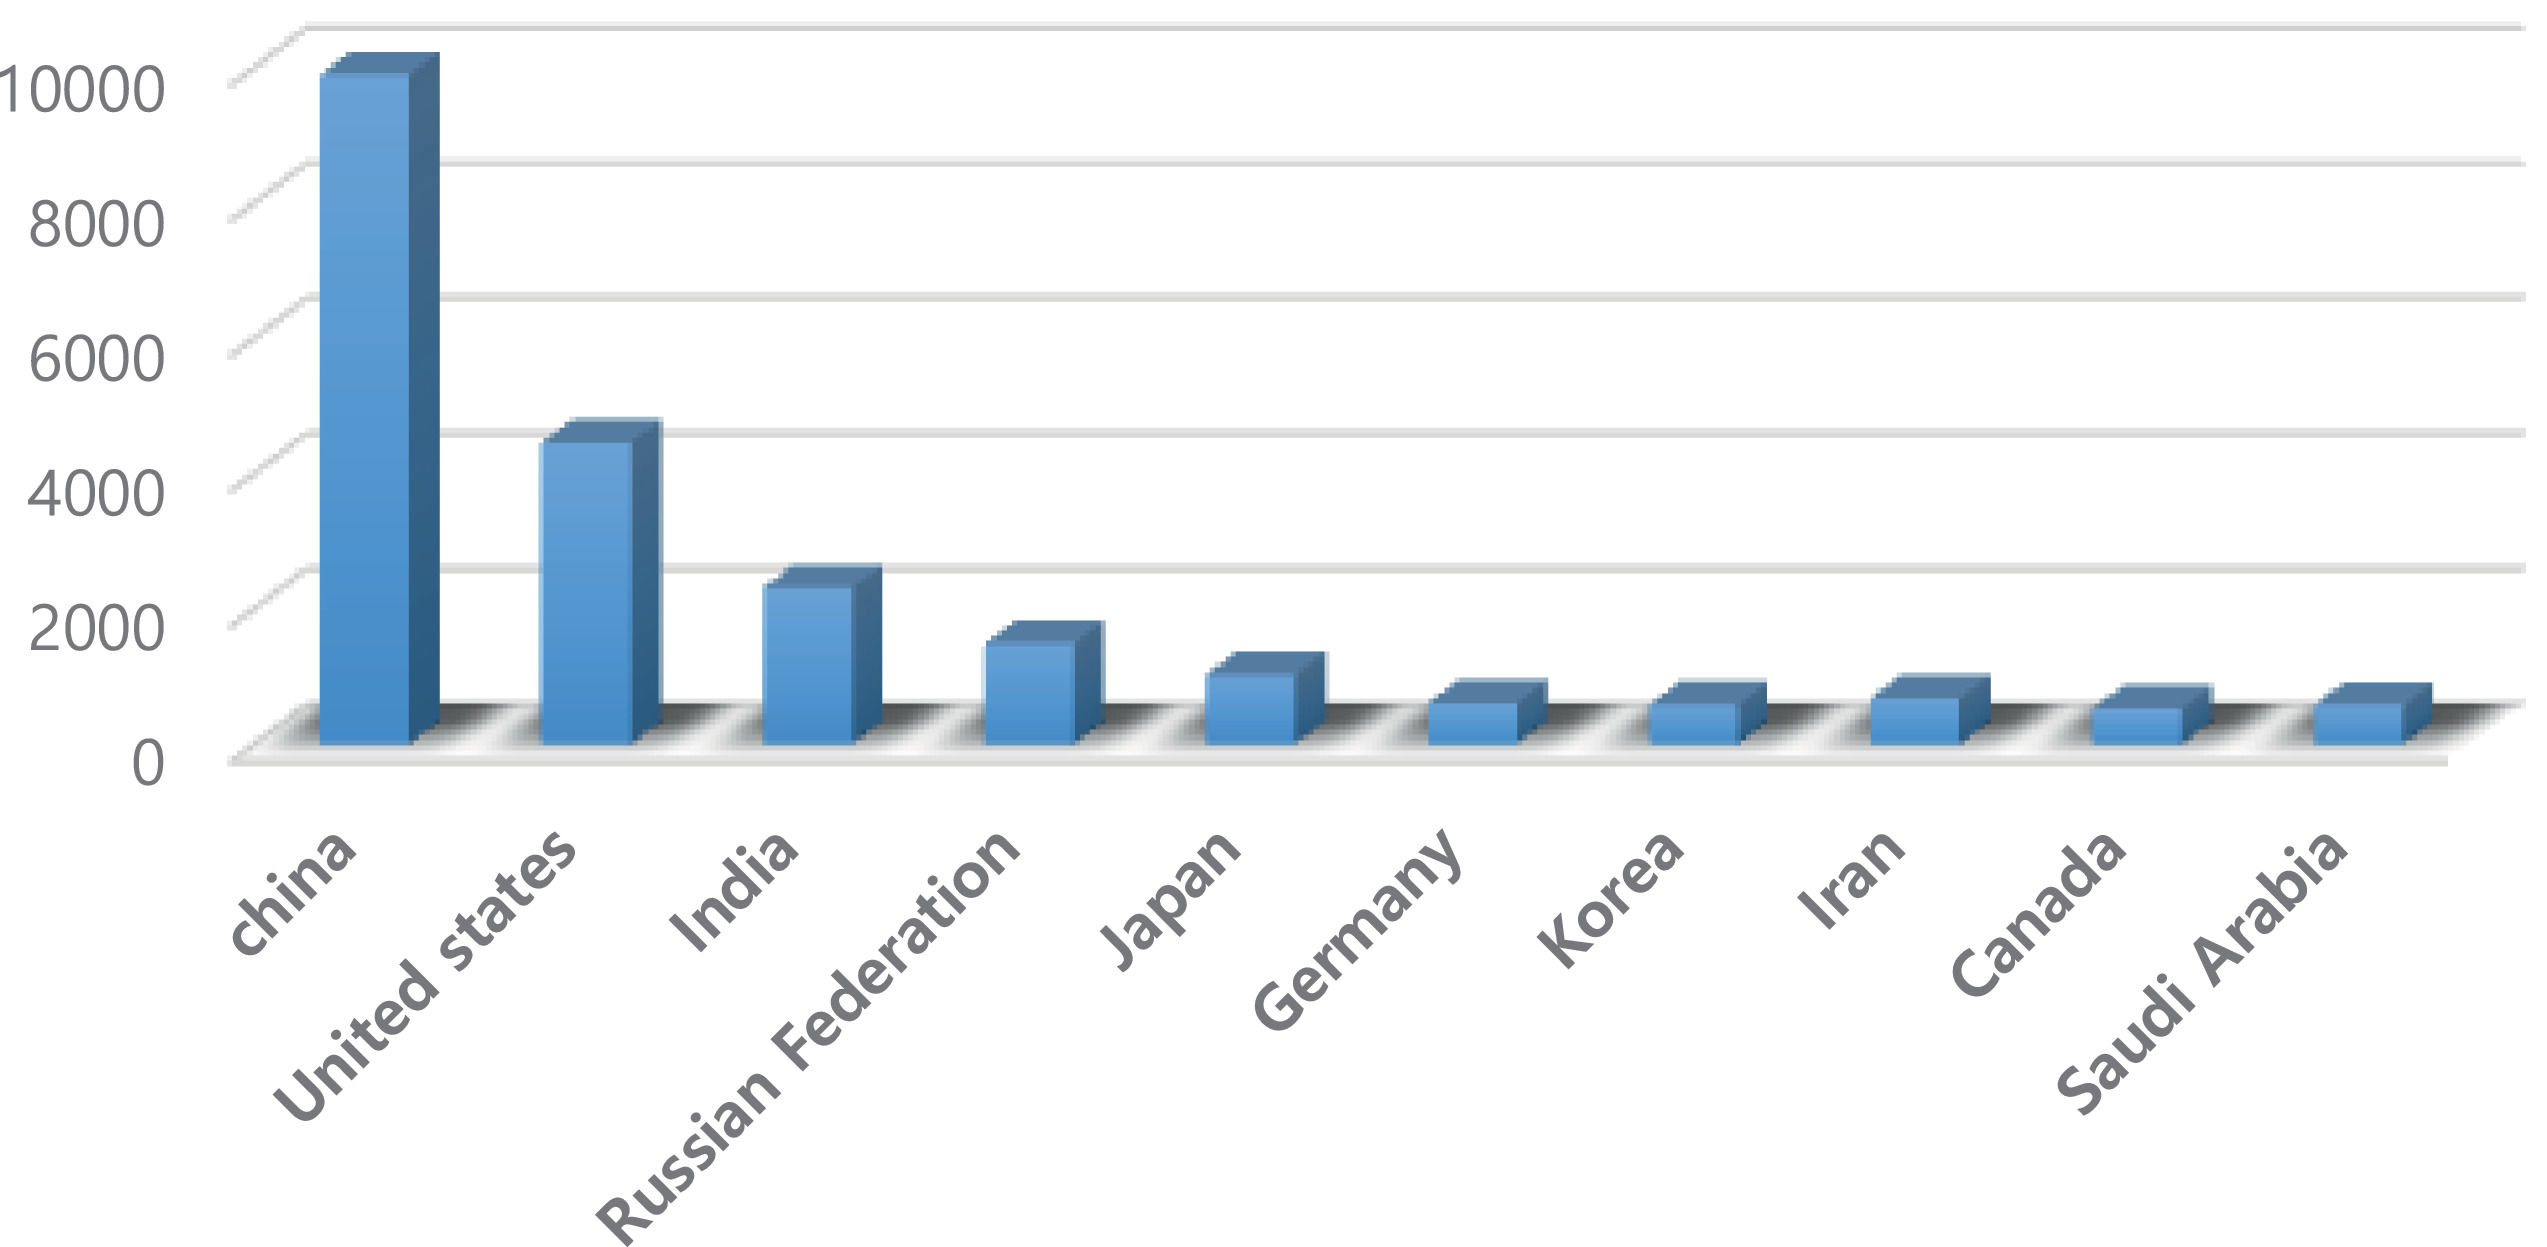
With the increased prominence of the concept of green growth in recent years, attention has focused on the problem of global warming. While there may be a conflict between economic growth and environmental conservation (i.e., as the economy grows, environmental pollution inevitably increases), some view economic growth and environmental protection as being in a complementary relationship, such that once economic growth achieves a certain level, economic growth will help alleviate environmental problems. China's CO2 emissions currently stand at 9,899 million tons; this accounts for 30.7% of global emissions, which is the largest proportion of any country. Korea's CO2 emissions currently stand at 578 million tons (1.8% of global emissions; Fig. 1).
.")
Environmental concerns are among the main factors driving the move toward sustainable development (Mendez-Picazo, Galindo-Martín, & Castaño-Martínez, 2021; Romero-Castro, López-Cabarcos, & Piñeiro-Chousa,2022). In the present study, China's standard industrial classification system (20 types of industry) was applied to Korea's manufacturing sector, and the two countries were then compared in terms of technical efficiency (TE), potential for CO2 emission reductions, and likely costs thereof. To this end, the input distance function of Shephard (1970) was used. As a representative example, Hailu and Veeman (2000) analyzed industrial competitiveness using an input distance function approach. More specifically, they analyzed the marginal abatement costs associated with biochemical oxygen demand and total suspended solids discharged from Canadian pulp and paper mills during 1959–1994. Using the input distance function, Jin and Lee (2015) analyzed TE, shadow prices, and substitutability during 1981–2009 for the Chinese thermal power industry. In a more recent study, Chen and Jin (2020) explored productivity changes in the thermal power sector at the provincial level. Their model was based on the Törnqvist index, and marginal abatement costs of CO2 emissions by the thermal power sector during 2009–2016 were calculated in various Chinese provinces. When performing productivity analyses, appropriate selection and handling of input, output, and price variables are key. Finally, Muhammad et al. (2020) analyzed quarterly data pertaining to the market share of the textiles and clothing industries, and the CO2 per capita, during 1990–2018. For their empirical investigation, they applied the innovative quantile-on-quantile regression approach and the Granger causality test.
In this study, input distance functions for 20 manufacturing industries in China and Korea, which account for a large proportion of total CO2 emissions, were estimated using an analysis methodology applied in previous studies. The maximum reduction in CO2 emissions that could be achieved by each industry was estimated assuming 100% TEChe (2017). calculated CO2 prices for China's iron and steel industry at the provincial level, based on a quadratic output directional distance function. Unlike that study, we also estimate the marginal cost reductions herein. China and Korea have both introduced and implemented national emissions trading systems. Estimates of the potential cost savings of inter-industry emissions trading, within and between countries, could have policy implications.
The rest of this paper is organized as follows. We first describe the analysis data and estimation results for manufacturing industries in China and Korea, followed by a summary and our conclusions.
Analysis modelLet us assume that an enterprise uses an input vector x∈R+Ncomposed of N production elements to produceythe final product quantity. In this case, 'desired outputs (q∈R+H) and 'undesired outputs (b∈R+M−H)' are generated in the process of creating an output vectory∈R+M. Therefore, for the production technology that produces M outputs from N inputs, the input distance function of Shephard (1970) is defined as follows. It measures the maximum range in which all inputs can be reduced at the same rate without reducing the outputs (Färe and Grosskopf, 1990; Hailu and Veeman, 2000).2

Here, the input vectorx∈R+3 is divided into three production elements; capital(k), labor(l), and energy(e), and the output vector y∈R+2 is composed of two outputs; final product outputs (q), which are 'desired outputs' and CO2 emissions(u), which are 'undesired outputs.' G(y)refers to the input requirement set that enables the production of yand measures the degree to whichxthat can produceycan be maximally reduced proportionally.
xAndyrefer to the input and output vectors, respectively, andG(y)is an input requirement set that enables the production ofy. The input distance function has the following characteristics.x∈B(y)AndI(y,x)≥1are the necessary and sufficient conditions to be mutually valid, are first-order homogeneous functions forx, and are monotonically non-decreasing and concave forx. These are quasi-concave foryand are non-decreasing for goods. On the contrary, these are non-decreasing for 'undesired outputs' because production elements necessary to reduce pollution should be additionally inputted to reducey, which is the 'undesired outputs' regarded as pollutants if the produced quantity of the 'desired output'qis to be maintained.
1/I(y,x) Can be calculated, and the technical efficiency (TE) of Farrell (1957) can be measured from the definition of the input distance function. In other words, if the production is assumed to have been implemented on the boundary line ofI(y,x), which is an area where the enterprise is the most efficient, that is, isoquant curve, it will be the most efficient situation, and the value of the input distance function value will be 1. Cases where the value is greater than 1, refer to situations where production elements are excessively inputted, exceeding the isoquant curve, which is the appropriate state. On the contrary, as the difference from 1 becomes greater, the production inefficiency increases.

Considering situations where enterprises' cost minimization is not achieved, a situation where the total shadow cost is minimized is assumed, as shown by Eq. (3) using the shadow price vector w3(in this case ws∈R+3).

Cost functions such as CS(y,ws)=minx{wsx:I(y,x)≥1} can be derived from the optimal condition of the cost minimization problem, of which a constraint condition is the value of the input distance function. Here, w∈R+3 denotes the price vector of the input that minimizes the cost.
Hailu and Veeman (2000) presented that the marginal abatement cost can be estimated using the input distance function. If Eq. (3) is partially differentiated y, Eq. (4) will be established.
Here, ∇denotes the partial differential operator. According to Shephard (1970) and Jacobsen (1972), λ is the Lagrangian multiplier of the constraint cost minimization problem and coincides with the optimal value of the cost function. If the shadow price of the output is defined as the cost increment incurred when one unit of the output is additionally produced, Eq. (4) can be expressed as follows.Where,ps∈R+2 is the shadow price vector of the output and pis≥0, pjs≥0from the nature of the input distance function.

Meanwhile, after obtaining pjsandpisrespectively from Eq. (5), if pisis the same as the market price (pi) of the final product, the relationship between the two output shadow prices can be expressed as follows.
where, pisis the shadow price of the good yi.
That is, the yield that must be abandoned to reduce one unit of CO2 additionally is measured. To calculate the CO2 shadow price in Eq. (6)I(y,x), which is the input distance function, must be estimated. To this end, the form of translog, as shown in Eq. (7), is taken. Where, γii′=γi′i,γjj′=γj′j

According to Aigner and Chu (1968), the coefficients in Eq. (7) are estimated using the linear programming method. The objective function is set, and constraint conditions such as monotonicity and homogeneity are satisfied while minimization is pursued.
where, n=1,...,N denotes the observed values. Under the relevant constraint conditions indicated above, the distance between the boundary point ofG(y), that is, the boundary line where the production efficiency is the highest, and the current operating point is minimized. The first constraint condition represents the range of input distance function values. The second and third constraint conditions are the characteristics of the input distance function and were presented to satisfy the monotonicity of the input element x, 'desired output' q, which is the final yield, and 'undesired output' u, which is CO2 emissions, and the fourth and fifth constraint conditions impose the constraint conditions of the homogeneity of the input distance function and the symmetry between coefficients.Analysis data and estimation results
In the present study, TE, CO2 shadow prices, and the potential for CO2 emission reductions were compared between the manufacturing sectors of China and Korea. The most competitive industry types were also identified. Cross-sectional data for the period 2015–2019 were analyzed under the assumption of 100% production efficiency (e.g., in terms of fuel consumption). The maximum potential CO2 reductions for manufacturing industries in both countries were estimated using the input distance function.
Industry classification methods differ between China and Korea, and there are also a relative lack of relevant data from China (Table 2). Therefore, the manufacturing sectors of China and Korea were reclassified based on energy consumption levels, to yield 20 manufacturing industry types for both countries. All variables were standardized such that they had a value of 1 at the midpoint of 2017.3
Comparison between industrial classification methods in China and Korea.
The input distance function used in the analysis comprises both desired and undesired outputs; the latter pertains mainly to CO2 (b), which is obtained by inputting capital stock (k), labor (l) and energy (e). The source for all of the statistical data for China, except CO2 emissions and energy, was the China Statistical Yearbook. The unit for both the final industrial output (q) and capital input (k; calculated according to the number of fixed assets) was 100 million yuan. l and e were quantified in terms of the average number of employees (rounded to the nearest 10,000), and the unit for the total amount of energy was tons (rounded to the nearest 10,000). The amount of energy used was obtained from the China Energy Statistical Yearbook, while b was estimated based on the carbon emission factors for fuel in China (obtained from the Intergovernmental Panel on Climate Change)4. A summary of the statistical data is presented in Table 3.
For Korea, q, l, and k were estimated based on mining industry data, manufacturing industry data, and a statistical survey published by the National Statistics Office. The total kwas estimated based on tangible fixed assets, which are calculated for the manufacturing sector every year, while b was estimated from the amount of bituminous coal used and carbon emission factors provided in the Statistical Yearbook of Energy of the Korea Energy Economics Institute Table 4. summarizes the statistics for the variables of interest. Table 5 and Table 6 shows the results obtained by applying the input distance function in Eq. (7) to data from the 20 major industries in China.
As shown in Table 8, the manufacturing industries "leather”, "wood and wood products”, "publishing and printing”, "coke and oil refining”, "medical care”, "non-metallic minerals”, "other electrical machinery and electrical converters”, "other manufacturing machinery and equipment”, "other transportation equipment”, and "furniture" had TE scores of 1, i.e., the highest possible value, which was not the case for any of these industries in Korea. The “electronics” industry had the lowest TE score (0.79); production efficiency was also relatively low for "compounds and chemical products”. Moreover, whereas the TE of the "metal" industry in Korea was low, it achieved the maximum possible score (i.e., 1) in China.
The input distance function values for the manufacturing industries were estimated to be in the range of 1.00–5.07, with an average of 1.78. As can be seen in Table 8, the TE scores for Korean industries were in the range of 0.1971–1.000. A score of 1 was achieved by six industries, namely "beverages”, "coke and petroleum processing”, "nonmetal minerals”, "automobile manufacturing”, "other transportation equipment”, and "furniture." The industry with the lowest TE score (i.e., 0.1971) was the “metal” industry, followed by "rubber and plastics”, "groceries”, and "compounds and chemical products” (all scores < 0.5). The average TE score for all 20 manufacturing sectors in Korea was 0.7074. Assuming that production processes follow an isoquant curve, by maximizing production efficiency in the Korean manufacturing sector, production inputs could be reduced by up to ∼30% without any reduction in outputs.
The average TE score of the 20 major manufacturing industries in China was 0.94 (range: 0.7–1.0), which was approximately 23% higher compared with that in Korea. China was technically superior to Korea in all manufacturing industries, except the "beverages" and "automobiles" industries.5 The average TE score of all 20 manufacturing sectors in China was 0.94. Assuming an isoquant curve, as discussed above for Korea, the production elements could be reduced by up to ∼6% without any reduction in outputs.
CO2 emissions from the manufacturing industry in China could be reduced by an estimated 75.98 million tons, mostly in the "compounds and chemical products” industry (≥ 62.56 million tons; ∼82% of the total potential reduction). The "paper products”, "textile products”, and "food" industries also have potential for relatively large CO2 reductions.
The input distance function values for Korea's manufacturing industries, estimated using Eq. (7), are shown in Table 7. Farrell's TE scores can be obtained by calculating the reciprocals of the input distance function values.
Results of estimation of technical efficiency levels, potential CO2 reductions, and marginal abatement costs by manufacturing sector in China and Korea.
Note: (a) Converted into dollars using the 2015-2019 average exchange rate (RMB/USD)/ (KRW/USD).
Assuming 100% production efficiency, the product of the CO2 emissions calculation described above can be multiplied by (1−TE) to estimate the maximum possible reduction in CO2 emissions by the manufacturing sector of Korea. A lower TE is associated with greater potential for CO2 reduction. As shown in the second column of Table 7, CO2 emissions could be reduced by 88.11 million tons in total, with the “metal” industry accounting for 71.1 million tons. CO2 reductions exceeding 1 million tons could also be achieved by the “compounds and chemical products” and “food” industries (13.64 and 1.03 million tons, respectively).
The potential CO2 reductions were based not only on curbing excessive fuel input but rather on reducing all inputs by the same amount under the assumption of 100% TE. The three industries in the Korean manufacturing sector with the greatest potential for CO2 emission reductions together account for 96% of the total potential reduction.
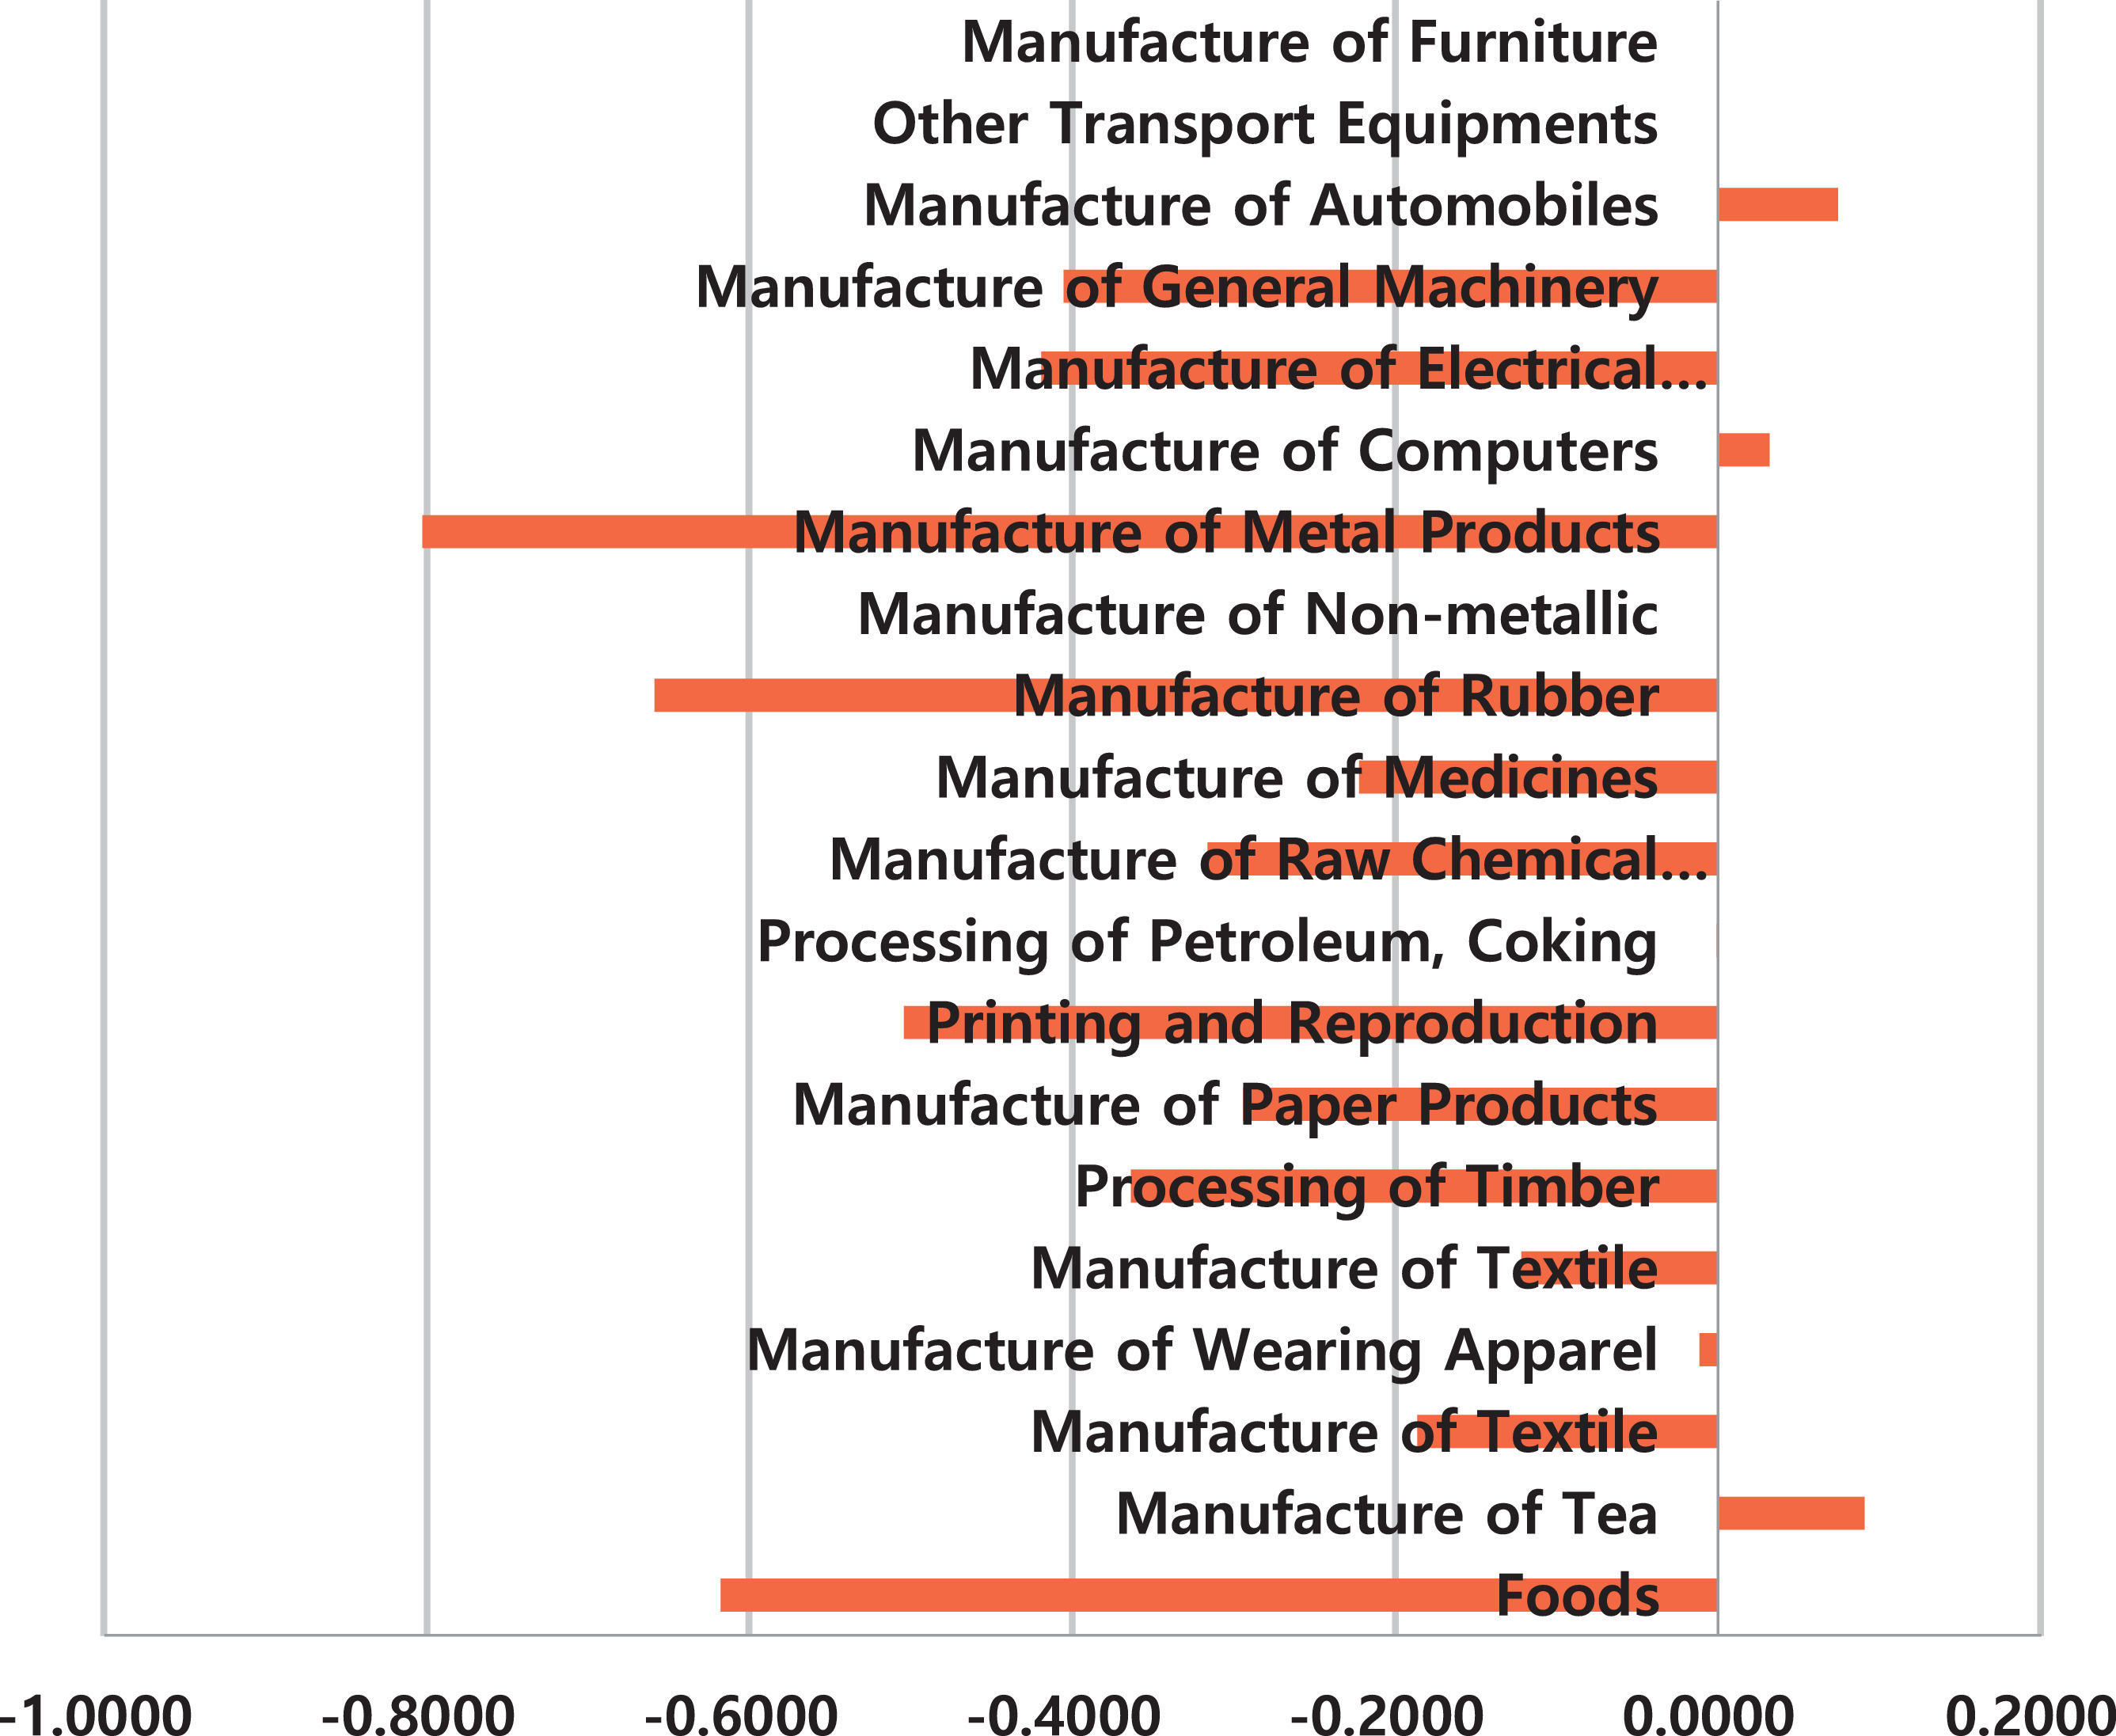
Note: (a) The TEvalues estimated based on the input distance functions of China and Korea (shown in Fig. 2) were compared. The TE of the "coke and oil refining”, "medical care”, "other transportation equipment”, and "furniture" industries were all estimated to be 1. In addition, isoquant curve analysis demonstrated that production inputs were excessive compared with outputs in Korea. Shadow prices for the Chinese manufacturing industry were estimated; the “electronics” industry had the lowest price (US$0.08/ton), while the “non-metallic minerals” industry had the highest price (US$9.73/ton; identical to that for Korea).

The average shadow price for Chinese industries was estimated to be US$1.41/ton, while pbs, which is the weighted average of CO2 emissions for all industries, was US$6.57/ton (more than twice that in Korea). The pbs of all industries except the "non-metallic minerals”, "compounds and chemical products”, "coke and oil refining”, and "textile products" industries was estimated to be < US$1/ton.
As shown in Table 8, the shadow price of the “electronics” industry in China was the lowest among all industries, at US$0.08/ton, which was also lower than that in Korea. Thus, the technological competitiveness of this industry was higher in Korea than China. Industries with greater CO2 emissions due to the use of fossil fuels have lower marginal abatement costs.
Comparison of marginal abatement cost estimates between China and Korea.
By implementing the cap and trade system in the manufacturing sector, carbon allowances would be imposed on industries emitting relatively large amounts of CO2. To estimate the potential cost savings associated with emissions trading, the 10 largest CO2-emitting industries in Korea and China were analyzed (Table 9). Under our analysis scenario, individual industries are obligated to reduce their CO2 emissions by 10% Table 10. summarizes the simulation results for the two countries.
Comparison of the CO2 shadow prices for the 10 largest CO2-emitting industries by China and Korea.
Note: c: CO2 emissions; c/q: CO2 intensity;pbs: CO2 shadow price.
WA: The weighted average by CO2 emissions for these 10 industries.
In China, pbs was estimated as US$6.57. The “non-metallic minerals” industry could lower its abatement cost by purchasing allowances rather than actually implementing abatement measures to meet the 10% cut in CO2 emissions mandated in our scenario, where the price of allowances (hereafter referred to as permits) is lower than the marginal abatement cost (by US$3.2 per ton). The total potential cost savings for this industry were estimated as US$127.79 million. Note that the “non-metallic minerals” industry pays the highest abatement cost because it has the highest CO2 intensity (c/q) among all manufacturing industries in China, as shown in Table 9. Nine other industries could benefit economically from the selling of permits. In particular, the “automobiles”, “medical care”, “beverages”, and “refined tea” industries, whose pbs and (c/q) values were the lowest among all industries, are the most likely to engage in trade with the “non-metallic minerals” industry; this is not only because they stand to gain the most economically by trading 1 ton CO2 emissions but also because such trade would facilitate CO2 emission reduction.
In Korea, the weighted average potential cost savings were estimated at US$10.44. The “chemical raw materials” and “non-metallic minerals” industries could reduce their abatement costs by US$85.05 and US$129.17 million, respectively, by purchasing permits. Potential permit sellers include the “rubber and plastics”, “metal”, “food”, “communication”, and “other electronic equipment” industries because of their relatively low pbs values.
The potential cost savings from CO2 emissions trading were compared between Korea and China. In the latter country, the market price of a 1-ton permit was calculated as US$6.57. The “non-metallic minerals” industry, whose CO2 shadow price was estimated as US$9.73, could reduce its abatement cost by US$3.2 per ton by purchasing permits. The potential cost savings of this action would amount to US$127.9 million. The effect of a 1-ton trade was found to be larger in Korea than China, given the higher estimated market price for a 1-ton permit in the former country. In any such trade, the “non-metallic minerals” industry would likely act as the buyer, with cost savings of US$85.05 and US$4.02 per ton. In both countries, nine industries in addition to “non-metallic minerals” could benefit economically by serving as sellers.
Summary and conclusionsAt the 17th UN Climate Change Conference of the Parties held in 2011, an agreement was made to extend the commitment period of the Kyoto Protocol by 5 years. Moreover, a legally binding treaty was entered into by China, the United States, and India, which are the largest greenhouse gas emitters. Meanwhile, at the Copenhagen Conference, Korea announced that it was targeting a 30% reduction in greenhouse gas emissions by 2020.6, 7
Since the key to sustainable low-carbon growth at the global level is cost-effective CO2 reductions, we estimated the potential CO2 reductions for 20 manufacturing industries in China and Korea using input distance functions and also derived marginal CO2 abatement costs.
Based on the assumption of 100% production efficiency, the maximum reduction in CO2 emissions for the Chinese manufacturing sector was estimated as 62.56 million tons, approximately 89% of which was accounted for by the "compounds and chemical products" and "paper products” industries. In the case of the Korean manufacturing sector, the industry with the highest potential for CO2 reductions was the metal industry (71.01 million tons). The average marginal abatement costs for Korean manufacturing industries was estimated as US$6.46/ton, and the weighted averagepbs was estimated as US$15.1/ton. In China, the “non-metallic minerals” industry showed the highest estimated shadow price, estimated as US$9.73/ton. The average marginal abatement cost for Chinese manufacturing industries was estimated as US$3.21/ton, and the weighted averagepbs was US$6.57/ton (more than twice that of Korea). The pbs of all industries, except the "non-metallic minerals”, "compounds and chemical products”, "coke and oil refining”, and "textile products" industries, was estimated to be < US$1/ton.
The “non-metallic minerals” industry in China could reduce its abatement cost by US$3.2 per ton by purchasing permits, for a potential cost savings of US$127.9 million. In Korea, the “chemical raw materials” and “non-metallic minerals” industries could reduce their abatement costs by US$85.05 and US$129.17 million, respectively, by purchasing permits.
Regarding the limitations of this study, the “iron and steel” and “cement” industries were excluded from the analyses due to a lack of data for China, where the technological competitiveness of these industries is inferior compared with Korea. Moreover, both quantitative and qualitative aspects of the analysis may have been affected by a lack of diversity in the Chinese data. In addition, given the heterogeneity among manufacturing industries, dummy variables for the individual industries would have been desirable, along with the use of transcendental functions to test for significant differences in production potential. This study used distance functions and was limited by a lack of probabilistic analyses. These weaknesses should be addressed in future studies comparing Chinese and Korean industries.
The paper is supported by the Scientific Research Promotion Fund for the Talents of Jiangsu University (Nos. 18JDG006, 18JDG005), and by the Project of Philosophy and Social Science Research Fund in Colleges and Universities in Jiangsu Province (2018SJA1063). And we gratefully acknowledge editors and the anonymous referees for their helpful suggestions and corrections on the earlier draft of our paper according to which we improved the content.
Major projects, i.e., those with high energy and mining resource requirements, will be undertaken in Midwest China, while projects using imported resources are scheduled to take place in coastal regions. In addition, steel, nonferrous metal, and chemical companies in urban areas are moving to the outskirts of cities to protect the environment.
Using the distance function instead of the traditional production function has the following advantages. First, it is possible to obtain multiple outputs, whereas the production function provides only scalar values. Second, since drug disposal is accounted for in the distance function, it is not necessary to make unrealistic assumptions regarding that potential source of pollution. Third, shadow prices can be derived based on the difference between distance and import functions. To reduce pollution emissions, the final amount of goods produced must also be reduced; in the case of the input distance function, if goods production is maintained at the same level, additional production factors must be inputted to achieve pollution reductions. The input distance function measures the degree to which x can be reduced relative to its maximum possible value, without reducing y.
The outputs are actual production costs, converted into US$ based on the consumer price index and exchange rates in China and Korea for the relevant years. To calculate the “intermediate year” from equation (6) using the coefficients of the trans-log distance function derived from equation (7) and linear equation (8), the observed values x and y were standardized to 1 and all logarithmic values to a value of 0. Equation (6) consists only of estimated coefficients (Grosskopf et al., 1995, p. 293).
CO2=∑ifi×hi×di×ri×(4412),i=c,o, where subscript i represents fossil fuels, i.e., coal (c) and petroleum (o), f is the amount of fuel used, h is the average calorific value, d is the carbon content per calorie, and r is oxidation.
The difference in the average input distance function values between the entire manufacturing sectors of China and Korea was calculated, to determine the validity of the comparison of competitiveness between the two countries based on isoquant curve analysis. A relatively large difference was seen between the value for Korea (0.71/1.8 = 39.4%) and that for China (0.71/1.1 = 64.5%). This was attributed to the exclusion from the analyses of the “iron and steel” and “cement” industries (for which the technological competitiveness of Korea is higher than that of China), which was in turn a consequence of the reclassification of the industries such that there was an equal number thereof (i.e., 20) in both countries.
China is aiming to achieve peak carbon emissions by 2030 and carbon neutrality by 2060. Via an energy revolution and optimization of the structure of China's industrial sector, the proportion of high energy-consuming industries will be reduced, and industrial energy efficiency and development will be enhanced. High energy-consuming industries include the “chemical raw materials”, “chemical products”, “ferrous metal smelting and rolling”, “non-ferrous metal smelting and rolling”, “non-metallic minerals”, “coke and petroleum processing”, “nuclear fuel processing”, and “supply” industries
In the case of Korea, efforts to reduce the carbon emissions of the manufacturing sector are ongoing, with the ultimate goal of achieving carbon neutrality by 2050. Greater financial support, the establishment of a green energy system, and increased production of low-carbon products could be useful to that end. In August, the Korea Institute for Industrial Economics and Trade published a report entitled “2050 Carbon Neutrality and the Path of the Manufacturing Industry” which emphasized that carbon neutrality would be very challenging considering the high dependence on fossil fuels and manufacturing-oriented industrial sector in Korea. As such, it was stated that "An active response from the manufacturing industry to enhance competitiveness is more necessary than ever." The report also stated that the major goals were to “…examine the emission characteristics of energy-intensive industries, which are currently the main industries in Korea, as well as carbon reduction strategies and support measures for each industry, and suggest strategies by which the industrial sector can achieve carbon neutrality by 2050."