


Edited by: Brij B. Gupta, Kwok Tai Chui
Last update: July 2022
More infoNew-age business and information technology paradigms that maintain present and future goals to meet their fundamental requirements while protecting nature and the variety of natural processes of ecosystems lead to sustainable development. To understand sustainable development, one must first understand that there are limits to how far society can continue to develop in its current form. With the development of information technology, the informatization and digitization of freight transportation have been realized, and it has become possible to explore new paradigms of sustainable development. However, a major improvement in freight transportation technology is needed to link environmental development with sustainable business development. In this context, on the basis of the analysis of the freight coordination evaluation index system and the availability of information data, this paper built an improved gray correlation analysis model and a coordination evaluation model. It also discussed the content of the structural adjustment of freight transport based on an empirical study of the coordination between China's freight transport and economic development. The research shows that after the adjustment of the freight structure, the economic coordination of China's freight structure has realized a V-shaped process of first decreasing and then improving. The future structural adjustment of freight transport should be focused on the eastern and central regions of China, with special attention to improving the coordination of freight transport in the central region.
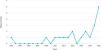
Researchers have recently taken an active interest in the creation of business models that support the goals of sustainable development (Bansal & Singh,2020;Lee & Suh, 2022; Marti & Puertas, 2022; Mangla, Kazançoğlu,Yıldızbaşı, Öztürk, and Çalık, 2022; Chopra, Singh, Gupta, Aggarwal, Gupta, and Colace, 2022). Researchers are using cutting-edge technologies, such as IoT (Madhu, Padunnavalappil, Saajlal, Vasudevan, and Mathew, 2022), smart development, RFID (Sejdiu, Ismaili, and Ahmedi, 2020), cloud computing (Al-Qerem, Alauthman, Almomani, and Gupta, 2020), and artificial intelligence (Elgendy, Zhang, He, Gupta, El-Latif, and Ahmed, 2021), for the creation of sustainable business models. Freight transportation has a significant impact on the environment and sustainable development (Benadda & Belalem, 2020; Kumar, Poonia, Gupta, and Goyal, 2021). Fig. 1 illustrates a variety of papers related to sustainable development and freight transportation that have been published. As seen in Fig. 1, scholars are increasingly concerned with building business paradigms that result in quantifiable progress beyond 2019. However, road transportation is the most unsustainable mode of transportation due to its high freight costs, high energy consumption, and heavy pollution. Since 2008, road transport has become the dominant means of transportation in China and will cross 80 billion pieces in 2020. In contrast, rail, water, and pipeline transport, regardless of their low energy consumption and low levels of pollution, comprise a decreasing proportion. The problem of poorly structured freight transport in China has become increasingly prominent. To achieve sustainable development goals through freight transport, the China State Council issued the Three-Year Action Plan for Restructuring Transportation (2018-2020) (hereafter referred to as the Action Plan). The structural adjustment of China's freight transport achieved satisfactory results between 2018 and 2020. However, the realization of adjustment goals does not mean the optimization and sustainable development of the freight transport structure. To explore the content of future structural adjustments of freight transport, it is necessary to evaluate and study the coordination between freight transport and the economy.

Coordination indicators include the supply-demand ratio, the degree of coupling, the coefficient of elasticity, and the intensity of transport. Owing to the simplicity and specificity of commonly used indicators, they are unsuitable to comprehensively measure the coordination between the freight transport structure and the economy. Therefore, this article considered establishing a comprehensive, representative and operable coordination evaluation index system for freight transportation. The freight transport system is an integral part of the economic and social system, and the two interactively influence each other. Therefore, the evaluation of coordination should reflect the degree of mutual influence between the two by including the role of economic and social development in driving the development of the freight transport industry, the role of the development of the freight transport industry in boosting economic development, and the constraints of investment in fixed assets on the development of freight transport. In this context, on the basis of the analysis of the freight coordination evaluation index system and the availability of information data, this paper built an improved gray correlation analysis model and a coordination evaluation model. It also discusses the content of the structural adjustment of freight transport based on an empirical study of the coordination between China's freight transport and economic development. The main innovation of this paper is that it constructs a comprehensive and operable index system for evaluating the economic coordination of freight structures from the perspective of the relationship between freight and the economy. Considering the difficulties of statistical work, this paper uses the improved gray correlation analysis method to solve the adaptability evaluation model, which improves the reliability of the results. This paper is structured as follows. Section 1 presents an overview of the study, Section 2 explains the comparison with previous studies, and Section 3 establishes an evaluation index system. Section 4 builds an evaluation model, Section 5 analyzes the coordination between China's freight transport structure and the economy, Section 6 presents discussions, and Section 7 concludes.
Literature reviewResearch on the establishment of coordination evaluation indicatorsDue to digitization, there has been a rapid development in the transport sector (Pashchenko, 2022; Zhou, Gaurav, Gupta, Lytras, and Razzak, 2021; Ramaru, Garg, and Chakraborty, 2022). Studies on transportation evaluation are roughly divided into two categories: transportation performance and transportation coordination. Yuan and Lu (2001) divided the evaluation indicators of the transportation system into three parts: transportation functions, including acceptability, safety and comfort; environmental protection, including air and water pollution and noise; and resource utilization, including energy, land and human resources. Kanafani and Wang (2010) established an analysis framework for the evaluation of the multimodal transport service level, constructed service level indicators from the perspective of the demand and supply sides, and used indirect utility functions to measure performance. Kumar, Parida, and Swami (2013) evaluated the performance of multimodal transport, the evaluation indicators of which included travel time, service level, interconnectivity ratio, waiting index, and operation index. Many scholars have researched coordination in transportation. The targets of sustainable transportation generally include pollution control, energy consumption, the reduction of accident rates, and the improvement in the livability and economic well-being of cities. Kennedy, Miller, Shalaby, Maclean, and Coleman (2005) put forward the four pillars of sustainable transportation: effective regulations on land use and transportation; fair, efficient and stable investment; strategic infrastructure; and attention to neighborhood design. Jeon, Amekudzi, and Guensler (2010) adopted a multicriteria decision-making method and evaluated transportation coordination in the Atlanta region based on four indicators: transportation efficiency, environmental coordination, economic coordination, and social coordination. Salling and Pryn (2015) developed a sustainable planning and decision-making support framework for the assessment of transportation infrastructure. They evaluated four aspects of transportation coordination: technology and infrastructure, business and finance, policies and institutions, and social and community groups. Rajak, Parthiban, and Dhanalakshmi (2016) used fuzzy logic to evaluate the performance of sustainable transportation. They stated that coordination included four dimensions: economic coordination, social coordination, environmental coordination, and the effectiveness of the transportation system. Ahangari, Garrick, and Atkinson-Palombo (2016) developed the National Transportation Coordination Index based on ten different coordination indicators and used this framework to test the coordination indices of the United States and 27 European countries from 2005 to 2011. Lu and Liu (2018) constructed an evaluation system for the development of sustainable transportation based on SVM from four perspectives: economic development, transportation demand, energy consumption, and environmental pollution. Kumar and Anbanandam (2019) adopted fuzzy logic to evaluate the coordination of the freight transport industry in developing countries such as India using an evaluation framework consisting of 74 social coordination indices, 16 dimensions, and 4 enablers. Pathak, Thakur, and Rahman (2019) proposed a framework for evaluating coordination performance that included a four-stage model integrating Delphi research, TISM (Total Interpretive Structural Modeling) and FAHP (Fuzzy Analytical Hierarchy Process). They used SPI (Sustainability Performance Index) scores to help logistics professionals select the most sustainable freight transport system. These studies show that freight transport is evaluated primarily from the perspectives of service level and environmental sustainability. However, few studies have conducted this evaluation based on coordination between freight transport and economic development; thus, it is necessary to study this issue from the perspective of coordination with the economy. The comparison between this study and the above literature is shown in Table 1.
Literature comparison (a)
| Research on freight evaluation | Transportation sustainability evaluation | Freight industry evaluation | Coordination of freight structure |
| Yuan and Lu, 2001 | √ | √ | - |
| Adib and Wang, 2010 | - | √ | - |
| Kumar etc., 2013 | - | √ | - |
| Kennedy and Miller, 2005 | √ | - | - |
| Jeon etc.,2010 | √ | √ | - |
| Salling and Pryn, 2015 | √ | - | - |
| Rajak etc.,2016 | √ | - | - |
| Ahangarietc.,2016 | √ | - | - |
| Lu and Liu,2018 | √ | - | - |
| Kumer and Anbanandam, 2019 | - | √ | - |
| Pathak etc,.2019 | - | √ | - |
| This study | - | √ | √ |
The relationship between transportation and sustainable development has been a constant concern and a subject of research. Different studies roughly divide the causal relationship between the two into four types. The first is unilateral influence, of which there are two options. The first is that transportation drives economic growth, such as in India from 1970 to 2010 (Pradhan, 2010; Pradhan & Bagchi, 2013), Iran from 1963 to 2009 (Bahrami, 2012) and China from 1975 to 2007 (Sahoo, Dash, and Nataraj, 2012). The second option is that economic development promotes the growth of transportation, such as in the case of Côte d'Ivoire from 1970 to 220 (Keho & Echui, 2011) and in India from 1990 to 2011 (Maparu & Mazumder, 2017). The second type of causal relationship is mutual influence, that is, mutual promotion and mutual cause-and-effect interactions between transportation and economic development, such as in the case of Nigeria from 1983 to 2012 (Odinakachi, Ezeji, andAkujuobi, 2015) and the relationship between transportation and economic growth in 75 countries covering high, middle, and low incomes from 2000 to 2014 (Saidi & Hammami, 2017). The third type is the coexistence of unilateral and mutual influence in subregions. For example, Yu, De, Storm,and Mi (2012) used China's panel data and Granger causality framework to verify the relationship between transportation and economic growth in China. They found mutual influence in eastern China and unilateral influence in Central and Western China. For the fourth type, the causal relationship cannot be determined. For example, the study by Kuştepeli, Gülcan, and Akgüngör, (2012) on the relationship between infrastructure and economic growth in Turkey did not show a clear causal relationship between the two. Bhunia (2011) posited that although transportation infrastructure and economic growth had a mutual positive influence on each other in India between 1991 and 2010, the influence was not significant. This review of the literature shows that most studies have focused on the evaluation of transportation infrastructure and its relationship with economic growth, while less attention has been given to the relationship between freight transport and the economy (Gao, Zou, Chen, Ma, Li, and Zhang, 2020). Few studies have been conducted on the coordination between different modes of freight transport in different regions and the coordination between different modes of freight transport and the economy as a whole or from a regional perspective. The comparison between this study and the above literature is shown in Table 2.
Literature comparison (b)
| The relationship between transportation and economic growth | Transportation drives economic growth | Economic growth promotes transportation | Freight and economic relations |
| Pradhan,2010; | √ | × | - |
| Bahramim, 2012 | √ | × | - |
| Sahoo etc., 2012 | √ | × | - |
| Pradhan and Bagchi, 2013 | √ | × | - |
| Keho and Echui, 2011 | × | √ | - |
| Maparu and Mazumder, 2017 | × | √ | - |
| Odinakachi etc., 2015 | √ | √ | - |
| Saidi and Hammami, 2017 | √ | √ | - |
| Yu etc., 2012 | Eastern China | Eastern China, central and Western China | - |
| Bhunia, 2011 | Not significant | Not significant | - |
| Kuştepeli etc.,2012 | Not obvious | Not obvious | - |
| This study | - | - | √ |
Establishing scientific and reasonable evaluation indicators is the basis for determining whether the structure of freight transport is coordinated with economic development. Therefore, determining a reasonable index system using methods such as cluster analysis, comparative analysis, and qualitative and quantitative analysis is necessary. Other requirements include a consideration of the principles of integrity, pertinence, and operability of the evaluation indicators and ensuring the scientificity and validity of the selection of indicators through the preliminary selection and improvement of indicators.
Principles for indicator selectionOwing to the complex interaction between freight transport and economic development, to ensure its effectiveness, objectivity, and practicality, indicator selection must be carried out under the guidance of a series of selection principles.
- (1)
The principle of comprehensiveness. The impact indicators of freight transport on the economy and the impact indicators of the economy on freight transport should be included equally. Similarly, the impact indicators of various elements of freight transport on the economy and the impact indicators of economic development factors on freight transport must be included.
- (2)
The principle of dominance. Having too many indicators precludes concentrating on the key impact indicators of freight transport and the economy, leading to a lack of dominance and significance in the evaluation. Therefore, selecting key indicators is necessary.
- (3)
The evaluation indicators must reflect the future trend of freight transport and economic development. In other words, freight transport must meet the needs of economic development at present and in the future.
- (4)
Given that some indicators are noncomputable or require overly complicated calculation methods, selecting indicators that are computable, data supported, and objective is necessary for the calculation of indicators to be operable.
- (1)
Perform a cluster analysis of the indicators and divide them into input indicators and output indicators;
- (2)
Perform comparative analysis on the indicators and select typical indicators in each category. The steps are as follows. First, assume that the set of indicators in cluster analysis is Xi={xi1,xi2,⋯,xij},|(i,j=1,2,⋯,n); and xij represents the ith indicator in the jth category of indicators. Second, let Xij={xij1,xij1⋯,xijp} be the sample of the ith indicator in the jth category of indicators, Xil={xil1,xil1,⋯,xilp,⋯,xilN} be the sample size of the ith indicator in the lth category, p=1,2,⋯,N, and N be the number of samples. Calculate the correlation coefficient of the ith indicator and the jth indicator in the lth category of indicators rijl, as represented in Eq. 1:
Third, calculate the coefficient of determination of the i-th indicator in the j-th category of indicators (Eq. 2): - (3)
Qualitative and quantitative analyses were performed on the indicators, and rij2¯=max{rij2¯} was selected as the typical indicator in this category of indicators.


The commonly used method for the preliminary selection of indicators is the three-level indicator selection method. Specifically, it divides indicators into the target, criterion, and indicator layers, which, in turn, are further decomposed in a top-down manner to form a pyramid indicator establishment process. Based on the input–output method, the indicators of the freight transport industry are divided into input and output. The former includes the established infrastructure and future planned investment, and the latter can be measured by freight volume. These two aspects can fully reflect the development level of the freight transport industry from a macroperspective. Therefore, this study measured the development of the freight transport industry from these two aspects. In a preliminary selection, the development of the freight transport industry can be measured on the basis of the following indicators.
- (1)
Infrastructure investment. The operating mileage of the transportation infrastructure is the foundation for the development of the freight transport industry. Factors such as operating mileage, including highway mileage, railway operating mileage, waterway mileage, and air transport mileage, reflect the scale, accessibility, and reliability of the freight transport industry. These factors are basic indicators used to measure the development of the industry. The amount of investment in freight transport reflects the future development trend of the industry, and this indicator should also be included. In addition, transportation is largely achieved by transport carriers, and this indicator can be measured by the number of carriers.
- (2)
Size of the freight transport market. This reflects the total freight transport services provided by the freight transport industry and is the most direct manifestation of the functions of this industry. The size of the market can be measured by the volume of goods and the turnover of goods. Given that freight turnover reflects both freight volume and transport distance, it is a more representative indicator.
- (3)
Boost in employment. The development of the freight transport industry has also introduced a large number of jobs. The increase in employment, in general, reflects the connection between the freight transport industry and economic development. Through employment, earned income is further converted into consumption, thereby becoming a driving force for economic development.
- (4)
Management level. The coordination between freight transport and economic development depends not only on “hardware” but also on “software,” especially rules and regulations, laws and legislations, organizational planning, and operations management.
- (5)
Size of the economy. The level of economic development can be measured by the aggregate output, GDP per capita, and industrial structure. The trend of economic development can be measured by the economic growth rate or total investment.
- (6)
Other indicators. Examples include the rate of traffic accidents and the degree of traffic congestion.
The Statistical Bulletin on the Development of the Transportation Industry issued annually by the Ministry of Transportation measures the development of the transportation industry from four perspectives. Infrastructure, transportation facilities and investment in fixed assets can be used as input indicators, and transportation services can be used as output indicators. According to the principles of comprehensiveness, dominance, dynamics, and operability of indicator selection and the coefficient of determination of the indicators, the established infrastructure can be measured by the length of the route and the number of transport carriers, future investment is measured by the investment in fixed assets, and the freight transport market size is measured by freight volume and freight turnover. Considering that freight turnover is the product of freight volume and transportation distance, it is selected as a more representative indicator. The number of employees also reflects the development of the transportation industry and should also be included as an indicator. Aggregate output is an important indicator to measure the level of economic development, followed by industrial structure. Therefore, the indicator can be expressed by comparing the transportation industry with the aggregate output, such as the coefficient of elasticity of the volume of cargo and economic development. According to the concept of coordination between freight transport and social and economic development, based on the decomposition of the input and output characteristics of the freight transport system and adhering to the principles of consistency between indicators and objects of evaluation, comprehensiveness, dominance, dynamics, and operability, a number of evaluation indicators have been selected. In addition, the analytical hierarchy process is used to screen and consolidate the indicators. The final evaluation index system established is shown in Table 3. This system consists of three levels. The first is the target level, namely, the coordination between transportation and the economy. The second is the criterion level, which includes five criteria: infrastructure, transport carriers, freight services, the growth rate of freight transport, and employment. The criterion level is the manifestation and analysis object of coordination evaluation. The third is the indicator level, which includes 10 specific quantitative indicators.
Adaptability evaluation index system
Weighting methods are roughly divided into three types, subjective, objective, and comprehensive weighting; the latter combines the first two types. Subjective weighting methods include the Delphi method (the expert method) and the analytic hierarchy process. Objective weighting methods include principal component analysis, entropy, and mean-square error methods. The comprehensive weighting method is a combination of subjective and objective weighting and includes the TOPSIS method. Considering the particularity of this study and the availability of data, this paper adopted an objective weighting method that uses base points to calculate weights, namely, the weighted minimum Euclidean distance method based on ideal points. Assume that n evaluation objects and m subtargets affect each comprehensive evaluation value. Let Xij denote the value of the jth subtarget of evaluation object i. Then, the matrix composed of n objects and m subtarget values is (Xij)(m×n). To make different evaluation objects comparable, the unit of the evaluation object needs to be nondimensionalized. This paper adopted the relative membership degree function to nondimensionalize Xij, with minXij being the minimum value among the indicators j and maxXij being the maximum value among the indicators j. The quantification method is as follows.
- (1)
Obtain indicators directly according to Eq. 3:
- (2)
Calculate the obtained indicators according to Eq. 4:


To compensate for the deficiency of gray average correlation analysis, this paper uses the modified algorithm to solve the model. The specific solving steps are shown in Fig. 2.
Average degree of gray correlationConcept of average degree of gray correlation
Let F:X→x and F be the numerical mapping sets of X, that is, F= (first value normalization, mean normalization, maximum value normalization, minimum value normalization, interval normalization, and positive factor normalization) and x is the set of gray correlation factors. Let x0={x0(k)|k=1,2,3,…n} be the reference array and xi={xi(k)|k=1,2,3,…n} be the comparative array, where x0,xi∈x(i=1,2,…m). Then, the correlation coefficient F between the comparative array and the reference array at each point is given by Eq. 6:
where ρ is the resolution coefficient. It has the maximum amount of information and the maximum information resolution when ρ∈[12(e−1),12], and generally, its value is ρ=0.5. The average gray correlation degree can be expressed as:Disadvantages of average degree of gray correlation

Eq. 7 shows that the average degree of gray correlation is obtained by averaging the correlation coefficients between the comparative array and the reference array at each point, while the importance of each specific target in the comparative array and the reference array has been ignored. In addition, with the algebraic sum ∑k=1nζ0i(k) of the correlation coefficients of all points remaining constant, fluctuations of the correlation coefficient ζ0i(k) at each point will not affect the degree of correlation. Therefore, Eq. 7 has certain limitations in practice, so it is weighted to obtain Eq. 8:
Weighted gray correlation degree
Assume that domain U={xj(1),xj(2),⋯,xj(n)},(j=1,2,⋯,m) where FuzzysetAj means that xj(k) is related to x0(k); then, Aj can be expressed using Eq. 9 as:

For any two FuzzysetsAj, the nearness degree between Al(j=1,2,…m) can be expressed with the Euclidean distance degree, as shown in Eq. 10:

Given Al=(1,1,…,1), it indicates the strongest correlation between xl and x0, which is called ideal correlation. Therefore, the nearness degree between Aj and the ideal correlation Ae can be the correlation between xj and x0:

Eq. 10 is the gray Euclidean correlation degree. In practice, considering the different levels of influence of each element, Eqs. 10 and 11 can be converted into Eqs. 12 and 13 after the weight is introduced:


The degree of correlation of the system reflects the degree of similarity between the curves formed by the arrays of numbers and is an overall measure of the degree of similarity between two curves. Therefore, the similarity of the development trend of the system represented by the degree of correlation is not only related to the average value of the correlation coefficients at each point but also related to the fluctuations of the correlation coefficients at each point to its average value. For the comparative array xj and the reference array x0 at each point, assume that the fluctuation of the correlation coefficient ζ0j(k) between the two arrays, compared with the average value r0j¯, is ε0j(k). Then, ζ0j(k) can be expressed using Eq. 14:
becauseThus,Therefore, Eq. 13 can be sorted as;


Eq. 17 is the average gray Euclidean correlation degree after the weight is introduced, compensating for the shortcomings of the average correlation degree to a certain extent and justifying the gray correlation degree method of analysis. Eq. 17 not only considers the influence of the average value r0j¯ of the correlation coefficients between the comparative array and the reference array at each point on the degree of correlation but also considers the influence of the fluctuations ε0j(k) of the correlation coefficients at each point on the degree of correlation. When r0j¯ is constant, if ε0j(k) increases, the degree of correlation decreases. When ε0j(k) is constant, if r0j¯ increases, the degree of correlation also increases. In particular, when r0j=1,ε0j(k)=0, the degree of correlation is the greatest, that is, r0j=(r0j)max=1. At this time, the development trend of the comparative array xj is exactly the same as that of the reference array. Considering that the freight transport structure is composed of five modes of transportation, the coordination between the freight transport structure and the level of economic development can be evaluated comprehensively by the coordination between each mode of transportation and the level of economic development. With different modes of transportation playing different roles, the weight of a mode can be measured by the proportion of this mode in freight turnover. The coordination between the freight transport structure and the economy can thus be measured by Eq. 18:
where ω represents the weights of various modes of transportation and Sfre−1,eco represents the degree of coordination between the ith mode of transportation and the economy.Coordination analysis
Based on fuzzy theory and the establishment of the coordination model, the coordination between the five modes of transportation in the freight transport structure and economic development was evaluated. This paper conducted an empirical study of China's freight transport industry and economic development from 2016 to 2020 (only available at the time of conducting the research).
Data acquisitionData in this paper come from sources that include the National Bureau of Statistics (National Bureau of Statistics of China 2022) and annual volumes of the China Transportation Statistical Yearbook (China Statistical Yearbook 2020). The statistical data of each indicator are shown in Table 4.
(a) Road transport coordination indicators
Based on the value of the development level of the freight transport industry, let the adjustment coefficients be α1=1,β1=0.6,andβ2=0.6, and use the membership degree function to nondimensionalize the indicators into numbers in [0,1]. The results are shown in Table 5.
(a) Evaluation value of the road transport index
The weights of the indicators were obtained using the weighted minimum Euclidean distance method, as shown in Table 6.
Indicator weight values
The results of the average gray Euclidean correlation degree are shown in Table 7.
The correlation of indicators indicates that in 2020, among all modes of transport in the freight transport structure, rail transport has the strongest correlation with economic development, followed by air transport, pipeline transport and water transport. Road transport has the weakest correlation. A possible reason for this result is that China implemented the Action Plan in 2018, which requires optimizing the structure of freight transport, greatly increasing the proportion of freight carried by rail and promoting a 30% increase in the volume of freight by rail in 2020 compared to 2017. Therefore, the rail freight transport industry has developed rapidly in recent years. Owing to the extensive air pollution and high energy consumption of road transport, its development has been further slowed down in recent years due to the implementation of the Action Plan, resulting in the decline in the correlation between the road freight transport industry and economic development. China's structural adjustment of the freight transport industry has been recognized by major countries and regions around the world. Europe and the United States are also increasing the proportion of rail freight transport. Increasing the proportion of rail freight transport not only requires administrative means but also the integration of rail transport and road transport, the increase in the transport capacity on dedicated routes, and the maximization of the efficiency of rail freight transport.
Evaluation of the coordination of freight transport structureGenerally, the standard of coordination evaluation is ρ=0.5. Specific standards are shown in Table 8.
Considering the degree of coordination between each mode of transportation and economic development and the proportion of different modes in the structure of freight transport, the degree of coordination between the structure of freight and economic development is calculated. The results are shown in Table 9.
Adaptability of freight structure to economic development
In terms of the degree of coordination between each mode of transportation and the economy, rail transport has the greatest degree of coordination in 2020 and is considered to be well coordinated. Rail transport is followed by water and road transport, which are considered to have a basic level of coordination. Pipeline transport is considered relatively coordinated. Air transport has the lowest degree of coordination and is considered undercoordinated. For each mode of transportation:
- (1)
One possible reason for the decrease in the degree of coordination of road transport between 2017 and 2019 may be the change in statistical standards, which has reduced the number of trucks in road transport and reduced the degree of membership of roads to 0.6. The Action Plan also aimed to reduce the proportion of road transport, leading to a decrease in the volume of freight and the turnover of road transport and thus a decrease in the coordination of road transport.
- (2)
The coordination of rail freight transport has been greatly improved. A possible reason for this improvement is the implementation of the Action Plan, which has improved the coordination between rail freight transport and the economy by increasing the operating mileage, number of vehicles (Mirsadeghi, Rafsanjani, and Gupta, 2021), freight volume, and freight turnover of rail transport, as well as future investment in fixed assets.
- (3)
The degree of coordination of the water freight transport industry declined between 2016 and 2019, resulting mainly from the decrease in operating profits and the change in statistical standards. These changes have reduced the number of ships and workers involved in water transport. Fixed investment in water transport has also been declining.
- (4)
The degree of coordination of the pipeline transport industry has been declining in the past three years, mainly due to the decline in fixed investment in pipeline transport and the number of employees.
- (5)
The reason for the decrease in the degree of coordination of air transport is the relatively low fixed investment in air transport in China and the low volume and turnover of air freight. In terms of the proportion of air transport in freight transport, the degree of coordination of air transport hardly affects the coordination between the structure of freight transport and economic development.
- (6)
In terms of coordination between the overall structure of freight transport and economic development, between 2016 and 2019, freight transport and economic development were moderately coordinated, while the coordination of freight structure was significantly improved in 2020. The main reason is that the implementation of the Action Plan increased the fixed investment in railways, waterways and road transportation, the length of the line, the volume of vehicles, freight volume and so on, which has improved the coordination of the main transportation modes. In a short period, promoting the rapid development of rail freight transport may trigger a decline in the coordination of the overall freight transport structure. This result indicates that in transforming the structure of freight transport, attention needs to be paid to the coordinated development of the five modes of transportation, especially to promote the development of road–rail and road–water intermodal transport.
China is divided into four regions that vary by level of regional development: the eastern, central, western, and northeast regions. The coordination between the structure of transport and regional economic development is studied. The eastern region comprises the 10 provinces and cities of Hainan, Guangdong, Fujian, Zhejiang, Jiangsu, Shanghai, Shandong, Hebei, Beijing and Tianjin. The central region includes the 6 provinces of Hubei, Hunan, Henan, Anhui, Jiangxi, and Shanxi. The western region comprises the 12 provinces and autonomous regions of Guangxi, Yunnan, Guizhou, Sichuan, Chongqing, Tibet, Qinghai, Shaanxi, Gansu, the Ningxia Hui Autonomous Region, the Xinjiang Uygur Autonomous Region, and Inner Mongolia. The northeastern region comprises the 3 provinces of Liaoning, Jilin, and Heilongjiang. The evaluation of the coordination between freight transport structure and the economy in 2019 for each of the regions is shown in Table 10.
The freight transport structure and the economy in the eastern and central regions are relatively coordinated. In the western and northeastern regions, the situation is slightly better, with the two being moderately coordinated. A possible reason behind this finding is the mismatch between the freight demand structure and the freight supply structure in the eastern and central regions. In the western and northeastern regions, the freight demand is relatively low. Therefore, the freight supply can effectively meet the demand for freight, thus improving the coordination between the structure of freight transport and the economy. This result indicates that the eastern and central regions remain key areas for the structural reform of China's freight transport in the future, as also demonstrated by the calculations of (Gao et al. 2020).
Analysis of regional coordinationAmong the five modes of transportation, road, rail and water transportation are the main modes, while pipeline and air transport are less related to the other modes due to their particularities. Therefore, this paper focuses on the degree of coordination between roads and railways, roads and water, and water and railways in the four major regions of China. The results for 2020 are shown in Table 11.
Table 11 indicates there is good coordination between road and rail transport in the eastern, central and western regions and basic coordination in the northeast region. The coordination between road and water transport is excellent in the eastern and northeast regions and good in the western region but poor in the central region. The coordination between rail and water transport is moderate in the eastern, western, and northeastern regions, while it is poor in the central region. The central region plays a critical role in China's transportation in linking the east and the west and connecting the south to the north, forming a transportation network consisting of three axes, three corridors, and four channels. Compared with the expansion of the transportation network, the supply of freight is slightly insufficient, reflected particularly in the poor connection between road and water transport and between rail and water transport. The lack of effective coordination and overall planning among the three modes of transportation has resulted in the inefficient use of transportation resources. The central region should fully use the Yangtze River as China's primary waterway, advance the development of water transport infrastructure and comprehensive transportation hubs, and effectively connect water transport with rail and road transport in the central region. The region should also establish a “two-stream, nine-tributary” waterway system represented by the main artery of the Yangtze River and consisting of 11 high-grade national waterways, namely, the Huai River, the Xiang River, the Yuanshui River, the Han River, the Jianghan Canal, the Gan River, the Xinjiang River, the Heyu Waterway, the Wushen Canal, and the Shaying River. These initiatives will promote the coordinated development of different modes of transportation in the central region.
ConclusionTo determine the areas and priority of future investment in China's freight transport industry, this paper based its analysis on the weighted gray correlation analysis method in gray theory. This paper then improved it using the weighted Euclidean method to evaluate the degree of coordination between China's freight transport structure and economic development from 2016 to 2020. The findings are as follows.
- (1)
In terms of the degree of coordination between each mode of transport and the economy, rail transport has the highest degree of coordination in 2020 and is considered well-coordinated. Rail transport is followed by water and road transport, which are considered to have a basic level of coordination. Air transport has the lowest degree of coordination and is considered to be relatively coordinated.
- (2)
From the perspective of the coordination between the overall freight structure and economic development, the freight structure and economic development were basically coordinated from 2016 to 2019, while the coordination of freight structure was improved to being well coordinated in 2020. This shows that through a series of measures, the promotion of the Action Plan has greatly improved the degree of coordination between the freight structure and the economy.
- (3)
In terms of different regions, the freight transport structure and the economy in the eastern and central regions are not well coordinated, while in the western and northeastern regions, the situation was slightly better. A possible reason for this finding is the mismatch between the freight demand structure and the freight supply structure in the eastern and central regions. In the western and northeastern regions, the freight demand is relatively low. Therefore, the freight supply can effectively meet the freight demand, improving the coordination between the freight transport structure and the economy. This result indicates that the eastern and central regions are still key areas for the supply-side reform of China's freight transport structure. In terms of the coordination of different modes of transport, coordination between road and rail transport is excellent in the eastern region, relatively good in the central and western regions, but only moderate in the northeast region. The coordination between road and water transport is excellent in the eastern and northeastern regions, relatively good in the western region, and poor in the central region. The coordination between rail and water transport is moderate in the eastern, western and northeast regions and poor in the central region. Therefore, the central region is the primary area for the reform of the supply side of China's freight transport structure.
Owing to the lack of relevant data on modes of transportation, the established index system for freight and economic development remains incomprehensive. Future research may consider integrating subjective and objective evaluations to further enrich the evaluation index system and introduce data on factors such as traffic congestion and traffic accidents. In addition, due to changes in statistical standards, inconsistencies in the data were observed, weakening the reliability of the evaluation.
Data AvailabilityThe data used to support the findings of this study are included within the article.
This research was supported by Wenzhou Philosophy and Social Science Planning Project (22WSK305) and the Ministry of Education Humanities and Social Sciences Fund Project (17YJC630109).