


El pescado es la fuente de proteína animal más barata en Nigeria, y el pescado seco en particular tiene el potencial de resolver el problema de la generalizada carencia de proteínas, gracias a su relativa asequibilidad respecto al pescado fresco. Potenciar el consumo de pescado seco conllevará una reducción del precio minorista, lo que solo se puede lograr si el mercado de pescado seco opera eficientemente. Tras probar y corregir la serie de precios eliminando la estacionalidad, este estudio modeliza la eficiencia del mercado en 66 pares de mercados separados en el espacio. Se ha utilizado la prueba de raíz unitaria para descubrir el grado de integración econométrica de la serie de precios. Toda la serie de precios se mostró no estacional en cada nivel (p < 0,05), pero al estimador de primera diferencia todas rechazaron la hipótesis nula de ausencia de estacionalidad. Esto confirma que se generan por los mismos procesos estocásticos, por lo que pueden mostrar equilibrio espacial a largo plazo. La prueba de vector autorregresivo muestra que en el 59,1% de los mercados los precios están espacialmente integrados. El modelo de causalidad de Granger reveló que los precios en los mercados de Bauchi, Akure, Makurdi y Kano guían los precios en otras localidades. El mercado de Kano muestra fuerte exogeneidad, mientras que otros muestran tanto mucha como poca exogeneidad. Se concluye que la eficiencia de precios del mercado del pescado seco en Nigeria es de poco alcance. Para potenciar la eficiencia espacial de los precios, el estudio recomienda mejoras en las infraestructuras del mercado y en la captura, el tratamiento y la divulgación de datos, así como reformas políticas esenciales dirigidas a reducir los precios minoristas en los mercados de referencia identificados.
Fish is the cheapest animal protein source in Nigeria, and dry fish in particular has the potential to solve the pervasive protein shortage problem owing to its relative affordability compared with fresh fish. Boosting dry fish consumption will entail retail price reduction which is achievable only if the market for dry fish operates efficiently. This study, after testing and correcting price series for non-stationarity, modelled marketing efficiency in 66 pairs of spatially separated markets. The unit root test was used to reveal the order of econometric integration of the price series. All price series showed non-stationarity at their levels (P<0.05), but on first-differencing, they all rejected the null hypothesis of non-stationarity. This confirmed that they were generated by the same stochastic processes and, thus, capable of exhibiting long-run spatial equilibrium. The vector auto-regressive test showed that 59.1% of the markets had prices which were spatially integrated on the long-run. The Granger-causality model revealed that prices in Bauchi, Akure, Makurdi and Kano markets were driving prices in other locations. Kano market exhibited very strong exogeneity while others were either strongly or weakly exogenous. It is concluded that there is low extent of spatial pricing efficiency in Nigeria's dry fish market. The study recommended improved market infrastructures, improved information collection, collation and dissemination, and decisive policy reforms aimed at lowering retail price at the identified leader markets, as ways of enhancing spatial pricing efficiency.
1. Introduction and problem definition
As against the long-held doctrine that agricultural marketing is less important compared with physical transformation or production, economic scholars and development practitioners have in the last three to four decades paid considerable attention to studying agricultural marketing for a number of reasons. First is that if marketing channels were less complex, more goods will flow through them and reach more consumers at less cost. The second is that, as posited by Abbot (1967), it is vitally important to integrate the expansion of marketing functions with the expansion of production. This is necessary because distribution plays an indispensable role in economic development. Finally, market integration plays a pervasive role in both agricultural and industrial development (Ravallion, 1986; Dittoh, 1994; Chir wa, 2001; Mafimisebi, 2001; Okoh & Egbon, 2003; Nielsen et al., 2006). This is owing to the fact that a well-linked market is that capable of facilitating optimum allocation of goods and resources.
The fact remains incontrovertible that nutrition is both an outcome of and input to national development in any country. This explains why policy makers and operators earmark considerable proportion of national resources to the food and nutritional needs of the masses of any country. Evidently, nutritional status depends among other factors, on access to food, which takes two dimensions; physical access and economic access. Physical access is synonymous with "availability' while economic access is interpreted to mean "affordability". While the latter is determined by income level or purchasing power, the former thrives on an efficiently operating distributive/marketing system. The requirement that the distributive system functions with a high degree of efficiency is important especially in third world countries where majority of the citizens live below the poverty line and food expenditures account for up to 80% of household's monthly expenditure. Owing to this situation, consumption of high-value foods is rare because people merely 'eat' to survive and bother less about feeding to nourish the body and live a healthy live. The high-value foods are costly compared with carbohydrate-rich diets. This necessitates an examination of high-value foods for their extent of marketing efficiency to reveal areas of possible savings in cost.
The level of animal protein consumption per caput per day in Nigeria is estimated at 7.0 g compared with the recommended 35.0 g. Shaib et al. (1997) reported a figure of as low as 3.25 g per head per day for people in the poor socio-economic class. Judged by the importance of animal protein in human's physical, physiological and mental development, the low consumption of animal protein has been a source of worry to nutritionists, policy makers and operators in Nigeria.
In Nigeria, fish is the cheapest animal protein source. Dry fish, in particular, is regarded as possessing the potential to solve the pervasive protein malnutrition problem in the country because of its relative affordability compared with fresh fish. Thus, dry fish seems to be the hope of the poor for increasing their consumption of animal proteins. Boosting the level of dry fish consumption will necessarily entail retail price reduction which is achievable only if the market operates efficiently. Since inefficiency in a marketing system at both intra- and inter- market levels is capable of jacking up delivered price, examining the Nigerian dry fish market for its extent of spatial pricing efficiency is crucial to achieving remunerative prices for producers and other market intermediaries and rendering retail prices affordable by final consumers. This is a desideratum for sustaining production and enhancing nutritional well-being of the populace.
The ability of a marketing system to efficiently carry out its function of contributing positively to the development of a country depends on the ease with which price changes and responses are transmitted spatially and temporally between markets for a homogeneous commodity. Owing to unavailability of data on transactions cost or low quality of such data in developing countries, synchronous price movement overtime has been accepted as a proxy for assessing marketing efficiency. A marketing system in which synchronous movement of prices is observed among spatially dispersed markets is considered as being integrated and market integration enhances efficient allocation of productive resources, static agricultural efficiency, short-term food price stability and long-term growth (Baulch, 1995).
The major objective of this paper is to assess the Nigerian dry fish market for presence and extent of long-run spatial equilibrium at the retail market level. The specific objectives are to; i) determine the extent of variability in retail prices; ii) test for the presence and degree of long-run spatial pricing efficiency and iii) identify markets exhibiting exogeneity in price formation and transmission.
2. Theoretical framework
Tests of market integration seek to measure the extent to which prices in different markets are inter-related. Although three forms of market integration are often distinguished, spatial integration has received most of the attention in the agricultural marketing literature.
Market integration studies are executed based on information on prices, with the analyses usually restricted to nominal prices for a homogeneous commodity in geographically dispersed markets. Tests of markets integration have become, therefore, attempts to assess the statistical association between two time series. There are five main approaches employed for testing market integration. These, in roughly chronological order of their first use in the literature are: correlation analysis, the law of one price (LOP), the Granger-causality approach, the Ravallion model and co-integration (Baulch, 1995). Alexander and Wyeth (1994), Baulch (1997) and Mafimisebi (2001) had done in-depth documentation of the step-by-step procedure involved in each of the aforementioned test approaches.
In understanding these approaches for testing market integration, it is germane to distinguish between three possible meanings of the word "integrated". The first is a statistical one and reference is to the stationarity of a univariate time series. A series is integrated of order one, or I(1), if it is not stationary in levels but stationary after first-differencing or logarithmic transformation or both depending on the cause of non-stationarity. Time series with common trend often turn out to be I(1). The second meaning of the word "integrated" is also statistical, but carries econometric overtones. Two (or more) spatial time series are said to be "co-integrated" or exhibit long-run equilibrium, if they are both non-stationary individually but a linear combination exists between them which is stationary. That is, if Xt ~ I(P) and Yt ~ I(P), their linear combination should be integrated of order I(P-I). In most instances, it is generally agreed that if the spatial price series are statistically integrated, then the market from which they emanate are economically integrated. Similar associations are made between market integration and the statistical co-movement of prices in the long run (Baulch, 1995).The third meaning of integration is an economic one based on arbitrage conditions. Two markets are integrated if whenever trade takes place between them, the price differentials for a homogeneous commodity equal transactions costs i.e
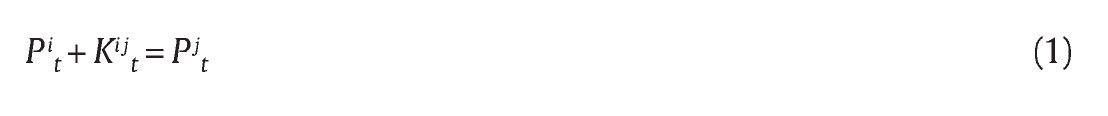
When the same markets do not trade, price differentials for the commodity must be less than transaction costs. i.e

Equations (1) and (2) are recognized in the literature as the spatial arbitrage condition, and both are consistent with food market integration. It is the first two meanings of integration that are used to define market integration in this paper. The author intends to provide further information on the first two connotations of integration briefly mentioned above in the methodology section.
3. Methodology
3.1. Sources and scope of data
The data for this study were derived from secondary sources. The bulk of the data was from the monthly dry fish price series collected by the Federal Office of Statistics (FOS) now called National Bureau of Statistics (NBS). The Federal Department of Fisheries (FDF) and the market survey publications of relevant State Ministry of Budget and Economic Planning supplied additional data to compliment the FOS data. The data collected represent the average for the 15 most important fish species which account for over 90% of total volume of freshwater fish consumed in Nigeria.
Monthly retail price covering between January, 1997 and December 2008 inclusive (i.e 144 months) were obtained for twelve spatial state capital markets across the six geo-political zones of Nigeria at the rate of two markets per zone. The two states chosen per geo-political zone were selected purposively on the basis of economic and infrastructural development. Thus, while one state is economically and infrastructural advanced, the other state is less economically and infrastructural advanced. Thus, one of the markets from each geo-political zone was designated "rural" market while the other was considered "urban" market. Lagos (Lag) and Ondo (Aku) states represented the Southwest geo-political zone. Others were Benue (Mak) and Niger (Min) states (North central), Borno (Mad) and Bauchi (Bau) states (North east), Sokoto (Sok) and Kano (Kan) states (North west), Imo (Owe) and Enugu (Enu) states (South east) and River (Por) and Akwa-Ibom (Uyo) states (South-south). The prices quoted for each state market correspond to the average prices for the three biggest fish markets in the state capital. Imported frozen fish and non-conventional fish products such as crayfish, prawns, shrimps, lobsters and crabs were excluded in computing the monthly series used in the study.
3.2. Analytical procedure
Both descriptive and econometric analyses were adopted in analyzing the data collected. Mean, coefficient of variation, percentages and tables were descriptive tools used. Also, inferential statistics and special regression models were utilized in achieving some of the specific objectives of the study.
3.2.1. Mean variability index of spatial prices
Average monthly retail prices for the whole period covered by the study were computed. Coefficients of variations were also computed for the averages obtained.
3.2.2. Test for order of econometric integration
A series is described as non-stationary if its mean values changes
over time and variance increases with sample size. In this circumstance, the series is described as possessing a unit root. Such a series is said to be integrated of order "d" and shocks have permanent effects on it (Gujarati, 1995). Non-stationary, which leads to estimates that are statistically inefficient as spurious regression, and suggests the presence of causal relations actually inexistent (Dickey & Fuller, 1979; Adams, 1992; Baulch, 1997; Franco, 1999; Nielson, 2006; Juselius, 2006) is common with macro-economic series. Despite this, a traditional methodology for assessing spatial pricing efficiency is to ascertain the order of econometric integration (or stationarity) of the price series. Among the techniques used in investigating the time series properties of macro-economic series are Philip-Perron, Dickey Fuller (DF) and Augumented Dickey Fuller (ADF), Co-integration Regression Durbin Waston (CRDW) and the Sargan-Bhargava Durbin Waston (SBDW) tests. The DF/ADF test was preferred to others in this study for its ease of application and interpretation of the results.
The DF/ADF test was used to ascertain the non-stationary condition revealed by the presence of unit root; P = 1 and the results were interpreted by comparison with a distribution tabulated by Dickey using the Monte Carlo method. The values tabulated in this distribution differ as a constant or a constant and time trend variables are included in the model in which case the test is formulated in the augumented version. For non-stationary series, a frequent procedure is to differentiate the original series "d" times, I(d) to arrive at a random "white noise" distribution of residuals.
The equation 3 below, adopted from Franco (1999), was used to test the hypothesis that P = 1 with DF; which, according to Franco is the first order integration model I(1) defined random walk.

assuming that Pt = ρ*Pt-1, this can be substituted into equation (3) to get:

From equation (4), the following hypothesis test was formulated
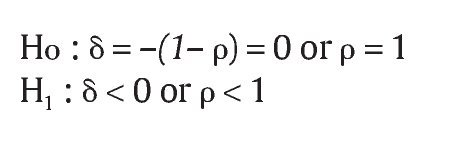
According to the null hypothesis, H0 connotes acceptance of the existence of a unit root for the series in question PttI(≥1), in which case, the test has to be re-executed with higher order differential. The second order differentiation, ddPt is represented in equation 5.
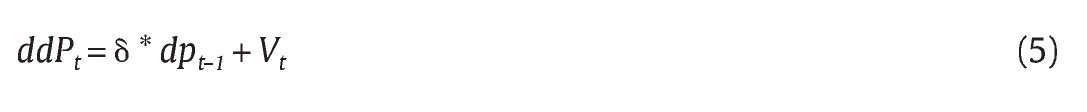
The null hypothesis is now Ho: δ = 0 for dPt = I (>1) and it was tested against H1 = δ<0 for dPt = I(0) and Pt = I(1). This equation is used in testing auto-regressive (AR) processes of higher orders to solve the problems of autocorrelation in the error process causing inefficient estimation of the parameters. Franco proposed the following AR (p) model including lagged dependent variables as additional explanatory variables to approximate the autocorrelation, constant and trend components to be reformulated.

c is the drift , t is the trend, δ =¿δk - 1 for k = 1, p;
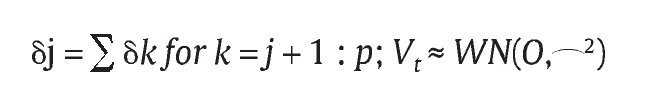
Equation (6) is a formal representation of the ADF test in the general form. A unit root implies a value of zero for the coefficient Pt-1. The presence of the unit root causes the model to reduce to (ρ - 1), the autoregressive order in dPt. This situation permits the application of the ADF test. The critical t values used to test H0; δ = 0 are the same as that used for the DF. To determine the signifi cant auto regressive lag order of the regression, the two conditions stated hereunder must be satisfied;
1. the white noise process must be tested using an appropriate test like the Langrange multiplier and ACR and PACR functions as visual evidence of the autocorrelation structure of the series with skewness and kurtosis values indicating the deviation of the actual from the theoretical error distribution.
2. the significant lag coefficient will be tested with t and F tests.
3.2.3. Long-run equilibrium and Granger-causality
Two or more variables are said to be co-integrated if each is individually, non-stationary (i.e. has one or more unit roots), but there exists a linear combination of the variables that is stationary. This implies the existence of long-run equilibrium between the two variables. In any two variables exhibiting co-integration, derivations from the short-run equilibrium may occur in the short-term, but their linear combination will return eventually to a constant mean. According to Silvapulle and Jayasuriya (1994, 370) "the concept of co-integration is in many ways a statistical definition of equilibrium". After testing for the order of econometric integration, the author proceeded to test for co-integration and causality between market price series that exhibited same order of econometric integration. In the Engle and Granger procedure, co-integration and causality are tested using bivariate autoregressive vector to describe the adjustment process induced by the price shock in one spatial market and transmitted to other market. The equation for the coupled series is shown below:
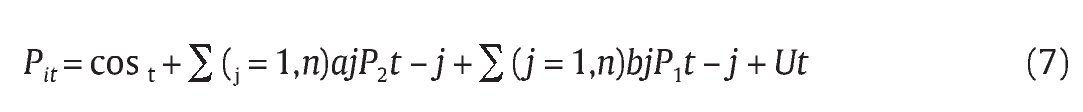
Where
P1t and P2t are price series being investigated for co-integration and causality.
n = number of lags
a and b are parameter estimates.
On the assumption that both markets are allowed to be dependent variable at one time and independent variable at another time because of the possibility of trade reversals between them, equation (7) can be re-written to reveal co-integration between paired price series where none is assumed to play a central role as follows:
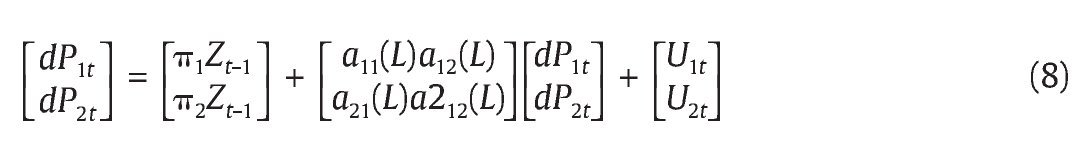
Where aij (L) is the appropriate polynomial operator.
L = Lag length which should be large enough to capture the short-run dynamics of the underlying VAR and produce normally distributed while noise residuals.
U1t and U2t are errors assumed to be "white noise".
π and Z are matrices of parameters.
Equation 8 was estimated using maximum likelihood estimates (MLE) procedure for co-integration propounded by Johansen and Juselius (1990, 1992) and Juselius (2006). This is because the two-step Engle and Granger procedure suffers from the simultaneity problem and the results are sensitive to the choice of dependent variable (Baulch, 1995). Adopting a single-step vector auto-regression method circumvents the simultaneity problem and permits hypothesis testing on the co-integration vector, r. The MLE procedure relies on the relationship between the rank of a matrix and its characteristic roots. The Johansen maximal eigenvalue and trace tests reveal the number of co-integrating vectors that exists between one or more series that show econometric integration.
The Johansen methodology involves testing whether the p matrix in equation 8 has less than full rank using the maximal eigenvalue test or trace test. The rank of π denoted by r, determines the number of linear combinations of Xt that are stationary. If r = n, the variables are stationary and if r = 0, then none of the linear combinations are stationary, where 0
When two series have the same order of econometric integration and are co-integrated, test for causality can be carried out owing to the fact at least that one Granger-casual relationship exists in a group of co-integrated series (Granger, 1988; Alexander & Wyeth, 1994; Franco, 1999; Chirwa, 2001; Nielsen, 2006). In equation (8) above, P2t will cause P1t if one or the other of the following two conditions actually comes true.

The interpretation of this is that the evidence of co-integration is also an evidence of causality. Ignoring the co-integration residuals will lead to incorrect model specification. Taking due cognizance of the sensitivity of the causality test to the polynomial formulation, the error correction mechanism (ECM) below developed by Alexander and Wyeth (1994) was used in this study.
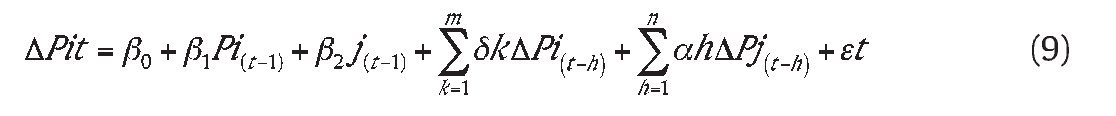
where
m and n are number of lags determined by Akaike information Criterion (AIC).
Rejection of the null hypothesis by a suitable F-test that αh = 0 for h = 1,2 ... n and β = 0 indicates that prices in market j Granger-cause prices in market i. If prices in i also Granger-cause prices in j, then, prices are said to be determined by a simultaneous feed back mechanism (SFM). This is the phenomenon of bi-directional causality. If the Granger-causality runs one way, it is called unidirectional Granger-causality and the market which Granger-causes the other is tagged the exogenous market.
Exogeneity can be weak or strong. Weak exogeneity occurs when the marginal distribution of Pi(t-1) is independent of the joint distribution of both Pi(t-1) and Pj(t-1). Strong exogeneity occurs when there is no significant Granger-causality from the other variable (Hendry, 1986; Juselius, 2006). In this study, there was a test of the evidence of Granger-causality between pairs of dry fish markets that exhibited same order of econometric integration and thus co-integrated.
4. Results and discussion
4.1. Descriptive analysis
4.1.1. Average retail prices
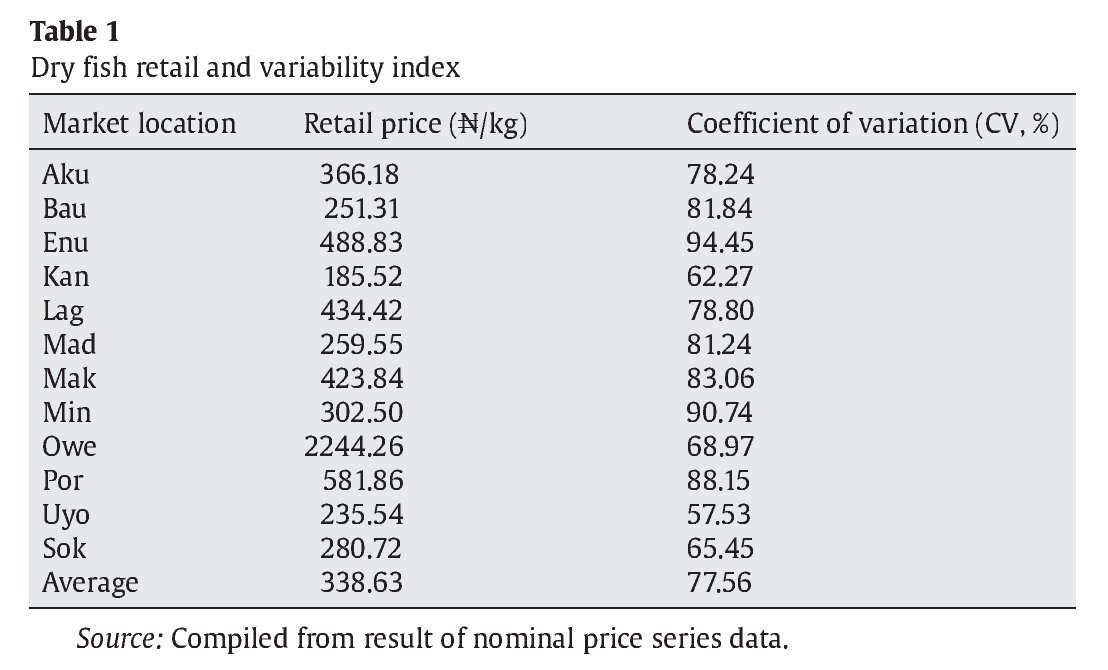
Five market locations, Por, Enu, Lag, Mak and Aku, witnessed the
highest average retail prices in the period analyzed. Most of these markets, except Mak, are situated in states which are high fish-consuming centres. Three of these markets, Por, Enu and Lag, are in highly urbanized and industrialized locations where a pool of the local elites and foreign residents, who are high-income earners, live and work. The findings that Aku and Mak are among the market locations recording price far higher than the average retail price is intriguing as they are neither highly urbanized nor industrialized. It is also interesting that Kan, second only to Lagos in terms of urbanization and industralization, did not belong in the five group of markets recording prices far higher than average. Despite the fact that Lagos and Port-Harcourt are very important seaports in Nigeria where there is generous availability of the affordable imported frozen fish of all types, they recorded prices above the average probably because they are thickly-populated and demand forces preponderate over supply forces.
The market locations with prices far below the average were Kan, Uyo, Owe and Bau. In terms of the level of industrialization and urbanization, Kan market was expected to belong to the markets recording prices higher than the mean. Availability of affordable beef and local chickens as substitutes to fish may cause a depression in the price of dry fish in the market. Mad is a market location very close to the Lake Chad and is located in a state which records an annual production figure higher than the sum for ten (10) other Northern states excluding Sokoto (FOS, 1999), yet it did not fall in the group of market with lowest retail prices. The fact that Por market in Delta State (a state producing the highest quantity of fish in Southern Nigeria) recorded the highest mean price is an indication that quantity supplied alone plays little or no role in fish price setting. It seems that there are other factors that are more important than the volume of production in price determination.
Whenever high production quantity does not exert a depressing effect on price of a given product, as established in traditional economic theory then, one can suspect that arbitrage in that commodity between product-surplus and product-deficient areas of the country continuously take place. This is the situation in Nigeria where fish distributors from Southern Nigeria go to the high production centres in the North to purchase and assemble dry fish for onward transportation to and sale in the Southern markets. Such continuous arbitraging will even-out supplies between high-production and low-production areas of the country thereby preventing glut which could occasion a price fall.
4.1.2. Variability in average retail price
Variability in retail prices was quite high for the period covered by the study. It fluctuated between 57.5% for Uyo to 94.5% for Enu. The average variability was 77.8% (Table 1). The implication of the high variability index is that the price of dry fish fluctuates widely in the period and market analyzed. High price variability translates into unstable producer incomes which is capable of exerting a deleterious effect on production and production planning (Olayemi, 1973; Mafimisebi, 2001). The impact of poor production planning is expected to be harmful on consumers' welfare especially in a country like Nigeria where poverty is very pervasive (FOS,1999) and food expenditures takes a lion share (more than 80%) of household's disposable income.
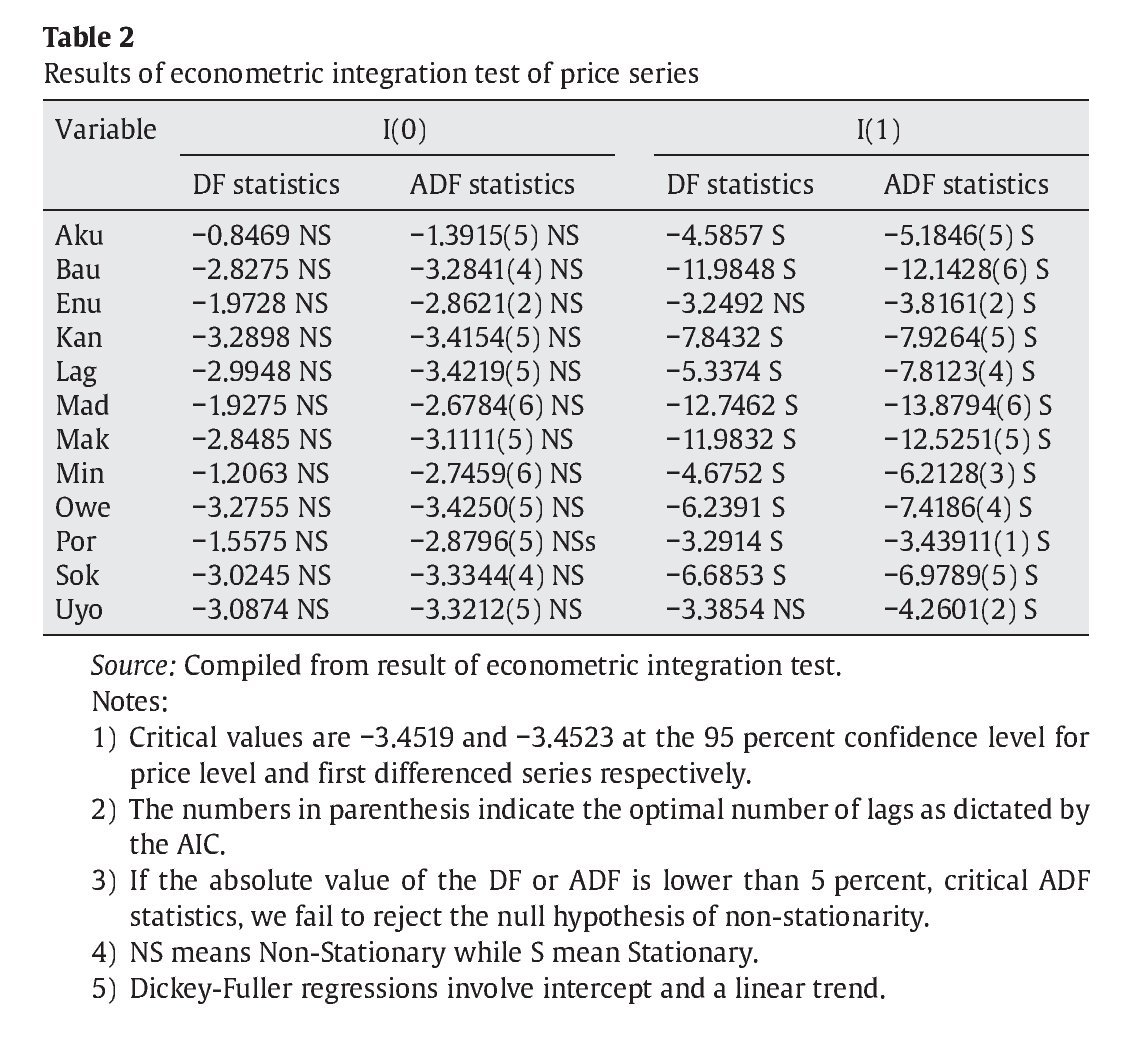
4.2.1. Order of econometric integration of dry fish price series
The result of test of the order of econometric integration of the spatial price series by the DF and ADF methods are shown in Table 2. All the prices series accepted the null hypothesis of non-stationarity at their levels at the 5% level of significance. The series were first-differenced since further tests showed that mean non-stationarity was the case and the test was re-executed. After first-differencing, the null hypothesis was rejected in favour of the alternative by all the prices series. The implication of this finding is that all the price series were generated by similar stochastic processes and can exhibit the tendency to long-run equilibrium (Baff les, 1991; Palaskas & Harris-White, 1993; Baulch, 1997; Franco, 1999; Chirwa, 2001; Mafimisebi, 2007; Nielsen, 2006). This result is well supported by earlier findings that food commodity price series are mostly stationary after first-differencing in Nigeria and elsewhere (Alenxander & Wyeth, 1994; Ogundare, 1999; Franco, 1999; Okoh & Egbon, 2003; Chirwa, 2001; Mafimisebi, 2001; Oladapo, 2004) probably owing to the possession by such series of trends arising from price inflation and cyclical variations from season leading to mean non-stationarity.

4.2.2. Analysis of spatial equilibrium by vector auto-regression (VAR) model
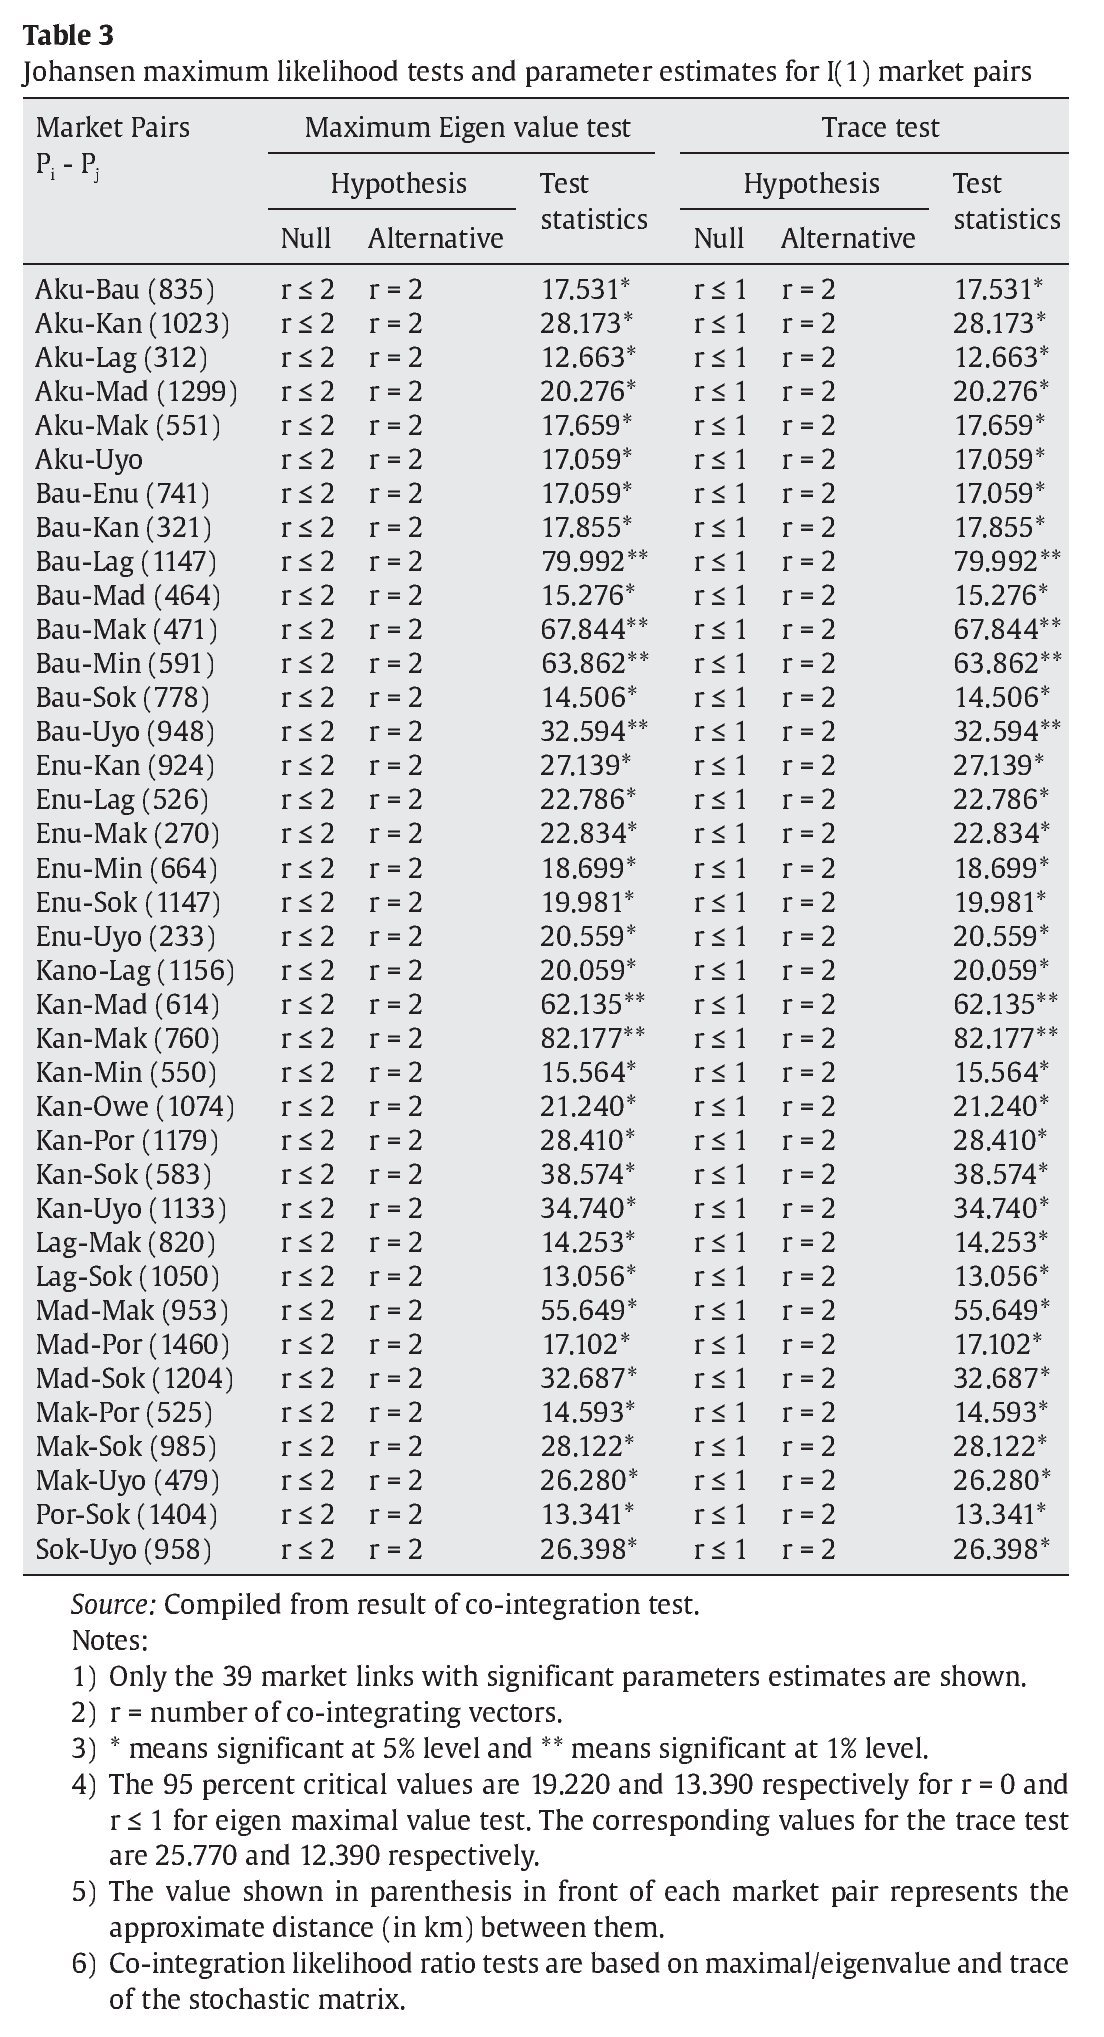
Shown on Table 3, are the results of the spatial equilibrium tests using Johansen's maximal eigenvalue and trace tests.

Sixty-six 66 (12C2) spatial market pairs were subjected to test and 39 rejected the null hypothesis of co-integration at less than full rank at the 1% or 5% levels. The alternative hypothesis that there was full rank in the co-integrating vectors was accepted by these 39 markets pairs. Despite differences in the value of the test statistics, the results of the maximal eigenvalue and trace as to the number of co-integrating vectors that attained full rank were the same.
The results of the long-run equilibrium model showed that 59.1% of dry fish market pairs were co-integrated of the order I(1). This shows the proportion of dry fish market pairs that have prices which are tied together in the long-run despites short-run divergence between them.
The long run notion of equilibrium of market price series has recently taken the front seat in terms of development economists' analysis of market performance. This is owing to the fact that markets with price series stationary at same order and co-integrated are spatially economically integrated. Modern developments in econometrics have shown that such series cannot drift far apart without bounds and, hence, the existence of long-run equilibrium between them (Adams, 1992; Silvapulle & Jayasuriya, 1994; Franco, 1999; Chirwa, 2001; Mafimisebi, 2001; Nielsen, 2006).
4.3. Exogeneity in dry fish market price series
Having identified markets that are linked within a network of markets, it is also useful for policy purposes to isolate the market(s) that play(s) leadership position(s) in formation and transmission of prices. It has been established in the literature that such leader market(s) exist(s) in any network of market for a homogeneous commodity integrated of the same order and having no tendency to diverge in the long-run. In this study, 78 markets pairs were investigated for evidence of price causation and exogeneity, and the results of the test is shown in Table 4.
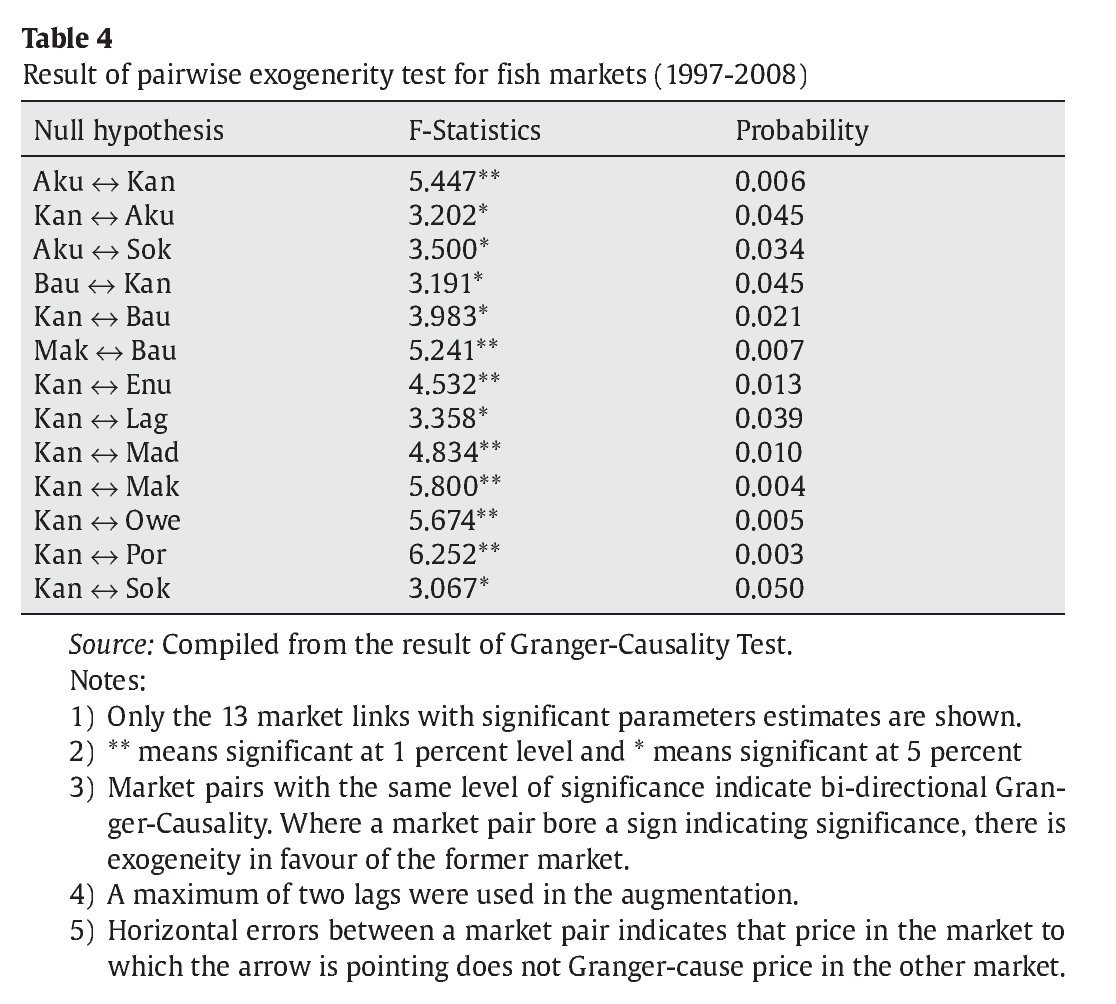
As shown in Table 4, four markets links, Aku-Kan, Kan-Aku, Bau-Kan, Kan-Bau, exhibited bi-directional (two-way) causality. While Aku Granger-caused Kan at 1% in the first market link, Kan Granger-caused Aku at 5% in the second market link. Thus, Aku proved stronger than Kan in the first two market links. In the third and fourth market links, Bau and Kan matched strength for strength as they exhibited exogeneity at same level of significance (5%).
The remaining nine (9) market links showed uni-directional (one way) Granger-causality in which there is no significant causality from the other market (Hendry, 1986). Thus, the markets occupying leadership positions in dry fish pricing were Aku, Bau, Mak and Kan. Kan showed very strong exogeneity, Mak exhibited strong exogeneity, while Aku and Bau were only weakly exogenous in price formation and transmission.
The implication of exogeneity from these markets is that the lagged or historical prices in these leader markets yield a better prediction of changes in contemporaneous prices in the others, provided the lagged prices in the follower markets have been accounted for. In other words, it means that the error variance of forecasting prices in the follower markets will reduce by using past values of prices in the leader markets. The fact that Kan, Bau and Mak markets in the northern part of Nigeria are strong to very strong sources of stochastic trends influencing the market for dry fish in Nigeria indicates that these markets play dominant roles in marketing of dry fish and this is probably in consonance with the high fish production capacities of these states. The southern states are mainly fish consuming areas and are sources of causation in regional prices. This is an indication that demand forces pre ponderate over supply in driving the market (Mafimisebi, 2007). The dry fish market in Nigeria thus has an oligopolistic structure with the tendency of exhibiting characteristics of an imperfect market where the cross-sectional aggregation of demand and supply loses its foundation.
5. Summary, recommendations and conclusions
5.1. Summary and recommendations
The fact that an understanding of agricultural price behaviour is fundamental to the evolvement of workable agricultural development plan and sustainable food secuirity is incontrovertible. Contrary to this, however, agricultural development policies in Nigeria have concentrated much attention on increasing agricultural productivity while research on market price analysis has been relegated to the background. This study evaluated long-run spatial equilibrium and market integration in dry fish distribution in Nigeria. In achieving this, the study investigated market integration and exogeneity between market price series. In analyzing long-run dynamics in price relationships, the study first established the order of econometric integration of the time series data to be able to circumvent the problem of spurious regression estimates.
The markets with the highest five average values for monthly retail prices were Por, Enu, Lag, Mak and Aku, while the four with lowest values were Kan, Uyo, Owe and Bau. There were high fluctuations in mean retail prices which indicates that dry fish prices were unstable. This is an evidence of low competitiveness in the Nigerian dr y f ish market. All the price series showed econometric integration of the order I (1) meaning that similar stochastic processes generated these series. About 59.1% of the market pairs examined showed that their prices series do not diverge at equilibrium thus exhibiting spatial price linkage. This proportion of the markets examined showed competitiveness and efficiency in price formation and transmission in relation to supply-demand situation. Evidence of price leadership exists in the Nigerian dry fish market in favour of Kan, Bau, Mak, and Aku. These markets are the ones to be targeted for experimental pricing policy directed at reducing dr y f ish price and boosting its consumption. By exercising exogeneity over other markets, prices formed in them will be efficiently transmitted to the follower markets with little or no distortions. If a follower market acts as the point of first implementation of such pricing policy, in spite of a good performance in the short-run, the effects will be aborted in the long-run and the benefits will fail to reach the targeted beneficiaries such as the fisher-folks, fish processors, fishing gears makers, market intermediaries, transporters, agents and end-users.
The high variability in prices demands an improvement in basic marketing information especially in relation to prices. Collection, collation and dissemination of fish price information needs to be provided. There is a need for re-organization and re-equipping of the Federal Fisheries Department and the Federal Office of Statistics in terms of finance, facilities and personnel to be able to effectively perform the function. A regular and wide dissemination of price and market supply information will lead to effectiveness of arbitrage among markets, it will reduce uncertainties in market supplies in different locations and lead to a reduction in the risks associated with inter-market trade. Doing this will lead to an efficiently functioning market network where very few markets are segmented and where fish is delivered to end-users at an affordable cost. Also, such a market network with very high proportion of the markets linked in the long-run disallows exploitative tendencies by market agents and actors.
6. Conclusion
The level of long-run spatial equilibrium and integration is just fair in the Nigerian dry fish markets with the implication that many markets act alone and do not synchronize with others in terms of prices. This indicates that the tendency exists that end-users are paying more for dry fish than the actual demand-supply and other conditions should allow. The low level of long-run spatial linkage is most likely a ref lection of the low level of economic development in Nigeria. Only 59.1% of dry fish markets showed prices which are connected in the long-run and which prices differ only by an amount exactly equal to the transfer cost of one unit of fish between spatially separated markets. Speaking in terms of synchronous price movement, this is the proportion of Nigeria dry fish markets that are competitive and efficient. This justifies institutionalizing a nation-wide policy which will enhance dr y f ish marketing efficiency, increased affordabilit y and consumption in Nigeria.
Article history:
Received August 8, 2011 Accepted June 25, 2012
E-mail address:
temafis@yahoo.com (T.E. Mafimisebi).
References
Abbot, J.C., 1967. Agricultural marketing boards in developing countries. Journal of Farm Economics 49 (3), 721-732.
Adams, C.S., 1992. Recent developments in econometric methods: An application to the demand for money in Kenya. AERC special paper 15, September.
Adewale, A.B., 1985. Production, marketing and consumption of fish. Unpublished project, department of Agricultural Economics, University of Ibadan, p. 56.
Alexander, C., Wyeth, J., 1994. Co-integration and market integration: An application to the Indonesian rice market. Journal of Development Studies 30 (4), 303-328.
Baffles, J., 1991. Some further evidence on the law of one price. American Journal of Agricultural Economics 73 (4), 1264-1273.
Baulch, B., 1997. Testing food market integration revisited. Journal of Development Studies 33 (4), 512-534.
Baulch, R.J., 1995. Spatial price equilibrium and food market integration. A Ph.D thesis of the Stanford University.
Chirwa, E.W., 2001. Liberation of food marketing and market integration in Malawi. Report of AERC Sponsored Research.
Dickey, D.A., Fuller, W.A., 1979. Distribution of estimators for auto-regressive time series with a unit root. Journal of American Statistical Association 74 (366), 427-431.
Dittoh, J.S., 1994. Market integration: The case of dry season vegetables in Nigeria. Issues in African Rural Development 2, 89-101.
Engel, R.F., Yoo, B., 1987. Forecasting and testing in co-integrated systems. Journal of Econometrics 35 (2), 143-159.
Federal Office of Statistics (1999). Poverty and agricultural sector in Nigeria. A publication of the Federal office of Statistics (FOS), Abuja, Nigeria, p. 33.
Franco, R., 1999. Testing the quality-price relations in parmigiano and padano cheese markets. Journal of International Food and Agribusiness Marketing 10 (30), 19-43.
Goeff, A., Bennet, C.J., 1995. Fish mammies and tuna conglomerates: Private sector fish processing and marketing in Ghana. In: Steven, J., Jonh, M. (Eds.), Marketing Africa's high-value foods. pp. 375-416.
Granger, C.W.J., 1988. Some Recent developments in the concept of causality. Journal of Econometrics 39, 199-211.
Gujarati, D.N., 1995. Basic econometrics. 3 ed. McGraw-Hill, New York.
Hendry, D., 1986. Econometric modelling with co-integrated variables: An overview. Oxford Bulletin of Economics and Statistics 25 (2), 15-35.
Johansen, S., 1988. A statistical analysis of co integration vectors. Journal of Economics Dynamics and Control 12 (2/3): 231-254.
Johansen, S, Juselius, K., 1990. Maximum likelihood and inference on co- integration with applications to the demand for money. Oxford Bulletin of Economics and Statistics 52, 169-210.
Johansen, S., Juselius, K., 1992. Testing structural hypothesis in a multivanate co-integration analysis of the PPP and UIP for the UK. Journal of Econometrics 53, 211-244.
Juselius, K., 2006. The co-integration VAR model: Methodology and applications. Oxford University Press (manuscript), Oxford.
Ladipo, O.O., Fabiyi, Y.L., 1982. An analysis of the structure of fish marketing and distribution in Kwara State of Nigeria. Paper presented at the 3 Annual Conference of Fisheries Society of Nigeria (FISON). pp. 40-46.
Mackinnon, J., 1990. Critical values for co-integration tests. San Diego University of Califonia (San Diego). Department of Economics Discussion paper 90-4.
Mafimisebi, T.E., 2001. Spatial price equilibrium and fish market integration in Nigeria. Unpublished PhD thesis. University of Ibadan, Nigeria, p. 201.
Mafimisebi, T.E., 2003. Yield performance of commercial upland fish farms in Ondo State of Nigeria. Nigerian Journal of Animal Production 30 (2), 217-220. Mafimisebi, T.E., 2007. Long-run price integration in the Nigerian fresh fish market: Implications for marketing and development. In: Macro-marketing and development: Building bridges and forging alliances, proceedings of the joint Conference of the Macro-marketing Society and International Society of Marketing and Development, held in Washington D. C., USA. pp. 314-330.
Nielsen, M., 2006. Market integration and causality in demand: the case study of farmed rout in Germany. Paper delivered at the 13 Biennial Conference of International Institute of Fisheries Economics and Trade, Portsmouth, UK, July 11-14.
Ogundare, G.O., 1999. The determinants of the traditional export crops in Nigeria using co-integration approach. Unpublished M.Sc. thesis. University of Ibadan. p. 65.
Okoh, R.N., Egbon P.C., 2003. Market integration of cassava products in Nigeria. A report of AERC Sponsored Research.
Okore, A.O., 2002. Towards human-centred development focus on Nigeria. Journal of Liberal Studies 10 (1), 11-51.
Oladapo, O.O., 2004. Market integration for pineapples in Nigeria. An unpublished Ph.D thesis. University of Agriculture, Abeokuta, Nigeria.
Olayemi, J.K., 1973. Rice marketing and prices: A case study of Kwara State, Nigeria. Bulletin of Rural Economics and Sociology 8 (2), 211-242.
Palaskas, T., Harris-White, B., 1993. Testing market integration: New approaches with case materials from the West Bengal economy. Journal of Development Studies 30 (1), 1-57.
Ravallion, M., 1986. Testing market integration. American Journal of Agricultural Economics 68 (1), 102-109.
Shaib, B., Aliyu, A., Bakshi, J.S., 1997. "Agricultural Zones. In: National Agricultural Research Strategy Plan. 1996-2010". Inter printers limited, Ibadan.
Silvapulle, P., Jayasuriya, S., 1994. Testing for Philippines rice market integration: A multiple co integration approach. Journal of Agricultural Economics 45 (3), 369-380.
