


To understand disruptions and their propagation along the supply chains is becoming critical for designing competitive global supply chains operating in emerging economies. It leads to economic damages to every organization involved in a supply chain, but it also decreases national logistics competitiveness. This research provides numerical elements in terms of significance of the security issue in Latin America, and at the same time, proposes a system dynamics assessment model based on real-life information, able to establish analysis scenarios in order to measure the impacts derived of supply chain disruptions propagation caused by criminal acts. Finally, useful conclusions for designing more resilient supply chains and future research are exposed.
Entender las disrupciones y su propagación a lo largo de las cadenas de suministro se ha vuelto crítico para el diseño de cadenas de suministro globales operando en economías emergentes. Esto no solo implican pérdidas económicas a cualquier organización involucrada en una cadena de suministro, sino que además disminuye la competitividad logística nacional. Este trabajo provee elementos numéricos de la importancia de la seguridad en América Latina y al mismo tiempo, propone un modelo de evaluación desde la metodología de dinámica de sistemas con base en información real, capaz de establecer escenarios para medir los impactos relacionados de la propagación de interrupciones en la cadena de suministro causados por actos criminales. Finalmente, se presentan conclusiones para el diseño de cadenas de suministro más resilientes, así como propuestas de investigación futura.
To develop timely efficient flow of legitimate goods while reducing its vulnerability to disruptions is one of the main goals of the most important export-oriented economies. However, security is a critical issue for designing supply chains process. Particularly in emerging countries, supply chain performance has become a significant issue, which has been analyzed by several authors [1, 2]. In fact, due to the potentially damaging social and economic effects of supply chain disruptions caused by criminal acts, security is compromising the competitiveness of certain nations in Latin America (LatAm) [3]. Hence, the security risk has pernicious effects on the economy, decreasing competitiveness, national and foreign investment, as well as employment and productivity by making consumer products more expensive due to the extra costs involved.
According to Perez-Salas [3] as well as Bueno-Solano and Cedillo-Campos [4], disruptions in supply chains have enormous economic consequences not only by its direct damages, but also by the propagation effect to the rest of the supply chain. In fact, it reduces logistics reliability, which, results in long lead times and stimulates larger safety stocks, among other factors decreasing national logistics competitiveness [5].
Although thefts have always been a risk in the transportation sector, globalization and the prevalent paradigm looking for designing integrated, faster and cost-efficient supply chains, have provided an operational environment susceptible to disturbances that can rapidly escalade from localized events to major disruptions [6].
Several authors [4, 7, 8, 9, 10, 11, 12] agree that there is no evidence in the literature of quantitative models to dynamically compute the propagation effect of disruptive phenomena at multiple stages of the supply chain. The aim of this article is to propose a system dynamics model based on reallife information, able to establish analysis scenarios in order to measure the impact regarding cost and service level in global supply chains, as a result of the disruptive propagation effect caused by criminal acts. Thus, from a global perspective of risk, our results provide information about the propagation of risks and costs, which can be used by decision makers during the proactive planning process.
The rest of the document is organized as follows. Section 2 presents a general background of risk factors that currently threaten global supply chains as well as an analysis of LatAm current status in terms of security. Section 3 describes the model developed, based on real-life information. In Section 4, the results obtained through the simulation of different policies and decision scenarios will be discussed. Finally, Section 5 presents conclusions and future research.
2BackgroundIn addition to direct losses from crimes, costs related to the incidents (attorney fees, delays in collecting insurance, etc.), as well as significant national productivity losses end up making exports and imports more expensive. Simultaneously, the image of the country is also seriously damaged by crime, which discourages new domestic investment and makes the country less attractive to foreign investors.
Thus, mitigation of supply chain disruptions caused by criminal acts requires a coordinated approach between the public and the private sector. Since supply chain disruptions directly impact the competitiveness of an economy, governments are responsible for providing the infrastructure and services needed to ensure an acceptable level of security as well as guaranteeing the proper functioning of transport infrastructure services (safety) under normal conditions as well as during disruptive events. On the other hand, companies are responsible for implementing internal security procedures to mitigate risk [3].
As several authors argue [3, 6, 13, 14,], LatAm countries with better security performance are also more competitive. In this sense, inside the upper left of figure 1, are located seven of the ten most competitive countries in the region where the frequency of crime and violence against firms is low (Barbados, Brazil, Chile, Costa Rica, Peru, Panama, Uruguay). Inside the upper right quadrant, there is a group of countries within good level of competitiveness at a regional level, but their low performance in terms of security reduce their potential competitiveness (Colombia, Guatemala, Mexico, Trinidad and Tobago). The lower left quadrant show countries with relative good competitiveness and satisfactory level of security (Argentina, Bolivia, Guyana, Nicaragua, Paraguay, Surinam). However in this group are located some countries where there is no reliable statistical data of cargo theft. Finally, inside the lower right quadrant are the nations with a competitive performance below the regional average and where the cost of crime and violence is lower than the regional average (Ecuador, Haiti Honduras, Jamaica, El Salvador, Venezuela).
![Relationship between Global Competitiveness Index and the cost of crime and violence for the companies (2012–2013) [2].](https://static.elsevier.es/multimedia/16656423/0000001200000004/v2_201501220327/S1665642314700859/v2_201501220327/en/main.assets/gr1.jpeg?xkr=ue/ImdikoIMrsJoerZ+w997EogCnBdOOD93cPFbanNcX6PcOHo8VDqRKrp6xHZ/NlPxKUvo805ICrHlplwxcm7hYIESfjCCTNDlVokL+8rN0fhZdY3aRcVfAez1kPs8wmJ6NGAMQRUE2RRpVuvLnOpOP7SnSa3UgX1VUqSV+E/g/PCg06KbBrfmM7HqpAu5ZJuchfQSEKmvuO0UNh7p7jNgI+qyrtPjuFAvZ2za//TxXett5yXsSXguFUTURuqCX8ouzXQeyAKnrNUinwTHDqYU0LpMLJ5h/MbzgtnkMEvTmNahtpVVIbpbfLfZ6Xbpv6POuMlyvujum24mY9nA09w== "Relationship between Global Competitiveness Index and the cost of crime and violence for the companies (2012–2013) [2].")
Relationship between Global Competitiveness Index and the cost of crime and violence for the companies (2012–2013) [2].
Since supply chain disruption propagation is multidimensional, decision-makers do not count with a clear view on how to face and deal with disruptions [4, 15]. According to Sodhi et al. and Waters [11, 12], the fundamental basis of complexity when analyzing risk propagation is due to the fact that it can manifest itself in many different ways, virtually affecting any link along the supply chain. This is also identified by Wu et al. [7], who highlight the understanding of risk propagation in the supply chain as prerequisite for an effective integration of supply chains.
Several authors [16, 17, 18, 19] argue that supply chain disruption analysis should not focus on the specific nature of the disruption because decision makers cannot foresee every potential threat neither determine how likely that threat could materialize. Other authors [4, 8, 20] suggest to dynamically analyze if the effects of disruptions have local influence or if they may propagate to other members of the supply chain.
Thus, due to many interrelated variables involved in the analysis of disruptions in global supply chains, the systemic perspective provided by system dynamics methodology becomes critical.
3System Dynamics ModelAfter a detailed analysis, the multiple relationships between the different supply chain echelons allowed us to identify a refined basic logistics structure. Then, a supply chain model was built based on real-life information obtained from the case study presented and analyzed by Cedillo-Campos et al. [21]. This case analyzed a supply chain organized around the following basic components: (a) A raw materials supplier; (b) A Tier 1 supplier; (c) An international border; (d) A buffer inventory managed by the Tier 1 supplier; and (e) A manufacturing facility.
At that research step, other significant real-life variables were identified, and as result, two basic subsystems were recognized. The first one, a reinforcing loop, which was related to the demand process, and the second one, a balancing loop, which was related to the supply process as described as follows:
- •
Customer Demand (Ds): It is the customer demand for each corresponding period (s), where s=1…180 periods and si-1 represent the demand of the previous period.
- •
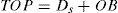
Total Orders Placed (TOP): It is the total demand to be sorted by the inventory level and is calculated as:
- •
Order Backlog (OB): It is the amount of orders that are still outstanding to be delivered to the client and is computed as:
- •
Goods Shipped to Customer (GSC): It is the amount of goods sent in each period to the instant client. GSC is computed as:


Where MGS is the maximum capacity of goods to move from one stage to another and is set in ±33% of Ds units.
- •
Inventory Level (IL): It is the behavior of the stock level for each stage of the supply chain. IL is calculated using:
- •
In Transit Inventory (ITI): It is the amount of inventory in transit. It represents GSC of the upper echelon. ITI is computed as:
- •
Total Buffer Demand (TBD): represents the total period demand. TBD is determined by the following equation adapted from Rong et al. [23]:


Where IP is the inventory position and is calculated as follows:

O^ represents a forecast of demand and is calculated:

- •
Safety Stock (SS): It is the desired IL. It helps you make the adjustments necessary to maintain the desired inventory level to avoid it growing or drop without control.
- •
Desired in Transit Inventory (DITI): It is the desired level of inventory in transit. It helps make the adjustments necessary to maintain the level of desired in ITI.
According to Rong [22], n is the demand smoothing factor 0<n<1. As in our model the demand distribution is known, it is not necessary to compute a forecast of n and then:

The constants ¿ and ¿ are parameters controlling the change in the TBD when the actual inventory level and the supply line, respectively deviate from their desired levels. For this research, ¿=0.1 and ¿=0.2
3.1Dynamic hypothesisIn the causal loop diagram (see figure 2), two processes that turn around IL are identified. There is the loop of demand, which has a positive polarity (+) and is identified in the causal loop diagram as R1, R2 and R3. We can also see a loop of supply process represented by B1 and B3 which also integrate respectively a sub process corresponding to the in transit inventory (ITI), represented by B2 and B4. These last four causal loops have a negative polarity (−) balancing the desired level of inventory. The first goal corresponding to B1 and B3 is to maintain the inventory level around SS, seeking to avoid breakdowns by shortage of inventory in the supply chain. Therefore, the goal of B2 and B4 helps to maintain the supplier line stable, preventing the shortages of goods. This is accomplished by comparing the DITI with the IL represented by the “buffer in transit inventory”.

In the reinforcing causal loops R1, R2 and R3, we can note that TOP is positively influenced by Ds, and the OB accumulated from previous periods. Likewise TOP has a negative relationship with the inventory level that is responsible for meeting the customer's demand. GSC represents the amount of goods delivered to the client and is equivalent to the minimum amount of goods between total demand and the level of available inventory. Thus, backorders accumulate in OB. Finally the accumulation of back orders increases the amount of orders for the next period of time. This contributes to a self-reinforcing loop involving the inventory level and at the same time, reducing the growth of TOP.
Equally, causal loops B1 and B3 influence the level of inventory. As described above, balancing feedback leads to goal-seeking behavior. This condition maintains the level of inventory around a desired inventory level, which allows to constantly balancing the subsystem. While in loops R1, R2 and R3, we note that IL decreases as goods are delivered to the client, we can now identify that IL increases as it receives ITI. This ITI actually represents the goods that were delivered by the immediate provider to the client. Thus, if the ITI is high, the difference with respect to the level of SS and IL will be less.
Likewise, causal loops B1 and B3 influence the level of inventory. This condition maintains the level of inventory around a desired inventory level, which allows it to constantly balance the subsystem. While in loops R1, R2 and R3, we note that IL decreases as goods are delivered to the client, we can now identify that IL increases as it receives ITI. This, in transit inventory, actually represents the goods that were delivered by the immediate supplier to the client. Thus, if the ITI is high, the difference with respect to the level of SS and IL will be smaller.
This condition suggests that when fewer orders are placed to the supplier, then, the system will have a smaller amount of in transit inventory in the following period of time. Accordingly, when the IL receives fewer ITI (compared with the IL and the SS levels), then, there will be a bigger difference with respect to the desired level.
Thus, the new condition generates a greater amount of orders being placed to the supplier, generating subsequently an increase of the IL. Consequently, the system is constantly balanced around the desired security level.
4Simulation FrameworkFrom a general point of view, it is important to hightlight that criminal gangs operating on the trucking sector do not recognize borders and are continually moving, looking for areas with lower security levels where their actions are facilitated.
In this research the impacts of supply chain disruption propagation of security risks were measured as a result of inventory performance, and total costs. Within the costs analysis, we considered the costs of inventory management and costs of low order fullfilment rate, as well as the ones generated by the theft of goods.
For the simulation process we evaluated performance of two different scenarios where the only variation was the lead time in order to quantitatively measure the effects of disruptions caused by criminal acts and their potential impact in the behavior of the inventory levels.
The simulation of the model was carried out under STELLA 9.1.3, on a 180-day period of time corresponding to a six-month planning horizon. According to Sheffi [23] less-than-a-year planning periods, allow managers to incorporate flexibility into supply chain, and optimize operations. It should be noted that since daily orders were received, the interval of time between calculations “STEPTIME” equals one.
To illustrate how uncertainty on crossing times affects the safety stock in a cross-border supply chain, we considered different scenarios.
The manufacturer daily demand of this product (¿) was considered as an input to the model. This demand is represented by 1,296 units per day and a standard deviation of 50units. In fact, the assembly plant requires to keep a 5-day safety stock in the ABC warehouse (buffer). At the same time, it was taken into account that the border crossing times vary from 1.77hrs (best case) to 16.77hrs (worst case) [15,16]. The initial values for the simulation of the proposed model are shown in table 1.
Supply chain values.
| Componen Supplier | International Border | Buffer (Warehouse) | ||||
|---|---|---|---|---|---|---|
| ITI | IL | Godos In Transit | Crossing Border Times | ITI | IL | |
| Initial Inventory (units)Scenario 1Scenario 2 | 13001300 | 14501450 | 13001300 | 1296 | 64809072 | |
| Target InventoryLevelScenario 1Scenario 2 | 13001300 | 13001450 | 13001300 | 64809072 | ||
| Transit Time (day)Scenario 1Scenario 2 | 14 | Min 1.77hrs.Max 16.77hrs. | 22 | |||
| Handle Cost (dlls) | 2.5 | 5 | ||||
| Cost of IL Lost (dlls) | 175 | 175 | ||||
| Cost of ITI Lost (dlls) | 125 | |||||
Our analysis considered simulating two different scenarios. In both cases it was necessary to keep a safety stock in the buffer on the US side. The first scenario, assumed that the MEX company is located in Mexico and four days are necessary to reach the inventory level, receiving components form the buffer located on the US side. Since the SS must cover at least five days of the customer demand, the average level of inventory must be of 6,474 pieces.
On the other hand, for the second scenario, the BRA Company is located in Brazil. It was estimated that seven days are necessary to reach the inventory level using the buffer to honor the assembly plant requirement of a 5 day safety stock. In that case, the level of average inventory in the buffer was set in 9,072 pieces.
In both scenarios, the average flow of goods from buffer to customer (GSC) was 1,296 pieces. Under these conditions the baseline behavior of both scenarios shows a similar performance (figures 3 and 4).


The main difference was the total cost of every supply chain. In the Scenario 1 the cost of the supply chain was $6,621,350 US dollars and on the other hand, in the Scenario 2 the cost of the supply chain was $8,941,190 US dollars. It means that if we only focus on the lead time and consider that all the other parameters are alike, the difference between the two suply chains in total cost is around 35%.
4.1Analysis under disruption scenariosIn LatAm the in-transit inventory is the most vulnerable element in the supply chain. However, the lack of information about the real dimension of the problem of security makes it a low priority on the political agenda and is often seen as an “usual” cost of logistics activity. The lack of updated and standardized information for decision-making hinders a proactive risk management of gobal supply chains [3].
In fact, it was proved that there was not enough information available to simulate an entire case with real-life information. Consequently, for the Mexican case, we based our research work on a reliable database that belongs to the Mexican Association of Insurance Institutions (MAII). On the other hand, for the Brazilian case, we based it on statistics provided by World Bank (WB) as well as logistics magazines.
Thus, we simulated three different situations for each of the two scenarios. Thus, in Scenario 1, a cargo robbery represented at least 6 days of disruption; this was because the baseline lead-time was of four days. If the criminal act occurred on the 3rd day, the supply chain would need at least other three days to recover a steady state. In Scenario 2, if a cargo robbery occurs on the 6th day, since the supply chain needs at least three days to recover a steady state, then the lead time changes from 7 to 9 days during a disruption. In both scenarios we considered that in a disruptive context the supplier used an air cargo shipment to fulfill the customer demand. As a result, we obtained two different impacts on the IL (see figure 5 and figure 6). Analyzing the inventory performance, our results quantitatively confirm the qualitative proposal by Sheffi [23].


For the Scenario 1 with a 6-day disruption, in the first phase, there is a period of “normal” operation before the impact. For this simulation the impact occurs in the 50th day, at an early stage. In a second phase, a delay effect affects the IL of the company. There is a gradual reduction of IL as a result of maintaining the flow of deliveries to the client, but without being restocked when the international border is closed. Finally, a third phase shows how the behavior of the IL regulates itself on day 110. In the case of the global manufacturer company in study, thanks to the coverage of 5 day inventory, the order backlog stayed in control and the customer demand could practically be fulfilled.
For Scenario 2 with 9 days of disruption, we could verify, during the second phase, a breakdown of SS. and contrary to what was observed in the Scenario 1, the delivery of goods to the client was compromised by a lapse of 10 periods. The supply chain required 100 periods to reach a steady state.
As a result of failing to fulfill the demand, an increase in IL of 125% versus the baseline scenario was observed. A large volume of OB was also created (see figure 7), which led the supply system to increase the IL in 530%. This behavior in the IL was identified and studied by Sterman [24], who also shows that managers tend to pay more attention to back orders than to the supply line, placing very large orders to the supplier.

The cost of the total supply chain in the Scenario 1 reaches $8,015,205 US dollars while in the Scenario 2; the total cost of the supply chain was increased to $19,780,320 US dollars. It means than the total cost rose to 21% and 121% in every case. This analysis helps us to understand why some companies prefer to operate in Mexico despite security risks.
5Conclusions and further researchSince there are different and interrelated impacts (social, political, and economic) related to supply chain disruptions caused by criminal acts, the topic is very complex. In order to provide useful insights, our research work was organized at two different levels: a) a global level looking for analyzing public policies; and b) a tactical level looking for designing a quantitative model to measure two real-life scenarios.
From a global perspective, this paper stated that citizen security is part of the current LatAm public policies which are oriented to stop crime and violence. However, until now, the initiatives are executed without integrated trade facilitation principles (harmonization, simplification, transparency and standardization), and an integral supply chain perspective, despite a significant relationship between supply chain security, total logistics costs and national competitiveness [3, 5]. Since security is a transnational issue, public coordination at a regional level as well as considering the supply chains as regional public goods is a fundamental approach in designing safer supply chains.
From a tactical perspective, this paper contributes to the research literature by measuring quantitatively what some authors proposed qualitatively [6, 18, 21]. As our research demonstrates, the lead-time can make the difference between an early recovery, and catastrophic and unrecoverable economic losses.
As future research, the model herein proposed should be proved under other high impact scenarios such as natural disasters, which tend to propagate their disruptive effects along the supply chains. At the same time, it is suggested to analyze the perspective here discussed from an event management approach [25].
The authors thank Flora Hammer for several useful comments that improved this paper as well as anonymous reviewers for their constructive comments and suggestions.