


We report undoped and Ni-doped TiO2 (xNi=0.00, 0.50, 1.00, 1.50, 2.00 and 2.50wt.%) thin films fabricated on glass substrates by using a combination of solid-state reaction and dip coating techniques. The structural properties are observed by X-ray diffraction (XRD), which have depicted that annealing at 650°C results in rutile Ni-doped TiO2 as a major phase along with a minor anatase phase. The surface morphology of the deposited thin films, as measured by scanning electron microscopy (SEM), indicates granular spherical shaped nanostructures. Room-temperature ferromagnetism (RTFM) has been illustrated by all the grown thin films, as elucidated by vibrating sample magnetometer (VSM). Although Ni content has no pronounced effect on the crystallinity that indicates a substitutional replacement of Ni in TiO2 lattice, however, Ni content is observed to influence the ferromagnetic behavior. Therefore, the present study signifies the potential spintronic applications of Ni-doped TiO2 diluted magnetic semiconductors, fabricated by a low-cost method, as it exhibits RTFM with nanograins at the surface.
In the last few years, thin film technology has been playing a vital role in the fabrication of solid-state magnetic storage devices to study and realize novel phenomena to meet the requirements of the integrated-circuit industry. The cost of fabrication of thin films is very low as compared to that of their bulk counterparts. Moreover, the charge transport and the information storage can effectively be realized in nanoscale devices by employing thin films. Diluted magnetic semiconductors have a prominent place in traditional semiconductor-based spintronic research. Traditional semiconductors, doped with a small concentration of magnetic ions to associate magnetic degree of freedom, have become suitable for both current controlling and magnetic storage device applications (Oganisian, Hreniak, Sikora, Gaworska-Koniarek, & Iwan, 2015; Paulauskas et al., 2013). TiO2 doped with various magnetic ions for achieving room-temperature ferromagnetism (RTFM) is one of the attractive aspects in spintronics research. Basically, TiO2 appears in three different crystallographic phases namely, anatase, rutile and brookite. Among which rutile phase is the preferred one. Rutile phase has been widely studied, as it is non toxic with high transparency in the visible region, it has high refractive index, high dielectric constant and good chemical stability (Oganisian et al., 2015; Paulauskas et al., 2013; Sahdan, Nayan, Dahlan, Mahmoud, & Hashim, 2012); therefore, it is considered as one of the suitable photocatalysts in heterojunctions. Also, it has potential applications including gas sensors, membranes, LEDs, fibers, light transparent electrodes, heat reflectors and optical gain media (Akpan & Hameed, 2010; Chen, Yang, Wang, & Jiang, 2006). There are many reports in the literature, which indicates that the band gap of TiO2 can be tapered by doping with transition metals (Fe, Cr, Mn, Ni), nonmetals (F, I, P, N, S), rare earth elements (La, Gd, Nd, Er, Pr) and alkaline earth metals (Be, Mg) etc., that enhance the photocatalytic activity in the visible light (Ahmad et al., 2010; Al-Jawad, 2014; Asahi, Morikawa, Irie, & Ohwaki, 2014; Ayieko, Musembi, Waita, Aduda, & Jain, 2013; Buzby et al., 2006; Di Valentin, Pacchioni, & Selloni, 2005; Gültekin, 2014; Hamal & Klabunde, 2007; Hermawan, Pranowo, & Kartini, 2011; Hernández-Martínez, Estevez, Vargas, Quintanilla, & Rodríguez, 2012; Li, Ding, Liu, & Ning, 2013; Niemela, Yamauchi, & Karppinen, 2014; Seery, George, Floris, & Pillai, 2007; Sobana, Muruganadham, & Swaminathan, 2006; Tian, Gao, Deng, et al., 2013; Tian, Gao, Kong, et al., 2013; Yang et al., 2007), which indicates potential opto-electronic device applications. A surprising fact is the presence of room-temperature ferromagnetism in undoped TiO2 (Hong, Sakai, Poirot, & Brizé, 2006; Yoon et al., 2006). The ferromagnetism is reported to be originated because of oxygen vacancies acting as n-type dopant and cause a magnetic order. Through theoretical calculation (Paxton & Thien-Nga, 1998) the magnetic ordering has been demonstrated to be originated because of the Ti states operating within the bandgap. Transition metal elements are preferred as dopants because of their almost similar ionic radii with the Ti-cations in the host TiO2 lattice, and additionally mediate ferromagnetism. Among many transition metal ion dopants, Ni+2 is considered to be more efficient dopant in TiO2, as it can improve electrical and magnetic properties (Ayieko et al., 2013; Li et al., 2013; Nosaka, Matsushita, Nishino, & Nosaka, 2005). Oganisian et al., synthesized Fe-doped TiO2 by sol–gel method and studied the effect of doping concentration on the magnetism, and suggested the formation of multi-domain structure that enhances with Fe contents (Oganisian et al., 2015). Choudhary et al., have reported the role of Oxygen defects in assisting paramagnetic to ferromagnetic phase change activated through the Fe doping in TiO2 (Choudhury, Verma, & Choudhury, 2014). Similarly, Ni-doped TiO2 is employed to study the effect of dopants on the ferromagnetic properties of TiO2 stabilized in rutile phase (Park, Choi, Lee, Kim, & Kim, 2007). On the other hand, J. Tian et al. fabricated TiO2 thin films by sol–gel process and observed that increase in transition metal concentration reduces magnetization (Tian, Gao, Deng, et al., 2013; Tian, Gao, Kong, et al., 2013). Gultekin, have studied Au-doped TiO2 thin films, and reported that TiO2 show body centered tetragonal structure, and the band gap of TiO2 thin films increases from 3.74eV to 3.89eV with increase in Au nanoparticle concentrations (Gültekin, 2014). Yang et al. characterized C and V – TiO2 photocatalysts by sol-gel process for degradation of acetaldehyde, and observed that V dopants in TiO2 increases the surface area, making it suitable for light activity (Yang et al., 2007). Similarly, Ni-doped TiO2 thin films prepared by spray pyrolysis have shown that Ni stabilizes TiO2 in rutile phase, making it more efficient in photocatalytic applications (Al-Jawad, 2014). Hermawan et al. (2011) synthesized Ni-doped TiO2 nanocrystals by sol–gel process and observed that the crystallite size increases from 18.51nm to 20.35nm and the band gap energy decreases from 2.73eV to 2.51eV. The study of magnetic character in TiO2 oxide semiconductors is motivated because of recent interesting reports on In2O3, ITO, SnO2, in which magnetic doping induced magnetic properties have been illustrated (Babu & Kaleemulla, 2016; Babu et al., 2016; Borges, Scolfaro, Alves, da Silva, & Assali, 2012; Kuppan et al., 2016a, 2016b; Xu et al., 2009). As it is evident in the literature, no report exist on Ni-doped TiO2 for spintronics applications as DMS, fabricated by low cost method, to exhibit ferromagnetism at room temperature (RT).
In this work, Ni-doped TiO2 thin films are deposited by employing a combination of solid-state reaction and dip coating techniques with a focus on magnetic device applications, with various dopant concentrations (xNi=0.00, 1.00, 1.50, 2.00 and 2.50wt.%). Ni is a suitable transition metal magnetic dopant for TiO2 and this diluted magnetic semiconductor has worth applications in magnetic data storage devices. The structural, morphological and ferromagnetic properties have been explored using XRD, SEM and VSM, respectively. The results obtained are correlated and compared with the literature and significant points have been elaborated with a focus on the utilization of the studied thin films for data storage applications.
2Experimental proceduresIn this study, we have employed a very simple and low cost method to prepare Ni-doped (xNi=0.00, 0.50, 1.00, 1.50, 2.00 and 2.50 at wt.%) TiO2 Thin films on glass substrate. For the fabrication of undoped thin film, 3.2g Titanium dioxide powder was added into ethanol solution and stirred using a magnetic stirrer for 1h at 70°C, to achieve a well-mixed and uniform solution. The TiO2 thin film was fabricated onto a glass substrate using dip coating. In this method ultrasonically cleaned glass substrate were dipped into the prepared solution for 2–3 times to get a suitable and uniform thickness of the film. The TiO2 thin film deposited on the glass substrate was dried in an electric oven at 150°C for 15min. In this way one layer of TiO2 was deposited on the glass substrate. This process was repeated 3 times to get appropriate TiO2 layer thickness. Similarly, Ni-doped (xNi=0.50, 1.00, 1.50, 2.00 and 2.50 at wt.%) TiO2 thin films were fabricated by adding appropriate amounts of NiO powders (according to their molar masses) into the TiO2 solution. All the prepared thin films have been annealed in a digital furnace at 650°C for 60min, to enhance the crystallinity. The temperature of 650°C was attained in two steps, from 0°C to 350°C in 90min, and then from 350°C to 650°C in 60min. The crystal structure of thin films is observed with X-ray diffraction (XRD). The surface morphological details are elucidated by employing scanning electron microscopy (SEM). The ferromagnetic behaviors have been studied by vibrating sample magnetometer (VSM).
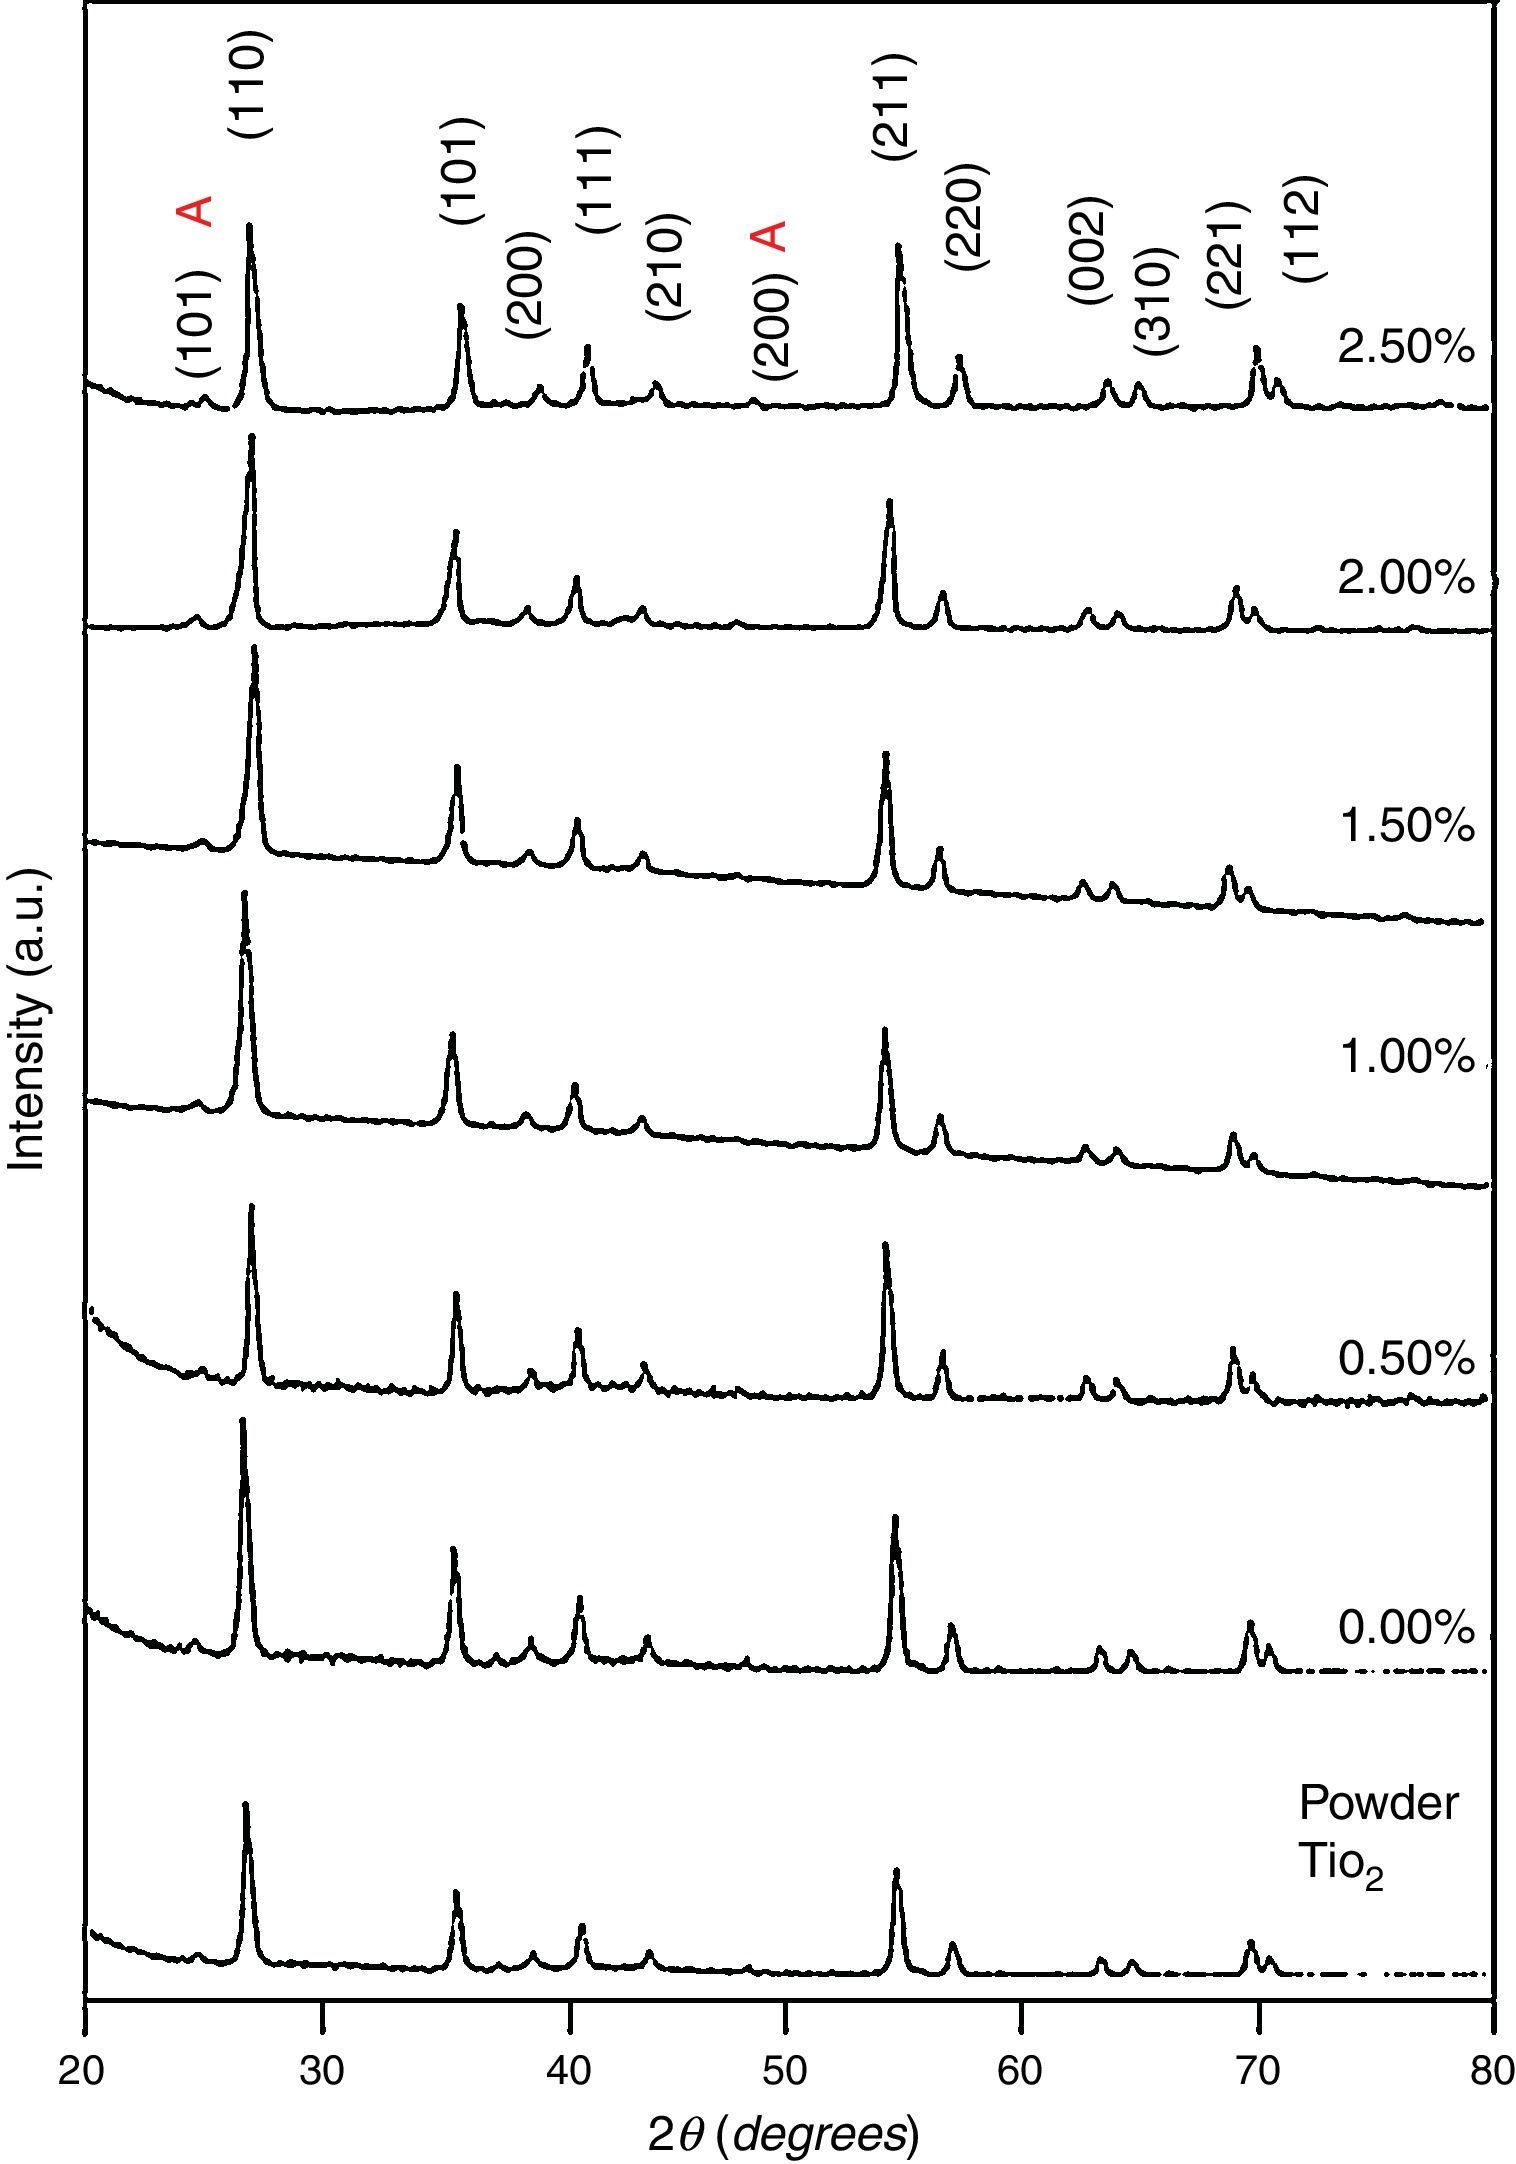
3Results and discussion3.1Structural studyXRD patterns of undoped and Ni-doped TiO2 (xNi=0 to 2.50wt.%) thin films deposited on glass substrates and annealed in air for 1h at 650°C are shown in Figure 1. The X-rays are diffracted at the angles of 25.2°, 27.4°, 36.1°, 39.2°, 41.3°, 44.1°, 48.1°, 54.4°, 56.7°, 62.8°, 64.1°, 69.1° corresponding to various crystallographic planes, as Figure 1 shows. These XRD patterns are compared with ICDD files for anatase TiO2 (ICDD file number: 21-1272) and rutile TiO2 (ICDD File number: 87-0710). For undoped and Ni-doped titanium dioxide, a major phase of rutile TiO2 is evident; nevertheless, a minor phase of anatase TiO2 is also present for all compositions of Ni. The 2θ peaks around 25.2° and 48.1° belongs to the anatase phase for undoped and Ni-doped TiO2. The smaller content of anatase compared to the rutile phase is evident from diffraction intensities. It can be observed that the anatase phase is not induced because of the Ni addition but it is already present in the precursor powder of TiO2, as shown in Figure 1. The lattice constants a and c have been calculated from the XRD spectra for major rutile phases, using the following relation (Wilso, Matijasevich, Mitchell, Schulz, & Will, 2006)
here d denotes the interplanar distance and h, k, l show the miller indices. The calculated lattice constants a and c, for undoped and Ni-doped TiO2, are displayed in Table 1. The calculated lattice parameters are plotted against Ni-concentration as given in Figure 2. The calculated values lattice constants are in good match with earlier reports. The crystallite size is extracted from the major (110) peak using Debye-Scherer's relation (Kuznetsov et al., 2009)where D=crystallite size, k=shape factor that is equal to 0.9, λ=X-ray wavelength and β=full width at half maximum (FWHM). The undoped TiO2 thin film has a crystallite size of 17.677nm. Doping with xNi=0.50%, the crystallite size decreases to 15.919nm. When the dopant concentration further increases to 1.00%, the crystallite size value decreases to 15.704nm. The decreasing crystallite size might be justified by the presence of Ni–O–Ti bonds in Ni-doped TiO2, which inhibits the growth of the crystals. Nonetheless, as the Ni concentration increases further to 1.50%, the crystallite size again increases to 19.677nm, and for the last two concentrations 2.00% and 2.50%, the crystallite size again decreases to 18.847nm and 16.823nm. This shows that the Ni+2 ion replaces Ti+4 ions substitutionally and results in linear decay of the crystallite size. The fluctuation in the crystallite size is due to the lattice strains, which are produced during the synthesis of undoped and Ni-doped TiO2. The crystallite size starts to increase when the number of dislocations decreases with the increase in Ni content (Prabbu, Rao, Kumar, & Kumari, 2013; Purushothan & Krishna, 2015; Vijay et al., 2009). The calculated crystallite size is plotted against the Ni content, as shown in Figure 3. Although, the anatase phase is already present in the precursor TiO2 power but the rutile phase stability can also be justified because of the calculated crystallite size that is >14nm, which is a critical value, below and above, it stabilizes the anatase and rutile phases, respectively (Bahadur, Pasricha, G, Chand, & Kotnala, 2012). The strain present in the samples because of lattice imperfections and distortion is calculated by employing Stoke Wilson formula (Wilso et al., 2006)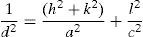


X-ray diffraction patterns of the precursor powder TiO2 and thin films of TiO2 with xNi=0.00, 1.00, 1.50, 2.00 and 2.50%. All the grown thin film samples indicate rutile TiO2 as dominating phase along with a minute contribution from anatase TiO2 phase. However, the presence of the peaks from the anatase phase can be observed from the XRD pattern of the precursor TiO2 powder; therefore, the presence of the anatase phase is not due to Ni addition in TiO2, instead, the anatase phase is already present in the precursor TiO2 powder.
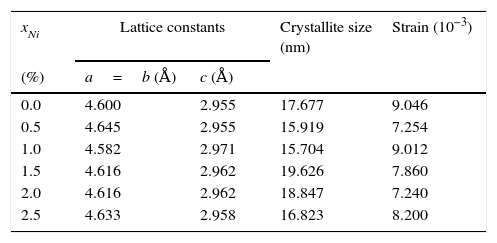
The lattice constants, crystallite size and strain calculated from XRD patterns.
| xNi | Lattice constants | Crystallite size (nm) | Strain (10−3) | |
|---|---|---|---|---|
| (%) | a=b (Å) | c (Å) | ||
| 0.0 | 4.600 | 2.955 | 17.677 | 9.046 |
| 0.5 | 4.645 | 2.955 | 15.919 | 7.254 |
| 1.0 | 4.582 | 2.971 | 15.704 | 9.012 |
| 1.5 | 4.616 | 2.962 | 19.626 | 7.860 |
| 2.0 | 4.616 | 2.962 | 18.847 | 7.240 |
| 2.5 | 4.633 | 2.958 | 16.823 | 8.200 |

The lattice parameters a and c, evaluated from XRD patterns of undoped and Ni-doped TiO2 thin films are plotted against the Ni content. The graph shows that with increasing the Ni content the value of lattice constants a and c varies from 4.60Å to 4.63Å and 2.955Å to 2.977Å, respectively.
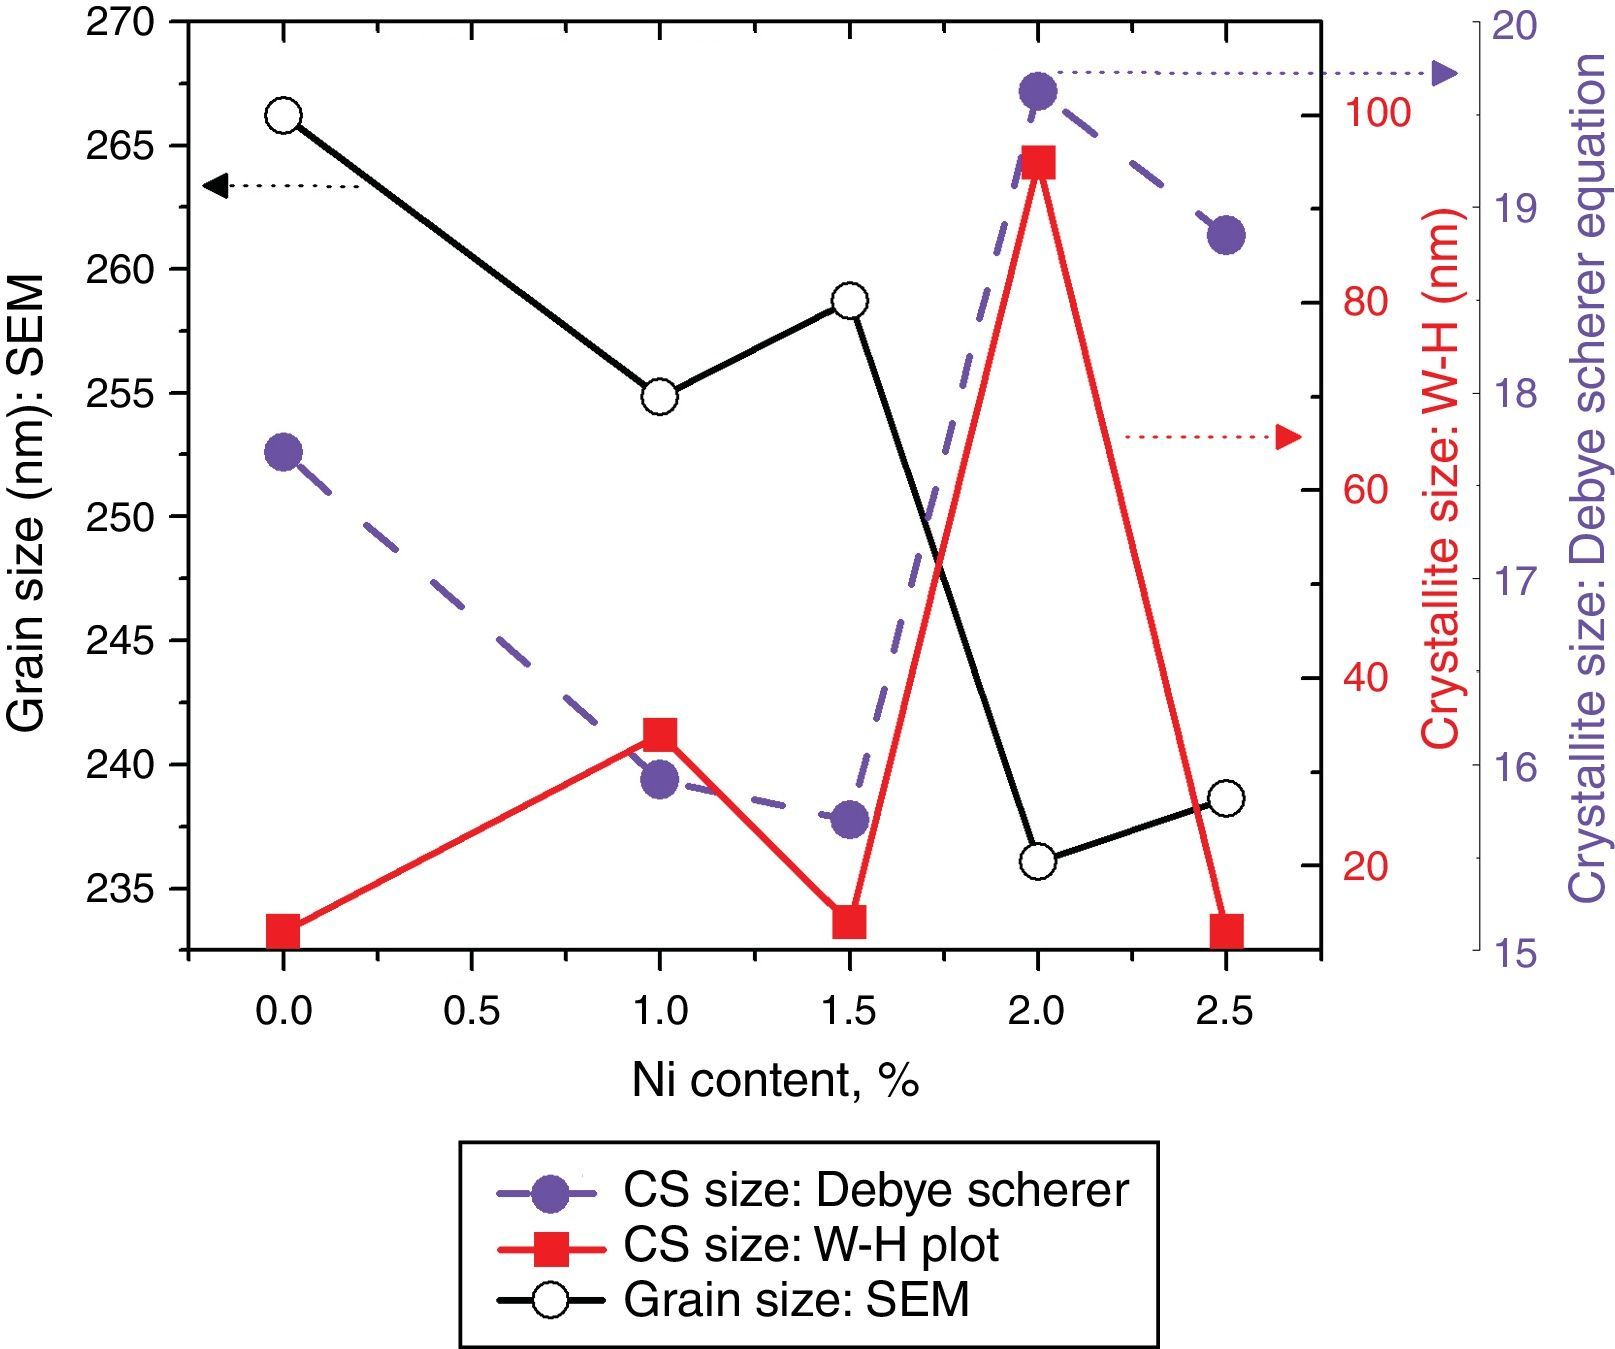
 are plotted against the Ni content. The graph shows that with varying the Ni content there is a small fluctuation in the grain size as determined from the SEM images; however, it has an overall decreasing tendency. The crystallite size randomly varies with the Ni content.")
Crystallite size calculated from the XRD and W–H analysis and grain size observed by SEM (see Fig. 5) are plotted against the Ni content. The graph shows that with varying the Ni content there is a small fluctuation in the grain size as determined from the SEM images; however, it has an overall decreasing tendency. The crystallite size randomly varies with the Ni content.
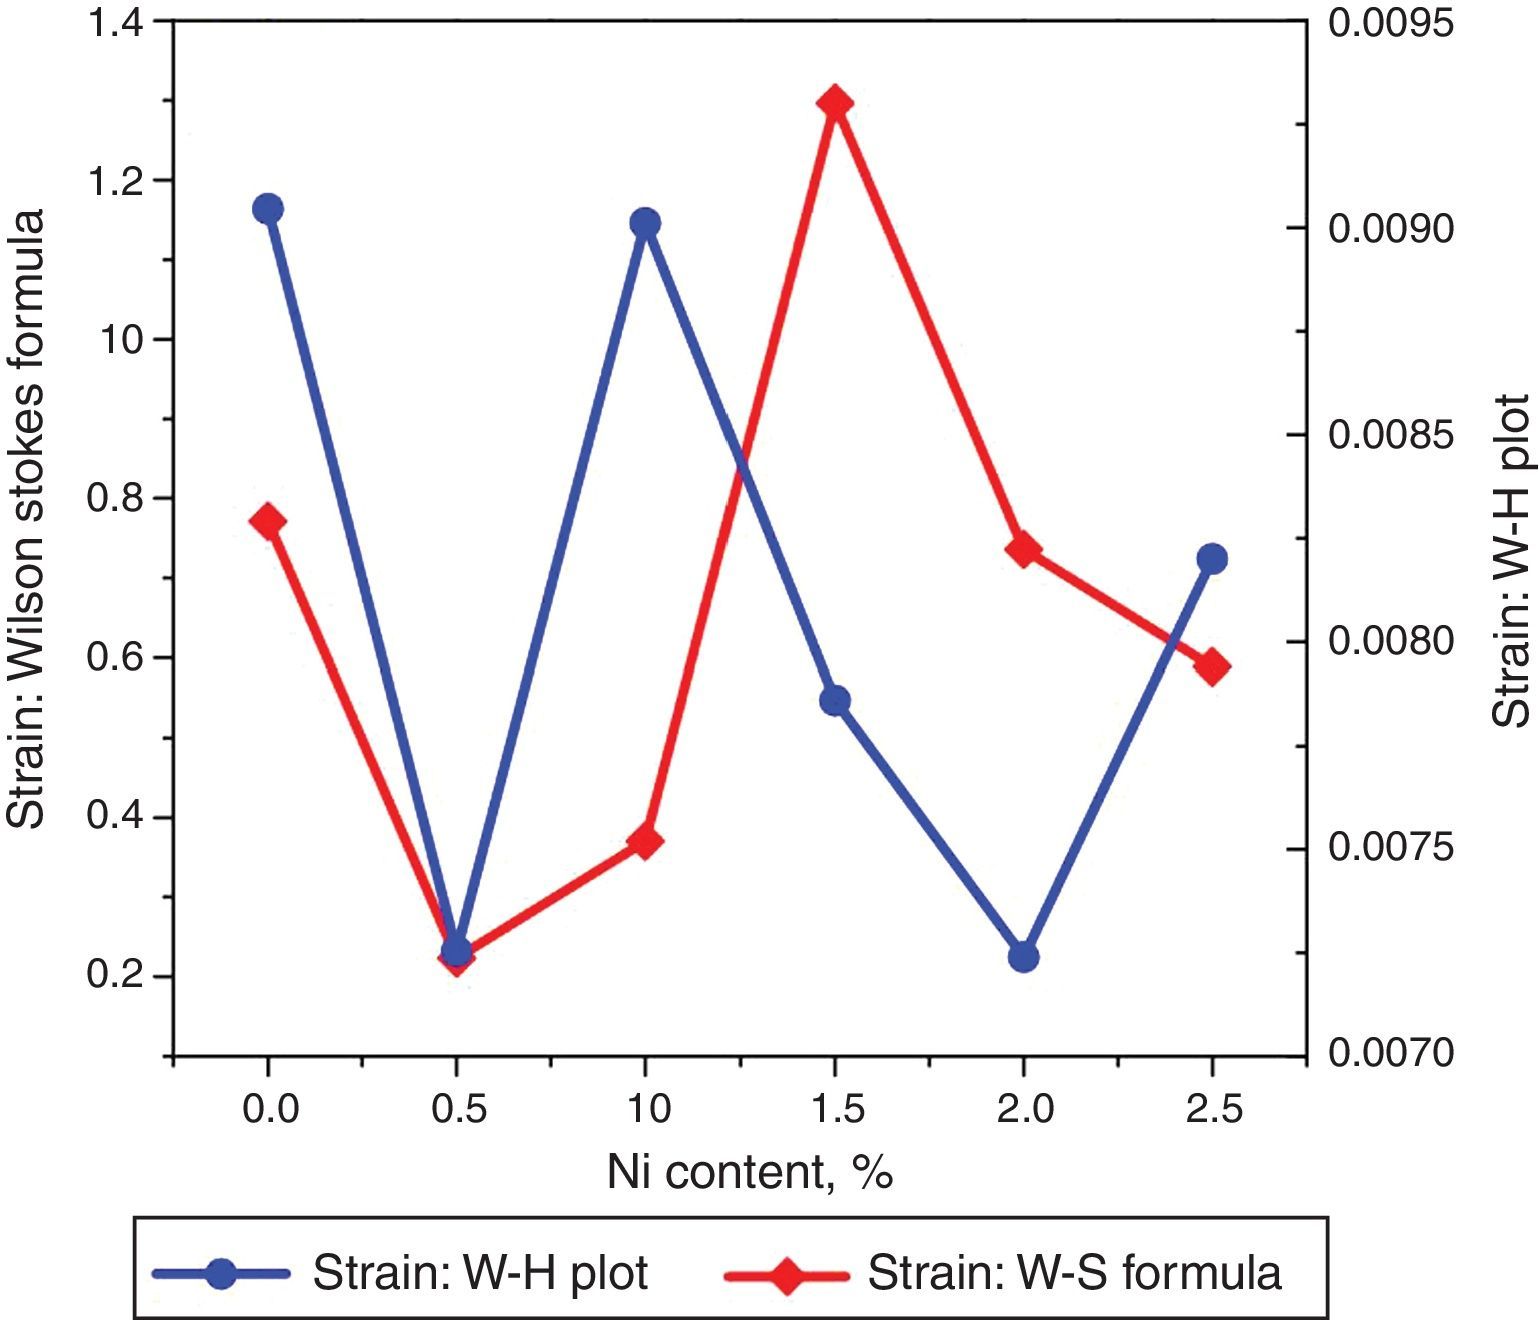
The undoped TiO2 thin film possesses strain value of 9.046×10⁻³. Upon doping with xNi=0.50%, strain value decreased to 7.254×10⁻³. When dopant concentration was further increased to 1.00%, strain value increased to 9.012×10⁻³. However, as the Ni concentration increased further to 1.50%, associated strain value decreased to 7.86×10⁻³ and for the last two concentrations 2.00% and 2.50%, strain values are 7.24×10⁻³ and 8.20×10⁻³ respectively. The smaller values of strain and dislocation density enhance free carrier mobility in the host lattice. During the thermal energy relaxations within the sample, certain deformations are produced depending on temperature gradient in different directions which is the cause for increase and decrease in strain. Secondly, since strain is inversely related with crystallite size therefore variation in crystallite size will alter the related deformations within the sample (Kuznetsov et al., 2009; Prabbu et al., 2013; Purushothan & Krishna, 2015; Wilso et al., 2006).
The strain values plotted versus Ni content are depicted in Figure 4. Using Williamson–Hall (W–H) plot method, the crystallite size and the strain are further computed. The following equation has been utilized to elucidate the required properties (Patle, Labhane, Huse, & Chaudhari, 2015).
where, D=Crystallite size, ¿=strain. Eq. (3) is called as W–H equation. We have plotted graphs for all concentrations of Ni by taking 4sinθ/λ and βcosθ/λ along x- and y-axis, respectively. By linear fitting the calculated data, the crystallite size and strain is extracted from y-intercepts and slopes of the linear fit lines, respectively. A comparative investigations between crystallite size and strain, calculated from Debye-Scherer's relation, Wilson-stokes relation and W–H plot are given in Figures 3 and 4, respectively. The strain calculated from Wilson–Stokes relation has somehow different values as compared to that calculated by using W–H plot method, which might be due to the involvement of various peaks in W-H plot with different FWHM, therefore, different strain values appear. The most intense (110) peak has been used to calculate strain using Wilson-stokes relation. According to a dislocation model, the defects may induce anisotropic strain with in the crystals, therefore, magnitude of strain may vary for various crystallographic planes and this might be the reason for observed considerable differences in the strain calculated by two methods (Ungar, 2008). The presence of strain indicates the imperfections are present in the fabricated samples, which could either be arising from the film-substrate interface, Ni dopant introducing stresses into the host TiO2 lattice or because of the native ion defects arising because of the employed growth conditions, in which the employed thermal energy is not significantly relieved from the host lattice, and therefore, exerts stresses.3.2Surface morphology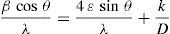

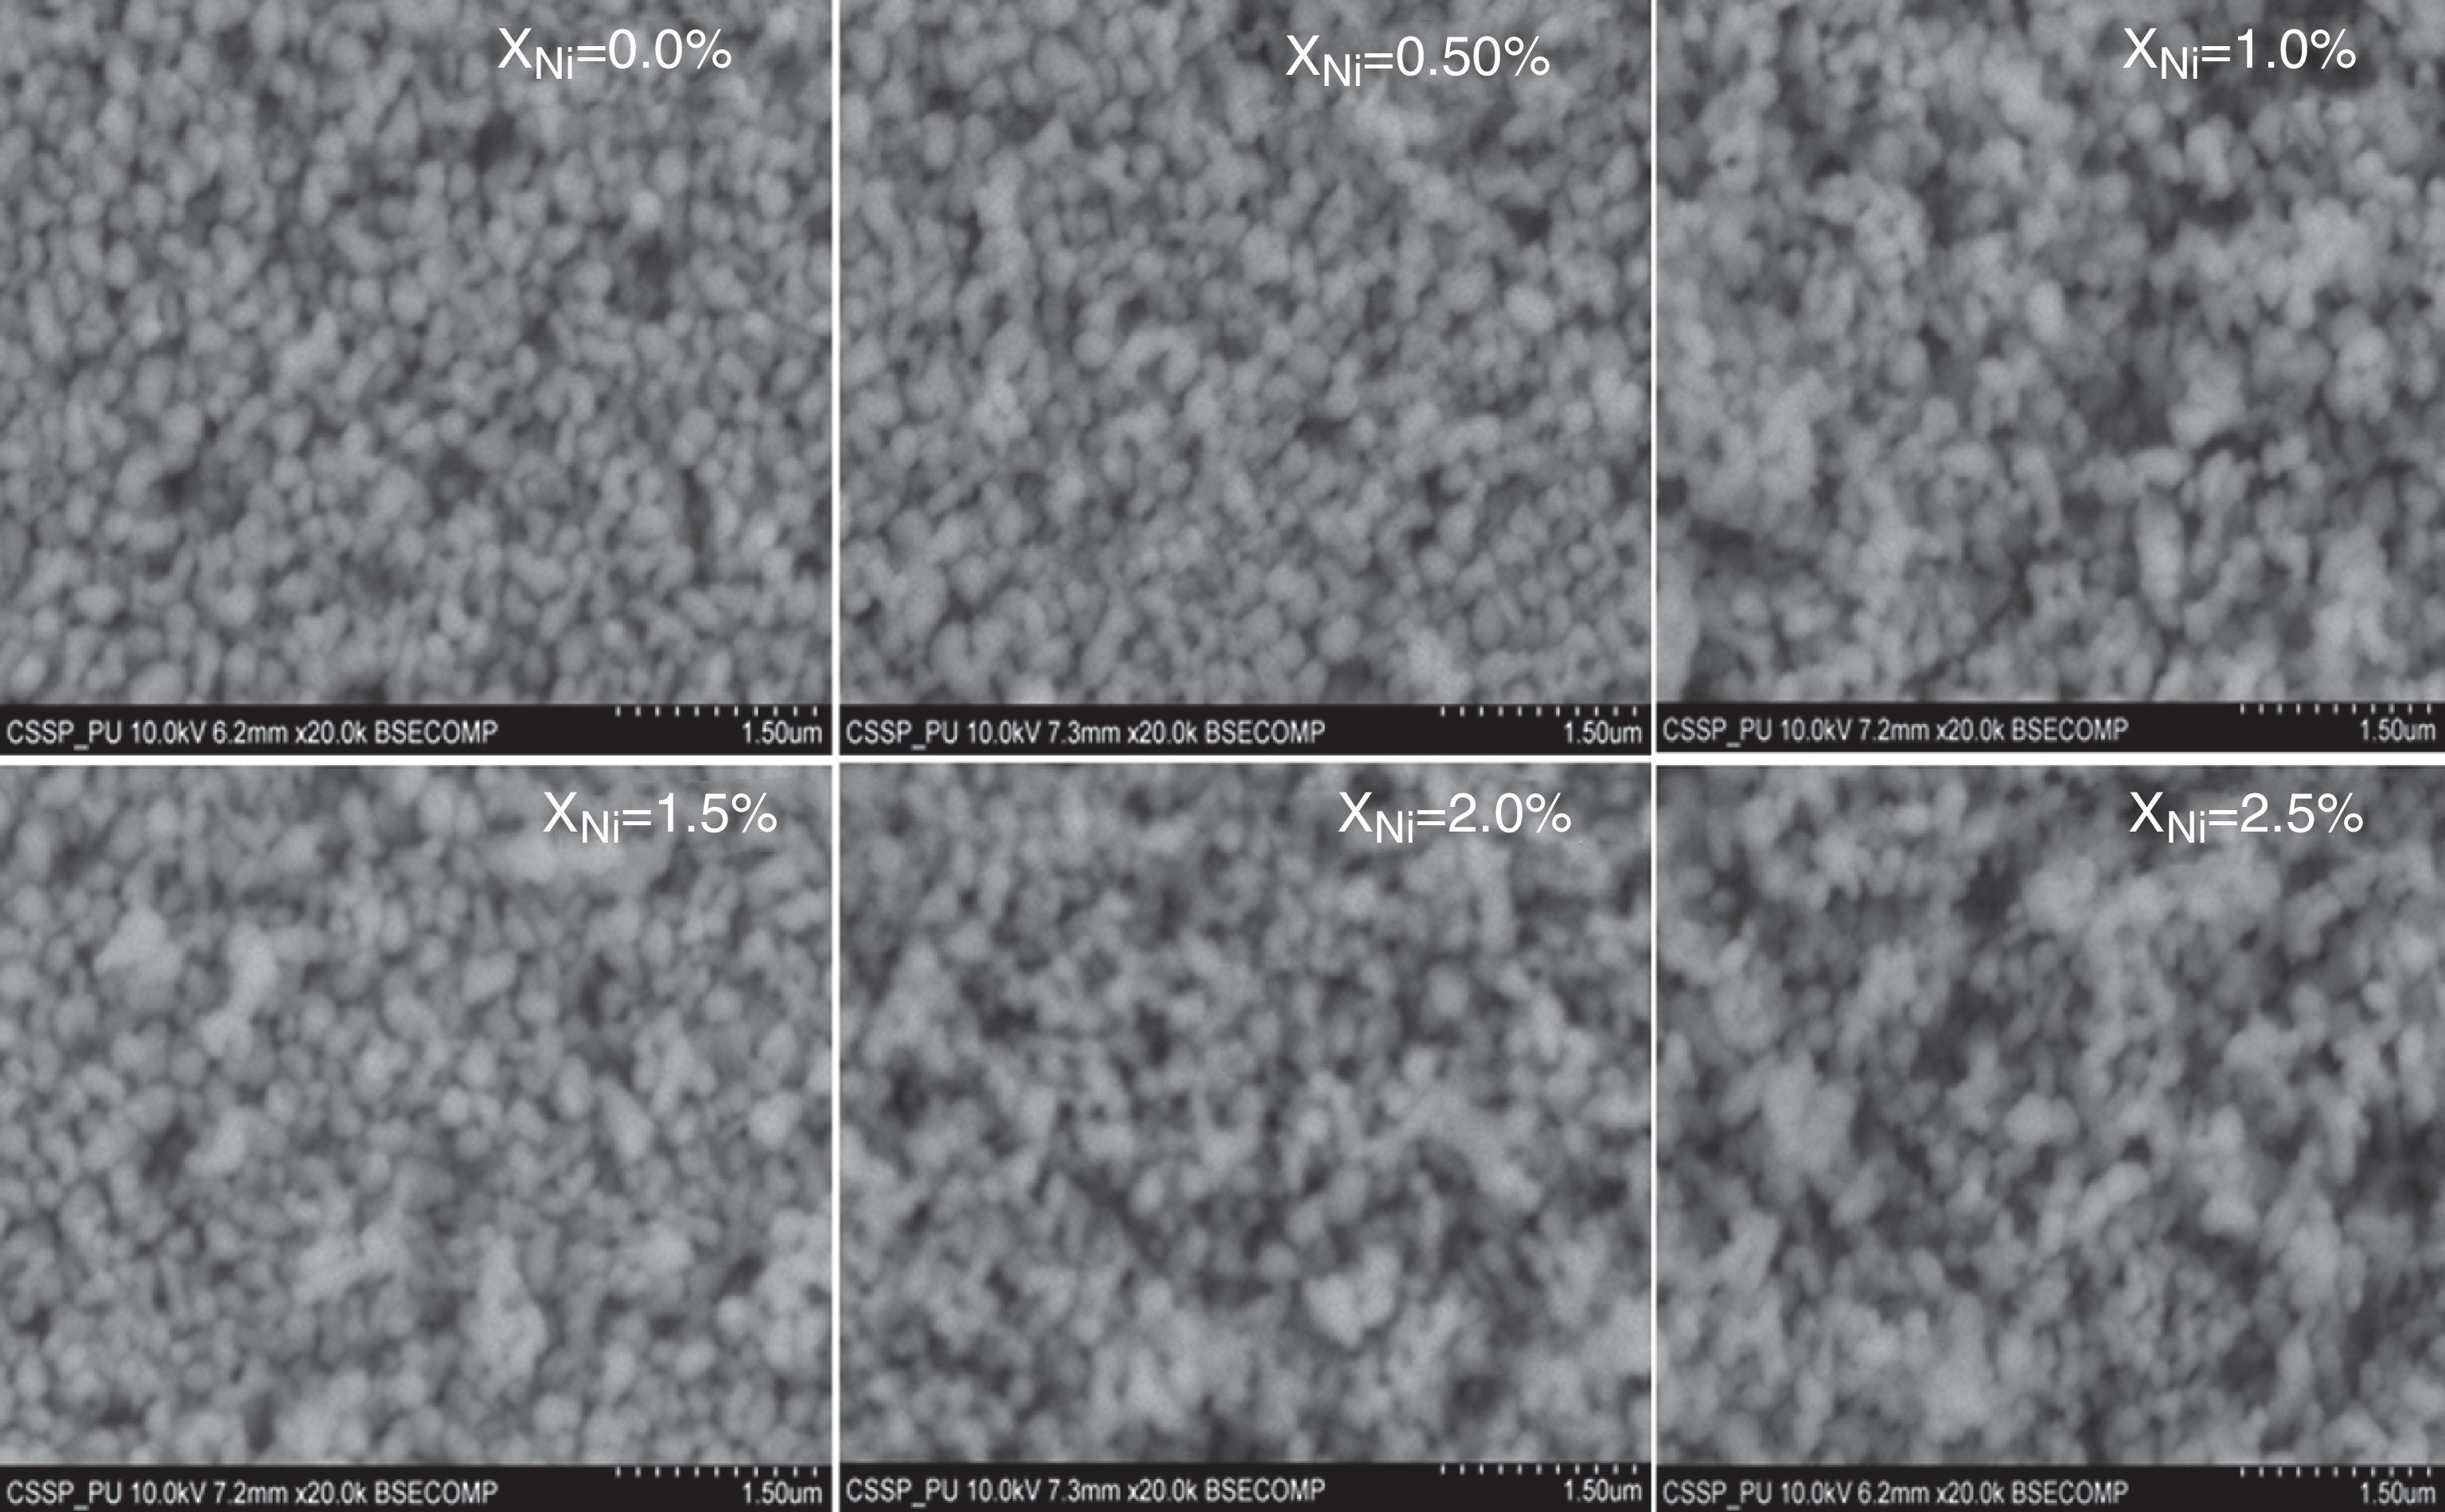
The SEM micrographs of Ni-doped TiO2 (xNi=0.00, 0.50, 1.00, 1.50, 2.00 and 2.50 at wt.%) thin films are given in Figure 5. In general, all these thin film samples have exhibited a granular structure. The different nanograins on the surface do not have large size variations. However, a porous structure between different grains is also evident. The calculated grain size decreases from 266.19nm to 222.17nm with increase in Ni concentration (xNi=0.00, 0.50, 1.00, 1.50, 2.00 and 2.50wt.%). We have compared the crystallite size calculated from XRD patterns and the grain size calculated from SEM, for varying Ni content as given in Figure 3. There is a small fluctuation in grain size with increasing Ni content; however it has an overall decreasing tendency. The XRD crystallite size decreases as the Ni content increases above up to xNi=1.00%, further increasing the Ni content reduces the crystallite size. Moreover, the crystallite size calculated from XRD and the Williamson analysis are plotted in Figure 3, in which it is evident that with varying the Ni content a small fluctuation in grain size occurs, as determined from the SEM images. The difference between the crystallite size and grain size variations are due to the fact that both should be considered as independent parameters because an ambiguous relation exists among them. Because, a big grain shown by an SEM image may contain several crystallites, as depicted by XRD studies. The crystallite size extracted using Debye Scherer formula is much smaller than the grain size elucidated from SEM, which is due to the polycrystalline nature of the grown thin film. A grain may be composed of several crystallites because of which, while calculating the average crystallite size using XRD, we sum up all the crystallites contributing to various grains (Hasan & Nasir, 2015). However, we can expect comparable grain and crystallite size if the grown material is single crystalline in nature. Therefore, an obvious relation between both could not be expected (Bushroa, Rahbari, Masjuki, & Muhamad, 2012; Tomaszewski, 2013), and transmission electron microscopy (TEM) investigations can further clarify the relation. The crystallite size calculated from W-H plot and Debye Scherer formulas have a similar trend, which indicates the accuracy of the present work. It has been reported that the surface morphology of TiO2 thin film samples shows columnar grains and roughness of the surface increases with increasing doping (Gültekin, 2014). Similarly, Ahmad MK et al. reported that TiO2 thin films deposited on silicon substrate have smaller pores on the surface, and the grain size increases with increasing the annealing temperature (Ahmad et al., 2010). The evidence of the presence of nanograins, as shown by SEM images, with rutile TiO2 major phase determined by XRD, indicates potential applications of Ni-doped TiO2 thin films in the microelectronic industry.

SEM micrographs of undoped and Ni-doped TiO2 thin films deposited on glass substrates. The granular structure along with pores between the grains are present. The measured values of the grain size from the SEM images depict that it decreases continuously as the Ni content in TiO2 thin films is increased.
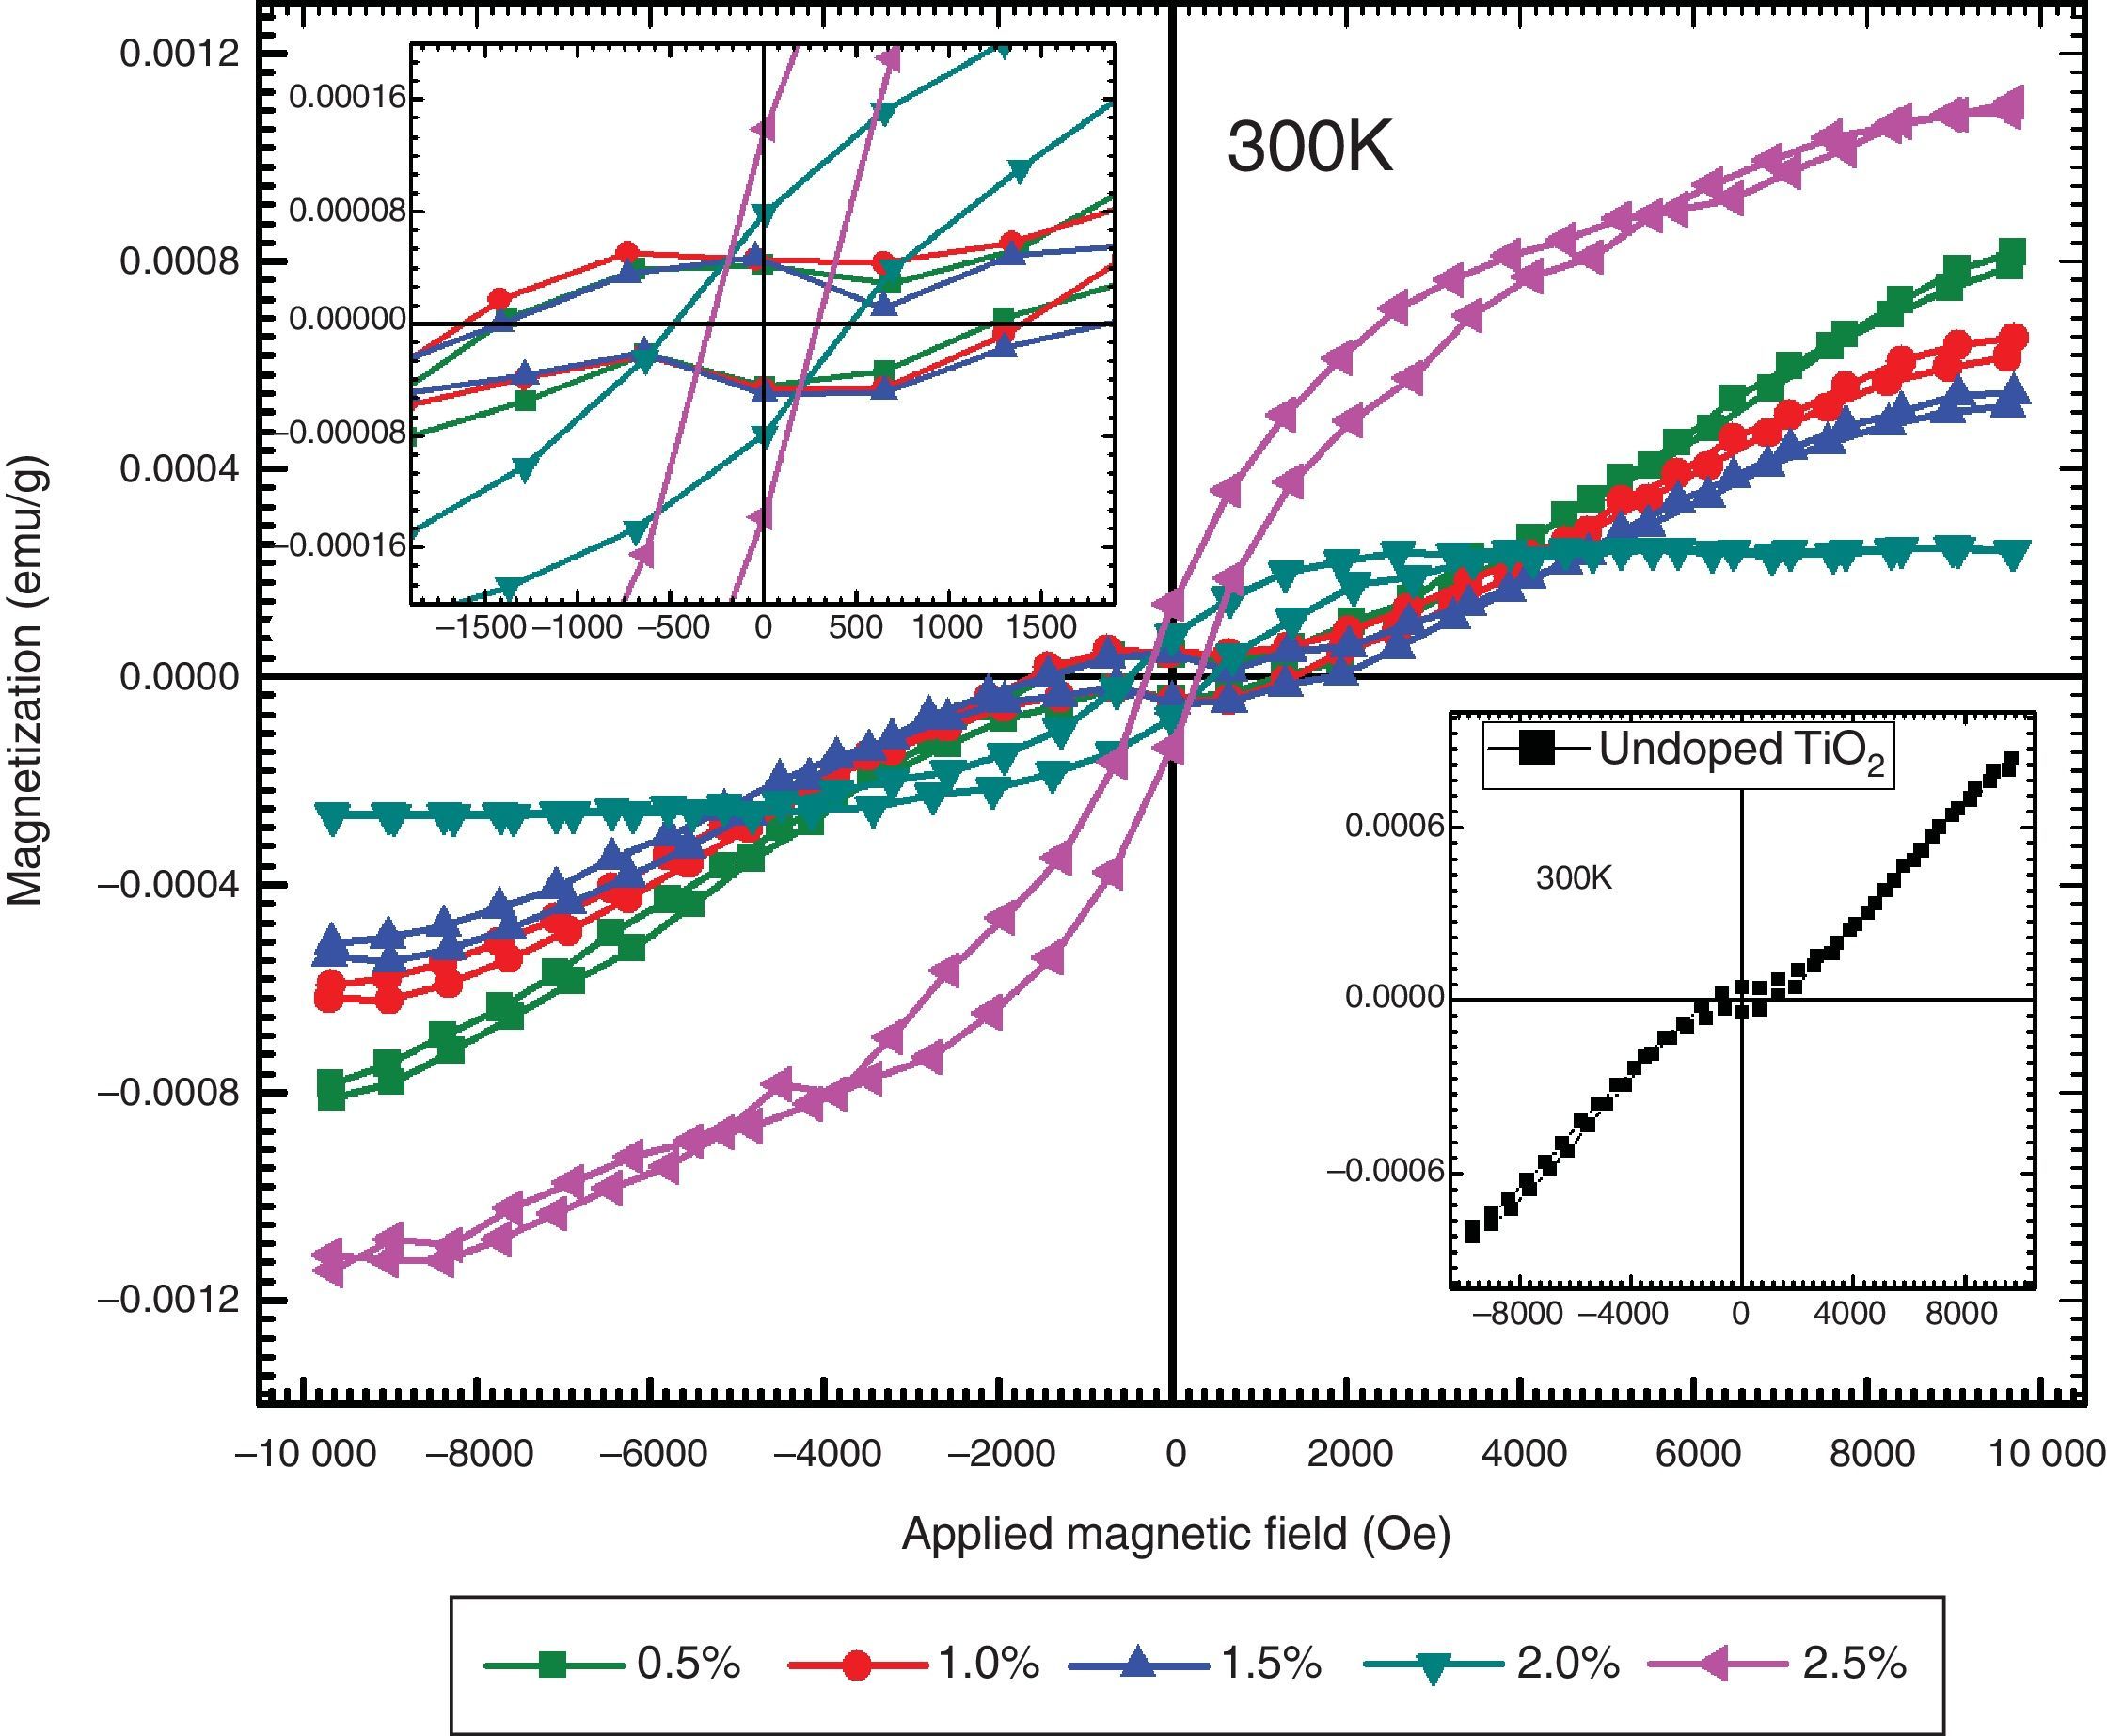
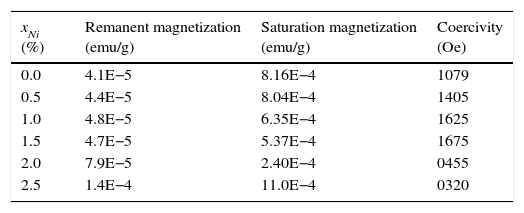
The magnetic behaviors of Ni-doped TiO2 thin films are investigated with Vibrating Sample Magnetometer (VSM). The VSM results have shown that ferromagnetic behavior is exhibited by all thin films. The graphs show typical hysteresis loops due to each specimen exhibiting coercivity and remanence, as shown in Figure 6. The diamagnetic effects due to the glass substrates are suppressed by the ferromagnetic signals of the undoped and Ni-doped TiO2 thin films. The hysteresis loops of TiO2 thin films for undoped and doped with xNi=0.50% and xNi=1.00%, shows that in addition to ferromagnetism, there is also a paramagnetic behavior that can be seen from the linear variation of magnetization at higher values of the applied magnetic field. The hysteresis loops of TiO2 thin film doped with xNi=1.50%, xNi=2.00% and xNi=2.50%, shows ferromagnetic behavior, and from these graphs it can be seen that saturation magnetization Msat enhances with Ni content. The values of remanent magnetization Mr, saturation magnetization MS and coercivity Hc of Ni-doped and undoped thin films are listed in Table 2. Remanent magnetization increases continuously up to the sample with xNi=1.50%, however, above this concentration, a sharp increase has been observed. The saturation magnetization decreases up to xNi=2.00% and then a sudden increase appears for TiO2 thin film with xNi=2.50%. The coercivity increases up to the sample with xNi=1.50%, however, it decreases sharply for the samples with xNi=2.00–2.50%, which suggest that Ni-doped TiO2 thin films show soft ferromagnetic behavior at higher Ni concentrations and hard ferromagnetic behavior at lower Ni content, indicating the potential spintronic device applications of TiO2. There are many reports in the literature about the magnetic properties of rutile and anatase phase of TiO2. Recently, Bahadur et al. reported that the magnetic moment of TiNiO2 rises at lower Ni concentrations but with increasing Ni concentration it decreases (Bahadur et al., 2012). The magnetic properties are determined at 300K (room temperature), therefore, the presence of hysteresis even in the undoped TiO2 indicates the presence of room-temperature ferromagnetism (RTFM) (Gao, Tian, Zheng, Tan, & Zhang, 2015), which could be justified by the presence of oxygen interstitial defects. The presence of oxygen defects in the undoped host lattices have already been reported to mediate room-temperature ferromagnetism (Das, Kar, & Srinivasan, 2014). It has already been reported that intrinsic TiO2 is n-type semiconductor, which become p-type because of Ni doping. The n-type to p-type change in character is due to the vacancies introduced by the Ni dopant. In order to determine the real origin of room-temperature ferromagnetism (RTFM) in the studied thin films, we can consider various possible mechanisms. One possibility of the appearance of RTFM is due to the presence of secondary phases (Radovanovic & Gamelin, 2003; Schwartz, Norberg, Nguyen, Parker, & Gamelin, 2003) which could be ruled out, according the XRD that excludes the secondary phase appearance. Another mechanism is the formation of bound magnetic polaron (BMP). It has already been reported that TiO2 exhibits robust polaronic effect. According to BMP, effective mass of carriers is increased because of the sturdy electron-phonon interaction. A trapped electron at an oxygen vacancy causes an F-center, and because of its orbital, it will effectively overlap surrounding Ni ions. Hence the possible mechanism for origin of magnetism in TiO2 is due to the F-center induced BMP, which is mediated by localized electrons, surrounding the impurities (Tian, Gao, Deng, et al., 2013; Tian, Gao, Kong, et al., 2013; Choudhury et al., 2014). Similarly, RKKY model (i.e. the indirect exchange interactions), can also be used to explain the origin causing ferromagnetic behavior in TiO2 host lattice. In RKKY interactions, Ni+2 ions are ferromagnetically coupled through the free carriers (Bahadur et al., 2012).

The hysteresis loops measured at 300K for TiO2 thin film doped with xNi=0.50%, 1.00%, 1.50%, 2.00% and xNi=2.50% showing ferromagnetic behavior. The inset figure on the upper left side is plotted around ±2000Oe to observe the details around the origin. The inset figure in the lower right corner shows the hysteresis loop measured for the undoped TiO2 thin film.
The remanent magnetization, saturation magnetization and coercivity extracted from the measured hysteresis loops.
| xNi (%) | Remanent magnetization (emu/g) | Saturation magnetization (emu/g) | Coercivity (Oe) |
|---|---|---|---|
| 0.0 | 4.1E−5 | 8.16E−4 | 1079 |
| 0.5 | 4.4E−5 | 8.04E−4 | 1405 |
| 1.0 | 4.8E−5 | 6.35E−4 | 1625 |
| 1.5 | 4.7E−5 | 5.37E−4 | 1675 |
| 2.0 | 7.9E−5 | 2.40E−4 | 0455 |
| 2.5 | 1.4E−4 | 11.0E−4 | 0320 |
Transition-metal-doped TiO2 has already been reported to exhibit ferromagnetism mediated by super-exchange d-d mechanism, which increases with increasing dopant concentrations. Therefore, the increase in dopant concentration should result in increase in magnetization of the host lattice, however, a different trend we have found in the studied Ni-doped TiO2 thin films, as evident in Table 2, where up to xNi=2%, remnant magnetization increases but saturation magnetization decreases. As observed in Table 2, the coercivity is higher at smaller dopant concentration, but it decreases at higher Ni content (xNi=2.0–2.5%), indicating a shift of relatively hard to soft ferromagnetic behaviors of the fabricated thin films, which could be associated with the residual strains, as determined from XRD, that can reduce the magnetic anisotropy of the doped TiO2 thin films.
The variation in ferromagnetic characteristics is related with the XRD and SEM studies. By increasing the magnetic impurity concentration in TiO2, there appears no secondary phase belonging to Ni, as depicted in Figure 1, where a major rutile phase of TiO2 thin films appear. This shows that Ni+2 ion replaces Ti+4 ions substitutionally and result in a nearly linear decay of SEM grain size, as is evident in Figure 3. The corresponding magnetic properties also vary linearly, as illustrated by VSM results in Table 2, which is in agreement with the earlier reports that content of added magnetic ions, substituting the host lattice cations, may induce proportional ferromagnetic behavior, in the host lattice (Bahadur et al., 2012; Sabry, Al-Haidarie, & Kudhier, 2016).
4ConclusionsUndoped and Ni-doped TiO2 thin films have successfully been synthesized on glass substrates by a very simple solid-state reaction and dip coating technique. It has been observed that Ni doping plays a vibrant role in the exhibited physical characteristics such as crystal quality, crystallite size and magnetic characteristics of Ni-doped TiO2 thin films. The observed average crystallite size is 17.677nm. Good agreement between values of the crystallite size and strain, extracted from the major XRD peaks and through the W-H analysis, has been found. The surface morphology of all samples elucidated by SEM shows that there is an overall decreasing tendency in nanograin size with increasing Ni content. The average grain size decreases from 266.19nm to 222.17nm with the added Ni content. Room-temperature ferromagnetism (RTFM) is illustrated in the prepared thin films. The measured characteristics of the studied thin films are found to depend upon the Ni content, where it shows hard ferromagnetic behavior up to xNi=1.5% and exhibits soft ferromagnetic trend above xNi=1.5%, therefore, the observed characteristics of Ni-doped TiO2 thin films are tunable by the Ni content and can be employed in various spintronic device applications.
Conflict of interestThe authors have no conflicts of interest to declare.
One of the authors, Mahmood-ul-Hassan (M. Hassan), is thankful to University of the Punjab, Lahore, for financial support through order no. D/1384/Est-I.
Peer Review under the responsibility of Universidad Nacional Autónoma de México.