


A prefeasibility study of a solar power plant project was carried out in order to study and search the best location to install a concentrated solar power plant according to a tender with the Algerian electricity company “SPE” following a specific criteria and methodology in order to obtain a site with a maximum possible irradiation along with other economic constraints. Normally, eleven years of solar irradiation data from an on-ground weather station is needed for site assessment, such data are not available, hence the typical meteorological year irradiation based on satellite imagery results is needed in order to have the accurate value, therefore we can give the right evaluation for the site candidate. Additionally, an analysis of a weather measurement station was carried out to ensure the proper functioning of the weather data reception and analysis processes, and thus to optimize the algorithm of a data logger in order to get the right measurement with a minimum error. The correction algorithm was developed by weather scientists and was added to the data logger main program.
Un estudio de prefactibilidad de un proyecto de planta solar se lleva a cabo para estudiar y buscar la mejor ubicación, esto es para instalar una planta de energía solar concentrada, de acuerdo con un petición de oferta a la compañía eléctrica Argelina SPE, siguiendo los criterios y la metodología específica para obtener un sitio con un máximo posible de irradiación. Normalmente, se necesitan once años de datos de irradiación solar de la estación meteorológica para la evaluación del sitio. Estos datos no están disponibles, por lo que necesitamos la TMY basado en los resultados de las imágenes de satélite para tener el valor preciso. Por lo tanto, podemos dar a la evaluación correcta para el sitio. Un análisis de medición de una estación meteorológico se efectuó por asegurar el buen funcionamiento de la recepción de datos de la estación meteorológica, y consecuentemente lleva a optimizar el algoritmo de la data logger para obtener la medida correcta con un error mínimo posible. El algoritmo de corrección fue creado por meteorólogos y fue agregado al programa principal de data logger.
for over a century, the world has experienced a major economic growth that humanity had never seen before. The development of industry, the increasing number of vehicles and the increase of the number of household appliances have caused a significant growth in energy demand [23, 34]. Unfortunately, this growth in demand has been mainly covered by importing fossil fuel because of economic considerations. Other factors such as CO2 emissions, fossil fuel depletion, and national energy independence have not been taken into consideration [5, 16, 17].
As an alternative to these concerns, the development and implementation of renewable energy is unavoidable. Renewable energy resources are unlimited, widely available and should be exploited [2, 6, 12, 32].
One of those renewable energy resources is concentrated solar power (CSP), which presents the greatest potential for commercial exploitation because of its nature, because it can be stored in the form of thermal energy, and because it can hybridized. However, not all areas are suitable for this technology; there are certain criteria and methodology in order to select the right place to install the concentrated solar power plant to obtain the maximum efficiency. Also, there are some economic reasons.
This paper is divided into 2 sections: We have devoted the first part to present the project and the methodology of the site assessment as well as the typical meteorological year and how to deal with the difference of the gathered solar irradiation from time to another. In the second part, we have presented the correction algorithm in order to optimize the data logger's irradiation measurement.
2Site assessment methodologyThe purpose of the sitting assessment is to identify and evaluate a certain number of sites for 50MW or for a larger plant in this country. This assessment has provided the company team with necessary data on which to base development model scenarios to provide a broad roadmap for future project developments. Generally, a potential CSP site will need several years of high-quality on-site data using measurement from weather stations. However, in the current CSP market, such data are not usually available especially for the third-world countries; therefore, we must rely on a number of techniques to provide the most accurate determination of site resource characteristics based on any available information sources. Usually, the on ground solar data needs using meteorological stations for approximately 10 years. Such data is not available in our case; hence, access to satellite-derived DNI is the solution for this study.
In most of the cases, prefeasibility studies use low-quality solar data using satellite-derived DNI, just to approximate areas with the highest radiation [4, 9, 10, 13, 14, 15, 33]. During feasibility assessments and engineering analysis stage, some periods of high-quality measurements are assumed to be available at the site after installing meteorological instruments; nevertheless, these relative short-term measurements are insufficient because of climate variations from year to year [24, 26, 29, 30].
Thus, the starting point of the site research, Figure 1, is done on desk. The site assessment must take into consideration the following elements:

Solar resource: Solar resource is a key decision element to determinate the appropriate sites. In this step we have to fix a border of the highest DNI (Direct Normal Irradiation) areas in the selected region or according to the tender requirement.
Once the border/provinces are fixed, we need to identify the electrical data.
Transmission lines and electrical substations: The availability of adequate transmission lines and electrical substations close to the selected terrain is another key element for selecting the appropriate site.
Adequate relief: A second basic requirement is suitable relief. The land area required by a 50MW solar plant with 6 hours of storage is about 300 hectares. Parabolic trough and power tower plants require land that has a slope less than 2% (50 meters altitude difference). Relatively flat areas of land with sufficient surface, which do not have of course significant residential or commercial development and which do not appear to be in an obvious floodplain can be considered for evaluation and can be candidates.
Other factors were taken into consideration in this approach such as land ownership, water resources, economic benefits/costs, environmental considerations and some other sociological/political issues.
As a result of these approaches, several candidate sites are identified. From these numerous site candidates, an evaluation study is carried out to filter and rate site candidates. The site candidates that have the higher rank are subject of study by a team who usually visits the terrain.
Once the prefeasibility study is done and the matrix of site candidates is drawn, three or four sites that have the maximum rating will be subject of study.
Because the satellite solar imagery is not accurate (Table 1) enough to judge the quality of the site, a weather station is be installed in order to gather the solar data [19, 20, 27, 28].
Satellite and measured DNI
| DNI (kW h/m2) | |||||||||
|---|---|---|---|---|---|---|---|---|---|
| 2004 | 2005 | 2006 | 2007 | 2008 | 2009 | 2010 | Average | 2010 Meteonorm | |
| Jan | 124.22 | 125.85 | 152.12 | 147.04 | 132.84 | 110.16 | 132.04 | 23.66 | |
| Feb | 130.52 | 134.83 | 121.45 | 135.48 | 167.70 | 123.87 | 123.63 | 133.93 | 66.80 |
| Mar | 170.90 | 188.38 | 151.43 | 174.63 | 183.50 | 154.12 | 182.05 | 172.14 | 148.82 |
| Apr | 164.08 | 157.63 | 168.14 | 159.94 | 173.79 | 168.73 | 177.86 | 167.17 | 198.81 |
| May | 232.44 | 230.19 | 245.39 | 216.18 | 240.67 | 206.86 | 236.33 | 229.72 | 162.67 |
| Jun | 247.00 | 262.10 | 257.31 | 265.73 | 255.86 | 244.32 | 225.29 | 251.09 | 215.32 |
| Jul | 247.93 | 253.26 | 237.33 | 241.36 | 238.43 | 228.64 | 238.11 | 240.72 | 263.75 |
| Aug | 230.04 | 187.48 | 229.67 | 227.01 | 209.06 | 212.50 | 222.87 | 216.95 | 221.61 |
| Sep | 188.80 | 190.09 | 175.45 | 202.01 | 171.10 | 167.15 | 192.17 | 183.82 | 209.18 |
| Oct | 166.77 | 178.73 | 151.87 | 181.38 | 168.23 | 175.89 | 158.70 | 168.79 | 136.66 |
| Nov | 126.56 | 132.37 | 141.83 | 141.10 | 141.91 | 141.53 | 153.59 | 139.84 | 106.68 |
| Dec | 123.95 | 122.22 | 138.83 | 128.60 | 125.02 | 107.50 | 124.35 | ||
| Sum | 2028.99 | 2161.53 | 2144.54 | 2225.54 | 2222.30 | 2064.00 | 2020.76 | 2160.58 | |
Figure 2 shows the difference between the measured DNI from a weather station and the one from a satellite. There are always gaps between the two curves [22].

Experiences and studies carried out for the last 30 years show that it requires at least 11 years of solar data to model the DNI [1, 2, 3]. This means that it is impossible to build CSP in just few years since we do nott have data for 11 years and knowing that satellite imagery of radiation is not enough for the selection. Methods were developed to ease the way of the solar assessment: at the first stage, we gather 11 years of solar data using satellite (Meteonorm software for example), measure one year solar irradiation using on ground radiometers and then the typical metrological year (TMY) is calculated.
At the first step, the average amount of the satellite irradiation is calculated for each month. Then it is compared with the measured irradiation. Finally the TMY curve is drawn.
3Correction algorithm for solar irradiation measurementAs mentioned previously, once the site candidates are selected, a weather station is built on those who have the highest rank. The satellite imagery is not accurate enough to make the decision and the meteorological station as well.
However, it is believed that the on-ground data is not correct enough; there is always a gap between the weather station and the satellite imagery irradiation. The gap is normal, but the difference is considered significant; therefore, no one can say that one of them is the correct one. In order to approximate the results between the satellite imagery and the meteorological measurement, weather scientists have developed correction algorithms (Figure 3 and Figure 4). These algorithms are added to the data logger program in order to optimize its solar irradiation measurement.


The algorithm for solar position developed by J.J Michalsky, the clear sky model by Richard E. Bird and the subroutine “rotation” to rotate the RSR and track the solar position have been already written in the program of the data logger.
Those algorithms are based on numerous calculations and physical experiments [36]. Other models and algorithms are added to the data logger to improve solar measurement performance and accuracy. The first subroutine s added to adjust some factors in order to obtain realistic results. The second one is Vignola diffuse correction which aims to correct the amount of radiation received by the pyranometer because of certain meteorological disturbance and solar perturbations[31].
3.1Factor correctionThe air mass coefficient can be used to help characterize the solar spectrum after solar radiation has traveled through the atmosphere. The air mass coefficient is commonly used to characterize the performance of solar cells under standardized conditions [7].
The air mass is calculated based on the zenith angle of the sun Z (in radian):

The absolute air mass is calculated by multiplying the air mass value (1) by the product of the ratio between the atmospheric measured pressure P and the atmospheric pressure at sea level P0 which is 1013.25mbar.

Other corrections were applied in the algorithm called factor corrections in order to eliminate systematic errors.
An alternative formula to correct the spectral irradiance is the following:

Where AMp is pressure corrected air mass and (ln) is the natural logarithm.
The formula to correct the cosine response is

The diffuser on top of the Li-Cor is shaped to maintain a reasonable cosine response [8 and 21].
However, this shape results in the peak of responsivity decreasing sharply when the zenith angle reaches about 82°. This is known as the “Cat Ears” affect.
The Cat Ear correction factor is a function of zenith angle. For a zenith angle between 75° and 81° the correction factor is:

Where Z is the zenith angle. For the zenith angle between 81° and 83.2°, the correction factor is:

For all other values the Cat Ear correction factor is 1.
3.2Vignola Defuse CorrectionThe code has a purpose to correct the measured amount of radiation received by the pyranometer because of certain meteorological disturbance and solar perturbations. The code makes the corrections after the measurement [11].
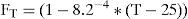
The diffuse measurement was corrected using a combination of two diffuse correction algorithms developed by Frank Vignola. For simplicity, the combined correction was called “The Vignola diffuse correction”. The Vignola diffuse correction modifies the uncorrected diffuse horizontal irradiance by a function of the uncorrected global horizontal irradiance. For GHIu values less than, or equal to, 865.2W/m2 we use Equation (7) to calculate the corrected diffuse horizontal irradiance (GHIc). For GHIu values greater than 865.2 W/m2equation (8) is used to calculate the “diffuse” (the corrected one). A formula for the Li-Cor sensor when the temperature rises above ambient equations was also added in this subroutine [17].
The diffuse corrections developed by F. Vignola and J. Augustyn for global values under 865.2kW/m2 the diffuse correction factor is [35, 37]:

Where: DHIc is the corrected diffuse horizontal irradiance, DHIu is the uncorrected diffuse irradiance, and GHIu is the uncorrected global data.
If GHIu is greater than 865.2kW/m2 then the diffuse correction factor is:

After that, we have to ensure that the value of the DNI is null at the time where the sun is set above the horizon which is technically a zenith angle of 90° (89.7333°). Therefore, the total existing radiation is the defused one [3].
Another correction is implemented in this algorithm provided by Li-Cor solar sensor data sheet.

Tr: Temperature rise of the pyranometer
The formula to correct for the temperature response of the Li-Cor is (T is the temperature of solar cell in Celsius):
And this is used directly in the equation of correction for the Li-Cor global data:
The same equation is used for the second pyranometer.
At night or in the darkness, the pyranometer sometimes gives a negative result; thus, a correction is recommended in order to obtain a realistic result [7, 11, 18, 31]. Hence, if the result is negative, the global horizontal irradiation is null.
In case of wrong measurements, an extra test sequence is added, just to be sure to have the accurate values: If the amount of the direct horizontal irradiation is greater than the global one that means that there are errors; therefore, the diffuse amount receives the global one.
Figure 5 shows the difference between the program before the correction and afterwards. The sattelite imagery irradiation measurement is also visualized in this curve.

Concerning the sattelite imagery, the used values are expressed in months; thus, the average of the daily solar irradiation is calculated for daily record then it is drawn in the curve constant until the next month.
An anemometer is installed in the data logger in order to measure the wind direction, the wind speed and the wind gust. Such data is important for a CSP plant, knowing that strong wind can harm the reflectors and it could cause several damages.
The anemometer algorithm was added to the program in order to measure the wind speed, wind gust and wind direction.
The anemometer algorithm works as follow: Primarily, a test is necessary to verify if the anemometer is installed or not. Once this test is positive, we can now measure the wind speed using “pulse count instruction”. At the second stage, a velocity calibration is needed in order to get the proper measurement, the formula is described in the sensor's datasheet.

Then the wind direction function is performed using “BrHalf ()”, mentioned above. For realistic and accurate values, the angle must be between 0° and 360°. Therefore, we have to subtract or add 360° if the measured value is out of this interval.
Technically, we can measure an additional entity using the same sensor: which is the wind gust (Figure 6).


Wind gust is the maximum wind speed measured during a specific period of time. The American Meteorological Society defines wind gust as a sudden brief increase in the speed of the wind. More specifically, the National Digital Forecast Database defines wind gust as the maximum 3-second wind speed (in knots or in m/s) forecast to occur within a 2-minute interval at a height of 10 meters [25].
4ConclusionThis assessment has provided the company team with necessary information on which to base development model scenarios to provide a broad roadmap for future project developments in addition to its main purpose which is building a solar thermal power plant in the Algerian desert.
The project does not stop here; another team will assess the economic feasibility as well as visit the site to contact the landlord and the Algerian Electricity distributer company. The four highest rank site candidates will be subject of study in solar irradiation after installing a meteorological station.
Regarding the second task, a lab test is necessary in a fixed irradiation source to see the difference between the program at the beginning and at its end. The auxiliary subroutines could help to make near the measured values of the weather station and the one captured by the satellite.