


This paper uses an artificial neural network (ANN) and resilient back-propagation (Rprop) training algorithm to determine the optical constants of As30Se70−xSnx (0≤x≤3) thin films. The simulated values of the ANN are in good agreement with the experimental data. The ANN models performance was also examined to predict the simulated values for As30Se67Sn3 which was not included in the training and was found to be in accordance with the experimental data. The high precision of the ANN models as well as a great guessing performance have been exhibited. Moreover, the energy gap Eg of As30Se70−xSnx (0≤x≤9) thin films were calculated theoretically.
The past few decades have seen rapid advances in the study of chalcogenide materials owing to their adequate amorphous semiconducting features (Singh, 2012). Several researchers have studied these materials as they have a wide range of unique thermal, electronic and optical properties (Aggarwal & Sanghera, 2002; Fayek, Fouad, Balboul, & El-Bana, 2007; Fouad, El-Shazly, Balboul, Fayek, & El-Bana, 2006; Fouad, El-Bana, Sharma, & Sharma, 2015; Laine & Seddon, 1995; Owen, Firth, & Ewen, 1985; Saiter, Hamou, & Vautier, 1994; Seddon, 1995; Singh, 2012). Optical properties of chalcogenide glasses have attracted significant attention due to their remarkable applications in optoelectronics and many other technological fields, particularly, in the area of thin films (Andriesh & Iovu, 2006; El-Bana, Bohdan, & Fouad, 2016; Iovu et al., 2007). The optical properties of arsenic selenide glassy system are greatly influenced by the effect of changing its chemical composition. Adding tin to As2Se3 has considerable changes in both the transmission spectra and the refractive index (Fouad et al., 2006). The optical parameters for the studied As–Se–Sn amorphous system have been estimated earlier (Fouad et al., 2006) using the well-known Swanepoel method (Swanepoel, 1984) and the Wemple–DiDomenico model (Wemple, 1973; Wemple & DiDomenico, 1971). The optical band gaps for the studied compositions are also determined using the non-direct transition model proposed by Tauc's extrapolation method (Tauc, Grigorovici, & Vancu, 1966). The obtained parameters gave a clear idea about the changes in bonding arrangement due to tin addition, which affects the optical behavior of the As2Se3 amorphous system (Fouad et al., 2006).
The artificial neural network as program embedded in MATLAB software has been used to simulate our data. Artificial neural networks (ANNs) are biologically inspired computer programs intended to emulate the way in which the human brain processing information. These programs are mainly used in areas involving pattern mapping and pattern classification such as visual images and speech recognition, especially they solve lots of problems that may arise in other conventional techniques. Recently, a great deal of attention has been paid to use such fascinating networks in solving many problems that encounter physicists due to lack of facilities. Developments in ANNs and their applications to physics have made it feasible to model numerous relations in different areas in physics (Attia, El-Nahass, El-Bakry, & Habashy, 2013; Bourouis, Meddour, & Moussaoui, 2006; Darwish et al., 2015; El-Bakry, 2003, 2004; El-Metwally, Haweel, & El-Bakry, 2000; Haweel, El-Bakry, & El-Metwally, 2003). The ANNs architecture is inspired by the structure of the human brain, which is not quite the same as the PCs utilized today (Tabet & McGahan, 2000).
In the present work, the artificial neural networks and the resilient backpropagation (Rprop) algorithm are combined to estimate the refractive index n(λ) and the absorption index k(λ) as a function of As30Se70−xSnx thin films composition (value of x). Prediction of the simulated values of n(λ) and k(λ) for composition (x=3) that not included in the network training was also achieved. Moreover, the artificial neural networks have enabled us to get one numerical equation which depict the spectral behavior of both n(λ) and k(λ). Besides, the energy gap Eg of As30Se70−xSnx (0≤x≤9) thin films were calculated theoretically.
2Experimental detailsThe amorphous nature of As30Se70-xSnx (0≤x≤3) compositions as well as their thin films were verified firstly by X-ray diffraction (XRD) technique, type (Pw1710) (Balboul, Fouad, Fayek, & El-Bana, 2008). The choice of these three compositions renders to the fact that adding Sn to As30Se70 with a percent more than 3.5% would affect the amorphous nature of the studied compositions. Therefore, in the experimental part we have varied Sn till 3%. Thin films of our amorphous alloy of thicknesses about 500nm were deposited on cleaned glass substrates by thermal evaporation technique at (∼10−4Pa) base pressure. The film thickness was controlled by the thickness monitor and was confirmed by using the Fizeau interferometric technique. This technique uses an optical arrangement together with interferometric principle (Fouad et al., 2006). Moreover, interference pattern have been observed in the transmittance spectra which confirms that the surface of the film is of good optical quality and the film thickness is homogeneous. Morphology and composition analysis of the alloys and their thin films were checked using scanning electron microscope (SEM) and energy dispersive spectrometry (EDS) respectively. The optical transmittances of our thin films were measured at room temperature using a double beam UV–vis–NIR spectrophotometer in the wavelength range (200–1100nm). The optical constants n(λ) and k(λ) of our films have been determined using Swanepole technique (Swanepoel, 1984). Our earlier work (El-Bana & Fouad, 2017; El-Bana et al., 2016; Sharma, El-Bana, Fouad, & Sharma, 2016) and various other researchers (Márquez, González-Leal, Jiménez-Garay, Lukic, & Petrovic, 1997; Sharma, Sharda, Sharma, & Sharma, 2014) have used this technique to estimate the optical parameters for chalcogenide glasses. The determined values of n and k for all films were found to lie within the range of the experimental error ±2% for n and ±5% for k (Fouad et al., 2006).
3Artificial neural networks ANNsThe architecture of neural network has a number of layers (input, output, and hidden layers) that involve a number of nodes (neurons) cf., Fig. 1. These nodes in different layers are connected to each other through links named as weights. The artificial neurons are the processing units of the network as can be seen in Fig. 2.

; and f(a)=activation function (∑all inputsWnXn).")
Basically, training is considered as the main operating phase of the neural network. The training of networks includes adjusting weights and bias until the performance of networks becomes adequate. Resilient back-propagation algorithm (Rprop) is considered as one of the fastest training for artificial neural networks. The importance of (Rprop) is to eliminate the harmful effects of the magnitudes of the partial derivatives caused by the logsig transfer functions (the sigmoid functions) when applied to the output (a) shown in Fig. 2. The partial derivative refers to the derivative of the performance function with respect to the weights. The sign of the derivative is the factor used in determining the direction of the weight update not the magnitude of the derivative itself. A separate update value is used in determining the size of the weight change. When the derivative of the performance function with respect to that weight has the same sign for two successive iterations, an increase by a factor in the update value for each weight and bias is obtained. Whereas, a decrease by a factor in the update value is obtained, whenever the derivative with respect to weight changes sign from the previous iteration. Furthermore, the update value remains the same when the derivative equals zero. Whenever the weights are oscillating the weight change will be reduced. If the weight continues to change in the same direction for several iterations, then the magnitude of the weight change will be increased (Kişi & Uncuoğlu, 2005). For a deeper understanding of the resilient backpropagation algorithm see (Riedmiller & Braun, 1994).
3.1Modeling the optical constants using ANN modelA neural network is a powerful computational model that able to simulate and predict complex input/output relationships. In this technique, we attempted to mathematically model the optical constants n(λ) and k(λ) using ANNs. In this regard, two different ANN models (ANN I and ANN II) are designed to achieve this goal. A simplification of the proposed ANN models is presented in Fig. 3.

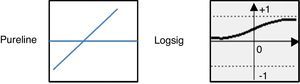
The first model (ANN I) calculates and predicts the values of refractive index, n, as a function of wavelength, λ. Whereas, the second model ANN II calculates and predicts the values of extinction coefficient, k, as a function of wavelength λ. The ANN I model has five hidden layers of 260, 210, 180, 200 and 220 neurons, while the second model (ANN II) has five hidden layers of 20, 10, 10, 15 and 25 neurons. The transfer functions of these hidden layers were chosen to be logsig, while the output to be pureline as explained in Appendix A.
4Results and discussionNeural networks were trained simultaneously using experimental data of refractive index n(λ) of As30Se70−xSnx thin films for three different compositions (x=0, 1, 2) (Fouad et al., 2006). Fig. 4 shows the training procedure which reveals that the mean squared error of the network starting at a large value and diminishing to reach a best value of 1.1297×10⁻⁵ after 90 epochs; where epochs means the number of training. Reaching this stage confirms that the network has been learnt. The obtained equation that represents the refractive index n is given in Appendix A.

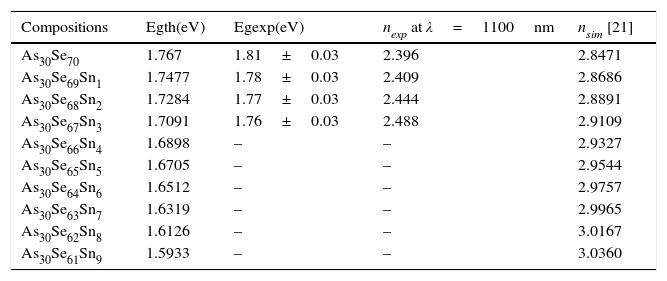
The simulation results of refractive index n(λ) of As30Se70−xSnx (x=0, 1, 2) thin films together with the corresponding experimental data are depicted in Fig. 5. It is clearly observed that the measured curves and the curves achieved by ANN are in good agreement. This denotes that the trained network adopt optimal generalization performance. The dispersion curve of refractive index n shows normal dispersion at λ>700nm with value of (n=2.396) at (λ=1000nm) for composition (x=0). The n value was found to increase with increasing value of x at the same wavelength λ can be seen in both Fig. 5 and Table 1.
 of As30Se70−xSnx thin films for different compositions (x=0, 1, 2).")
Optical refractive indices n and energy gap Eg of As30Se70−xSnx thin films for different compositions.
| Compositions | Egth(eV) | Egexp(eV) | nexp at λ=1100nm | nsim [21] |
|---|---|---|---|---|
| As30Se70 | 1.767 | 1.81±0.03 | 2.396 | 2.8471 |
| As30Se69Sn1 | 1.7477 | 1.78±0.03 | 2.409 | 2.8686 |
| As30Se68Sn2 | 1.7284 | 1.77±0.03 | 2.444 | 2.8891 |
| As30Se67Sn3 | 1.7091 | 1.76±0.03 | 2.488 | 2.9109 |
| As30Se66Sn4 | 1.6898 | – | – | 2.9327 |
| As30Se65Sn5 | 1.6705 | – | – | 2.9544 |
| As30Se64Sn6 | 1.6512 | – | – | 2.9757 |
| As30Se63Sn7 | 1.6319 | – | – | 2.9965 |
| As30Se62Sn8 | 1.6126 | – | – | 3.0167 |
| As30Se61Sn9 | 1.5933 | – | – | 3.0360 |
The refractive index n(λ) of As30Se67Sn3 film was predicted using the ANN I model and was represented together with the corresponding experimental data in Fig. 6. This composition was not included in the neural network training for modeling the refractive indices. Comparing curves shown in Fig. 6 demonstrates that the measured curve and the curve computed by ANN I are almost superimposed. In the same trend, the n value of (n=2.488) was found to increase with increasing value of x at (λ=1100nm) which gives a good impression of the network performance.
 by ANN model altogether with the experimental data of As30Se67Sn3 thin film which is not included in the network training.")
Neural network modeling for absorption index k(λ) was also achieved to complete determination of the optical constants of As30Se70−xSnx thin films. We followed the same approach that has been applied in case of modeling the refractive indices. Neural networks were trained simultaneously using experimental data of absorption index k(λ) of As30Se70−xSnx thin films for three different compositions (x=0, 1, 2). Fig. 7 presents the network performance, which reveals that the mean squared error of the network begun at a large value and decreased reaching to a best value of about 2.06×10⁻⁵ at 700 epochs. Again, these results have confirmed that the network has been learnt. In addition, the obtained equation that represents the extinction coefficient k is given in Appendix A which is the same for the refractive index n. This consistency obeys the approach of Kramers–Kronig (KK) model.

The simulation results of absorption index k(λ) of As30Se70−xSnx thin films together with the corresponding experimental data are represented in Fig. 8. The obtained curves reveal that the results of absorption indices based on ANN II are in good agreement with their corresponding experimental data. The absorption index k decreases as a function of wavelength λ and reaches to zero value at about 700nm for a composition of (x=0). This cutoff value of k decreases with increasing the value of x in the composition.
 compared to experimental data of As30Se70−xSnx thin films for different compositions (x=0, 1, 2).")
Another testing was carried out to confirm the validity of our network performance, which is the prediction of absorption index k(λ) of As30Se70−xSnx thin films for composition (x=3). The one that was not included in the neural network training for modeling the absorption indices. Fig. 9 presents the predicted results of k(λ) for composition (x=3) which generated from ANN model in addition to the corresponding experimental data. A slight difference between the measured and predicted values, especially at wavelength <600nm with maintaining the same behavior has been observed.
 by ANN model and experimental data of As30Se70−xSnx thin films for composition (x=3) which is not included in the network training.")
The observed decrease in the refractive index, n, and the extinction coefficient, k, with the increase in wavelength may be correlated with the increase in the transmittance and decrease in the absorption coefficient. Building on obtained results, it is easy to get the dispersion parameters and energy gaps for different compositions of As30Se70−xSnx thin films using the simulation results of n(λ) and k(λ) respectively. The simulation results of n(λ) and k(λ) generated from ANN model showed almost exact fitting to the corresponding experimental data, which is not available through the other conventional theoretical techniques. This gives the ANN the facilities of wide usage in modeling of numerous relations in different areas in physics.
To overcome the unavailability of compositions (4≤x≤9) of As30Se70−xSnx thin films, energy gaps were calculated theoretically for compositions (0≤x≤9) and tabulated in Table 1. The band gap for the compositions under investigations has also been calculated theoretically using the formula (Sharma, Tripathi, & Barman, 2008)
where a, b, and c are the elements volume fractions, and Eg(As)=1.2eV, Eg(Se)=2.01eV, and Eg(Sn)=0.08eV (Strehlow & Cook, 1973) are the optical gaps of elements.
For comparison, the measured energy gaps through absorption data were also included in Table 1. Furthermore, the experimental data of nexp, and the simulated ones nsim generated from both the present work and study performed by Attia et al. (2013) of the refractive indices of As30Se70−xSnx thin films were also included in Table 1. The values of nsim shown in the fourth column of Table 1 were predicted using method based on ANN which is described (Attia et al., 2013) for energy gap values given in the second column. These predicted values of n are in visible light at normal dispersion.
5ConclusionThe following conclusions can be drawn from the present analysis that used an artificial neural network (ANN) to understand the effect of Sn addition on the optical constants characterization of As30Se70−xSnx (0≤x≤3) thin films:
- •
Both experimental and simulated values are found to be in good agreement.
- •
The physical interpretation of the ANN model performance for predicting the simulated values of n(λ) and k(λ) for As30Se67Sn3 thin film is in accordance with the experimental data.
- •
It is clear from the calculated results that the high precision of ANN model gives a great performance for optical constants and related parameters as well and gives the ANN the merits of wide usage in modeling of other relations in different areas in physics.
The authors have no conflicts of interest to declare.
The equation which describes both n(λ) and k(λ) of As30Se70−xSnx thin films for different compositions is given by:
n or k=pureline[net.LW{6,5}logsig(net.LW{5,4}logsig(net.LW{4,3}logsig(net.LW{3,2}logsig(net.LW{2,1} logsig(net.IW(1,1}T+net.b{1})+net.b{2})+net.b{3})+net.b{4})+net.b{5})+net.b{6}]
where
T is the input (λ)
net.IW {1, 1} is linked weights between the input layer and first hidden layer,
net.LW {2, 1} is linked weights between first and second hidden layer.
net.LW {3, 2} is linked weights between the second and third hidden layer,
net.LW {4, 3} is linked weights between the third and fourth hidden layer,
net.LW {5, 4} is linked weights between the fourth and fifth hidden layer,
net.LW {6, 5} is linked weights between the fifth and output layer,
net.b{1} is the bias of the first hidden layer,
net.b{2} is the bias of the second hidden layer
net.b{3} is the bias of the third hidden layer,
net.b{4} is the bias of the fourth hidden layer
net.b{5} is the bias of the fifth hidden layer, and
net.b{6} is the bias of the output layer
Peer Review under the responsibility of Universidad Nacional Autónoma de México.