


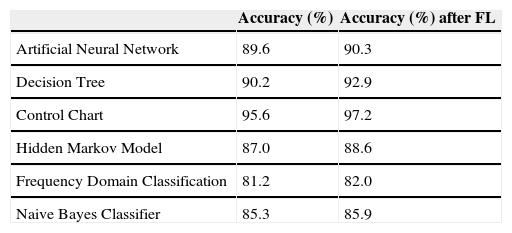
In recent years, video surveillance and monitoring have gained importance because of security and safety concerns. Banks, borders, airports, stores, and parking areas are the important application areas. There are two main parts in scenario recognition: Low level processing, including moving object detection and object tracking, and feature extraction. We have developed new features through this work which are RUD (relative upper density), RMD (relative middle density) and RLD (relative lower density), and we have used other features such as aspect ratio, width, height, and color of the object. High level processing, including event start-end point detection, activity detection for each frame and scenario recognition for sequence of images. This part is the focus of our research, and different pattern recognition and classification methods are implemented and experimental results are analyzed. We looked into several methods of classification which are decision tree, frequency domain classification, neural network-based classification, Bayes classifier, and pattern recognition methods, which are control charts, and hidden Markov models. The control chart approach, which is a decision methodology, gives more promising results than other methodologies. Overlapping between events is one of the problems, hence we applied fuzzy logic technique to solve this problem. After using this method the total accuracy increased from 95.6 to 97.2.
Most of the current monitoring systems use multiple cameras and human operators to detect unexpected scenarios because in realistic applications it is difficult to monitor a large target area at once and difficult to tract moving objects over a long period of time. Considerable research has been performed on scenario recognition, including many approaches that can be distinguished in terms of
- •
2 dimension or 3 dimension
- •
single camera or multiple camera
- •
static camera or dynamic camera
- •
offline or online
In recent years, several models based on finite state machines have been widely used in speech recognition, natural language processing, sign language and scene analysis [1]. Using one camera, Hongeng et al. [2] have recognized a sequence of several scenarios, called a multi-state scenario, using Bayesian network and Hidden Markov models (HMMs). Hamid [3] tracks objects with color and shape-based particle filters, to extract features, and applies dynamic Bayesian networks to recognize events. Yamato [4] describes a new human behavior recognition algorithm based on HMMs; a sequence of frames is converted to a feature vector and converted again to a symbol sequence by vector quantization. HMMs are trained, and the model that matches the event best is selected. Parameterized HMMs and coupled HMMs have been used to detect complex events such as the interaction between two moving objects.
For robust detection, successful feature extraction is essential. The most useful features in human tracking detection are found to be the width, height, color histogram and velocity. Chowdhury [5] experimented with detection of normal and abnormal events at an airport and proposed a method to represent the activity of a dynamic configuration of objects through the shape formed by the trajectories of these objects. Object activities are represented as points on the 2D ground plane. Amer [6] has worked on detection of events such as walking, sitting, and standing, using simple objects and clutter such as trees blowing in the wind and moving shadows. Davis [7] has worked on reliable recognition of basic activities from the smallest number of video frames. He used probabilistic methods to detect simple activities such as walking, running and standing. Many other papers also address simple scenario recognition based on probabilistic methods. In this area, most of the research is related to high level processing; some of them used rule-based methods [8–12, 13], and others probabilistic methods [7, 14, 15].
One of our approaches is different from the above methods currently in use. We use a rule-based system to categorize detected human activity in various classes, where the rules are obtained by control chart analysis. In essence, we treat the problem as analogous to controlling a manufacturing process. A process in control is analogous indicates that the tracked object is transitioning from one sub-scenario to another.
2Low-level processingA system for robustly tracking object is used for the indoor surveillance application. Background subtraction has been implemented to detect foreground objects associated with regions that exhibit small changes over time. We adopt a luminance contrast method to reduce the side-effect of background subtraction, for two reasons:
- 1.
It saves computational effort by using just one channel in color images.
- 2.
It removes much of the noise caused by luminance variations.
The original RGB space images from video camera are transformed to YUV coordinates. Null luminance values result in infinite contrast values that have no physical meaning, hence such values are changed to 1s. Values near zero are expected for background pixels, with larger values for brighter pixels.
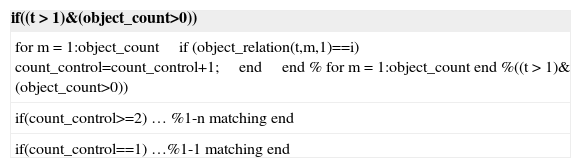
A standard background subtraction method is used to extract the silhouette of the moving object. To implement this, the mean and the standard deviation of each pixel are computed in a series of images without any person. Then, a pixel is considered as belonging to a moving object if the difference between the mean and the current value of that pixel is higher than a certain threshold that depends on the standard deviation. The background is updated for each new image by recalculating the mean and standard deviation at all pixels. Table 1 shows psedecode for 1-1 and 1-N object tracking.

In the work reported in this paper, we utilized a successive refinement strategy for object tracking. First, we applied a motion detection algorithm to locate the region in space containing a moving object. Then, the dynamic template representing changing image frames is matched in search regions to further localize object position accurately. We used an infinite impulse response (HR) filter to update the template. Once a best correlation match at the search block in current frame is found, it is merged with a previous template through an IIR filter to produce a new template for tracking in subsequent frames [16,17].
3High-level processing3.1Decision tree
At the simplest level we came up with raw rules looking at the data itself. The data consists of features measured and quantized from the low level detection of the moving object. We use features such as aspect ratio of the object, velocity and relative upper density of pixels to put the object in one of the 5 basic pattern classes. We try to quantify the measured features in linguistic descriptors rather that absolute figures and measures. Again the rules were manually generated based on a study of the data. The performance was honed by adjusting the membership functions of the various features as per performance of the rules on several test sets of data.
We applied the C5 algorithm to the data to evolve a set of classification rules. The algorithm is a gain based decision tree learner. It decides which quantity in the input has the most effect on its classification. The use of C5 algorithm greatly improved the performance in terms of classification correctness.
3.2Frequency domain classificationCertain times we see that all information may not be directly obtained from the time domain. We may be able to extract patterns from a frequency domain representation of the signal. We investigated therefore, methods to classify the events based on a frequency spectrum of the measured quantity. This rests on the assumption that spectra representative of particular events actually are very characteristic of aspect ratios of moving objects, which were taken as ‘characteristic’ spectra, based on the observation of spectra of several such data sets known to contain these events.
Primarily, we were able to discern patterns in a Fourier representation of time series of the aspect ratio of the moving object. For these pattern classes, we found that while spectrum based classification was very accurately able to differentiate between the spectra of objects in motion and not in motion and between events where the object was not in motion the spectra are sufficiently similar to cause misclassifications.
Frequency spectrum based classification could be of further use when low level processing improves to a point to give use several more features from the moving object. More features must be extracted from the spectral data. Spectrum classifications will again be considered when we increase the number of events to be detected and the types of the moving objects.
3.3Neural network-based classificationWe tried various neural networks based classification methods. The best performance measure was achieved by using 5 separated multilayer perceptron modules, trained by backpropagation. The one network object was associated with each of the events. The output of a network module was a 0 or 1 depending on whether that particular event is represented by the data at the network input.
Finally the outputs of each of the networks were considered and the output closest the 1 was chosen as the class, which the data belonged to. The multi module backpropagation performed well on the controlled test data, approaching accuracy of over 85% for videos containing 2 or more events.
3.4Control chart approachA control chart is a tool for process monitoring, providing a popular method for quality control in manufacturing engineering. Each control chart indicates the variation in the values of some feature over time, with graphical depiction of the upper and lower control limits for that feature. There are two main parts in the high level detection by control charts: the identification of an activity or sub-scenario, and the recognition of when the activity begins and ends. Each control chart is constructed using the following procedure for each feature fj. The means and standard deviations of fj values are first computed for all three classes to be discriminated, using the available training data. Then, for each class ci, the upper and lower bounds associated with the control chart are obtained, using the equations [1]


Appropriate values for each coefficient αfj,ci are found using an iterative improvement approach.

Each feature's control chart thus suggest that an object be placed into one of the classes; since we use four features, this results in 4 dimensional vector whose components indicate the class in which an object is placed according to each control chart. For example, the tuple [standing, standing, standing, bending] indicates that the first three features place the object into the ‘Standing’ class whereas the last feature's control chart places it in the ‘Bending’ class. Final classification uses the majority rule applied to such a vector, so that the above example would be placed in the ‘Standing’ class.
4Fuzzy logic in interval framesA description of the sort of results given by the various methods used for classification. A sequence of video frames may contain one or more of the following events: walking, standing, bending, running and sitting. Fuzzy logic is based on clustering, if an object belongs to cluster A or not. If the object is member of cluster which expressed with “1”, otherwise with “0”. In fuzzy logic every object has a degree of membership, and this degree is between 0 and 1 [18,19].
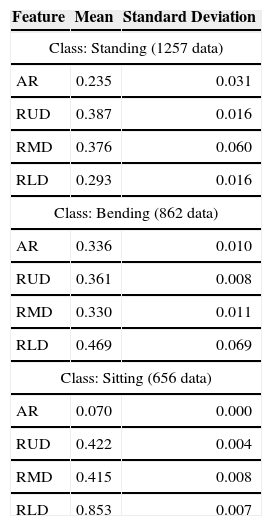
In this part we will discuss experimental results in different methods. In testing videos we have following events: walking, standing, bending, running and sitting. In figure 4, we show that two video sequences with fuzzy part in decision. In video scenario recognition it is difficult to decide event in some of the frames using standard methods. We used fuzzy logic method to solve this problem. In experiment part we used 3 different video sequences with 5124 frames. Table 2 gives statistical result of the data.

Mean and standard deviation values of training data.
| Feature | Mean | Standard Deviation |
|---|---|---|
| Class: Standing (1257 data) | ||
| AR | 0.235 | 0.031 |
| RUD | 0.387 | 0.016 |
| RMD | 0.376 | 0.060 |
| RLD | 0.293 | 0.016 |
| Class: Bending (862 data) | ||
| AR | 0.336 | 0.010 |
| RUD | 0.361 | 0.008 |
| RMD | 0.330 | 0.011 |
| RLD | 0.469 | 0.069 |
| Class: Sitting (656 data) | ||
| AR | 0.070 | 0.000 |
| RUD | 0.422 | 0.004 |
| RMD | 0.415 | 0.008 |
| RLD | 0.853 | 0.007 |
One of the problems in frame-based recognition is making decision in passing frames from one event to another. We solved this problem using Fuzzy Logic. After using this method in overlapping areas especially between ending and beginning of the events increased the total accuracy from 95.6 to 97.2 for simple events such as sitting, walking, jumping, bending, etc.
One of the problems in frame-based recognition is making decision in passing frames from one event to another. We solved this problem using Fuzzy Logic. After using this method in overlapping areas especially between ending and beginning of the events increased the total accuracy from 95.6 to 97.2 for simple events such as sitting, walking, jumping, bending, etc.
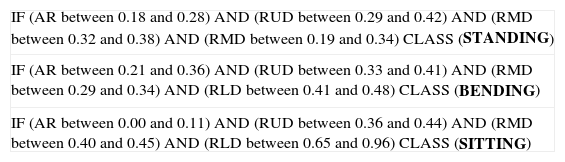
5Experimental resultsOne of the good performance given by the C5 learner was a classification efficiency 92% for frames representing 3 events namely standing, walking and bending. Input supplied were height/width of the object, aspect ratio and RUD. In table 3 extracted rules after using control chart with fuzzy logic has been given.
Some of the extracted rules in interval frames.
| IF (AR between 0.18 and 0.28) AND (RUD between 0.29 and 0.42) AND (RMD between 0.32 and 0.38) AND (RMD between 0.19 and 0.34) CLASS (STANDING) |
| IF (AR between 0.21 and 0.36) AND (RUD between 0.33 and 0.41) AND (RMD between 0.29 and 0.34) AND (RLD between 0.41 and 0.48) CLASS (BENDING) |
| IF (AR between 0.00 and 0.11) AND (RUD between 0.36 and 0.44) AND (RMD between 0.40 and 0.45) AND (RLD between 0.65 and 0.96) CLASS (SITTING) |
The best classification achieved by a neural network was with the multi module backpropagation neural network. Other networks were considered too including single module version of the radial basis network, multilayer perceptron and LVQ networks. The classification accuracy of the new algorithm, control chart is 95.7%. The performance of the control chart method, for determining the end of one sub-scenario and the beginning of another.
6ConclusionWe presented several algorithms which are used in scene analysis. There is a new approach, control chart, developed to classify events and recognize scenarios using statistical methods. Our system correctly detects activities and transitions between them with promising result. Our future aim is to modify current algorithm to complex scenarios and online applications
I would like to thank Prof. Pramod Varshney from Syracuse University for data set.