This study is concerned with the replenishment-shipment decision for a multi-customer finite production rate (FPR) model with quality assurance and discontinuous deliveries. We consider that a product is manufactured by a producer and all items are screened for quality control purpose. Nonconforming items will be picked up and categorized as scrap or repairable items. The reworking will be done right after the regular production in each replenishment cycle. After the entire lot is quality assured, multiple shipments will be delivered synchronously to multi-customer in each cycle. Each customer has its own annual product demand, unit stock holding cost, as well as fixed and variable product delivery costs. Mathematical modeling along with Hessian matrix equations is employed to solve the proposed model. A closed-form optimal replenishment-shipment policy for such a specific integrated FPR model is obtained. A numerical example is provided to show the practical applicability of the obtained results.
This paper examines a multi-customer finite production rate (FPR) model incorporating the quality assurance and a discontinuous product delivery policy. The FRP model [1–2] was first introduced to assist manufacturers in determining the most economic production lot size that minimizes the long-run average production-inventory cost. Finite production rate model assumes implicitly that all items produced are of perfect quality. In real life production settings, however, due to various unpredictable factors it is inevitable to produce defective items randomly [3–8]. Certain nonconforming items sometimes can be reworked and repaired to meet the expected standard of product quality as well as to reduce overall production-inventory costs [9–13].
The classic FRP model considers a continuous inventory issuing policy. However, in real world situations, the multi-delivery (or discontinuous) policy is commonly adopted by the vendor to transport finished products to its customer [14–20].
Moreover, in real life supply chains environments, we often have a vendor who manufactures a product and supplies it to customers in different locations. The management of such an integrated supply chains system would be anxious to know what the best production-shipment policy will be in order to minimize the total system costs. Schwarz [21] studied a one-warehouse N-retailer deterministic inventory system with the objective of determining the stocking policy that minimizes the long-run average system cost per unit time. The optimal solutions along with a few properties are obtained for such a one-retailer and N identical retailer problems. Heuristic solutions for the general problem were also suggested. Banerjee and Banerjee [22] developed an analytical model for a coordinated, order-less inventory system for the single product, single vendor, and multiple purchasers. Such a system was made practical in electronic data interchange (EDI) at the time, for the exchange of information between trading partners. On the basis of the potential benefits of this technology, they proposed a common cycle replenishment approach, where the supplier alone makes all replenishment decisions, without ordering on the part of the customers. Their model and concepts were demonstrated by a simple numerical example and concluded that EDI-based inventory control can be attractive from the economic, as well as other standpoints. Lu [23] considered a one-vendor multi-buyer integrated model with the objective of minimizing a vendor's total annual cost, subject to the maximum costs that buyers may be prepared to incur. The buyer's annual demand and previous frequency of order are assumed to be known information in this model. As a result, an optimal solution for the one- vendor one-buyer case was obtained; a heuristic approach for the one-vendor multi-buyer case was also provided. Woo et al.[24] considered an integrated inventory system where a single vendor purchases and processes raw materials in order to deliver finished items to multiple buyers. The vendor and all buyers are willing to invest in reducing the ordering cost (e.g., establishing an electronic data interchange based inventory control system) in order to decrease their joint total cost. An analytical model is developed to derive the optimal investment amount and replenishment decisions for both vendor and buyers. The exponential ordering cost function is then applied to their general model, and a numerical analysis is performed to provide interesting insights of the model. Numerical results show that the vendor and all the buyers can benefit directly from substantial cost savings by this ordering cost reduction investment. Yao and Chiou [25], considered an integrated supply chain model in which one vendor supplies items for the demand of multiple buyers. The objective of their model was to minimize the vendor's total annual cost subject to the maximum cost that the buyer may be prepared to incur. They explored the optimality structure of this integrated model and asserted that the optimal cost curve is piece-wise convex. Theoretical results on the breakpoints of the optimal cost curve provide useful insights that supported the design of their search algorithm. Numerical experiments demonstrated that their search algorithm is very efficient for it out-performs other heuristics, and it secures the global optimal solution for each of their 20 experimental problems. Yang and Lo [26] considered a problem of determining a suitable policy of inventory and purchasing management, with the objective of minimizing total expected inventory costs with multiple partners under controllable lead time. Many studies that addressed various aspects of supply chain issues have also been extensively carried out recently [27–35].
This paper determines the joint optimal production lot size and number of deliveries that minimizes the long-run expected system cost for such an integrated multi-customer FPR model with quality assurance and discontinuous delivery policy. Because little attention has been paid to this area, this paper is intended to bridge the gap.
2Problem description, modeling, and formulationsThis paper studies a multi-customer finite production rate model with quality assurance and discontinuous deliveries. Consider a product that can be made by a vendor at an annual production rate P and during the production process an x portion of nonconforming items may randomly be generated at a rate d. All items made are screened and inspection cost is included in the unit production cost C. Nonconforming items will be categorized as scrap or repairable items. The reworking will be done right after the regular production in each replenishment cycle at a rate of P1. Under the normal operation assumption, to avoid shortages from occurring the constant production rate P must satisfy (P-d-λ)>0, where λ is the sum of annual demands of all customers (individual demand rate is λi each), and d can be expressed as d=Px. Unlike the FPR model assumes a continuous inventory issuing policy for satisfying demand, this study considers a discontinuous delivery policy. Specifically speaking, after the entire lot is quality assured in the end of rework process, fixed quantity multiple shipments of finished items are delivered synchronously to multi-customer at a fixed interval of time during the downtime t3 in each cycle (refer to Figures 1 and 2).


Cost parameters used in this study are as follows: The unit production cost C, unit holding cost h, production setup cost K, unit disposal cost CS, unit cost CR and unit holding cost h1for each reworked item, the fixed delivery cost K1i per shipment delivered to customer i, unit holding cost h2i for item kept by customer i, and unit shipping cost CTi for item shipped to customer i. Additional notation used in this study includes:
θ = a portion of nonconforming items that is categorized as scrap items,
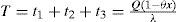
T = production cycle length,
Q = production lot size per cycle, a decision variable,
n = number of fixed quantity installments of the finished batch to be delivered to retailers for each cycle, a decision variable,
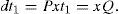
t1 = the production uptime for the proposed system,
t2 = time required for reworking the nonconforming items produced in each cycle,
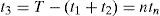
t3 = time required for delivering all quality assured finished products to retailers,
tn = a fixed interval of time between each installment of finished products delivered during production downtime t3,
H1 = level of on-hand inventory in units when regular production process ends,
H = maximum level of on-hand inventory in units when the rework process ends,
m = number of retailers,
I(t) = vendor's on-hand inventory of perfect quality items at time t,
I d(t) = vendor's on-hand inventory of defective items at time t,
Ic(t) = customers' on-hand inventory at time t,
TC(Q,n) = total production-inventory-delivery costs per cycle for the proposed system,
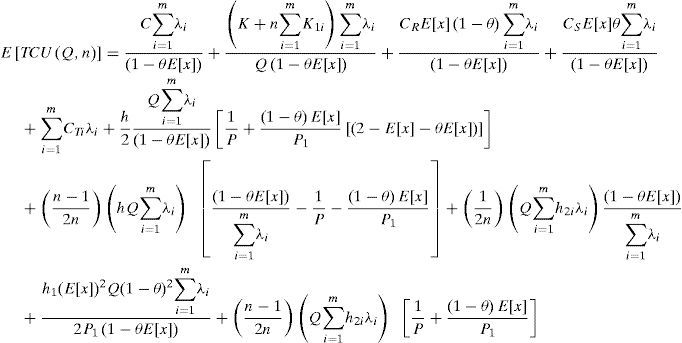
E[TCU(Q,n)] = total expected production-inventory-delivery costs per unit time for the proposed system.
From Figures 1 and2, we directly obtain the following equations:


The on-hand inventory of defective items during uptime t1 is (see Figure 2)
Delivery cost of the ith shipment to m customers is
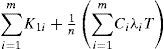
Total delivery costs for n shipments in n are:
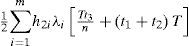
Vendor's variable holding costs for finished products kept during t3 where n fixed- quantity installments of the finished batch are delivered to customers at a fixed interval of time, are as follows [35].

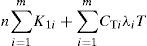
Customers' total stock holding costs during a cycle are (see Figure 3 and Appendix A for details).

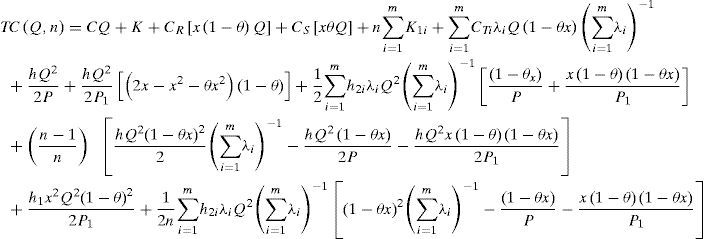
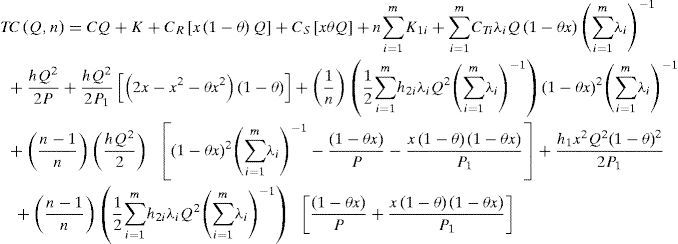
TC(Q,n) consists of the production setup cost, variable production cost, cost for the reworking, disposal cost, the fixed and variable delivery cost, vendor's holding cost in uptime t1 rework time t2, and delivery time t3, and customers' holding costs as follows:
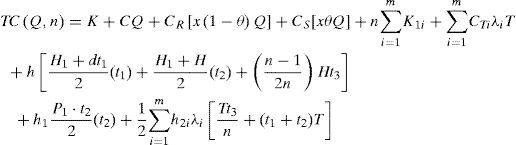
Taking into account the randomness of defective rate, we can use the expected values of x in cost analysis of this study. Substituting all parameters from Equations 1 to 12 in TC(Q,n) and with further derivations, E[TCU(Q,n)] can be obtained as (please refer to Appendix B for details).
3Derivation of the optimal policy3.1Proof of convexity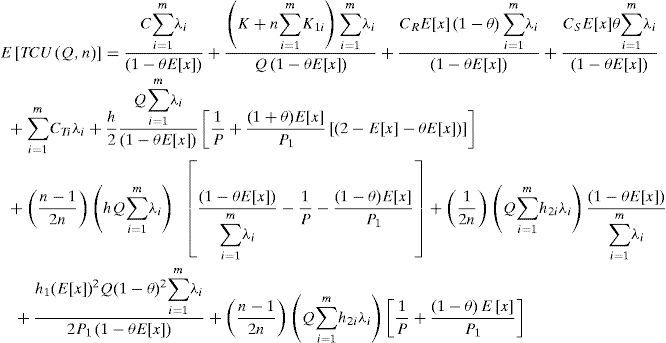
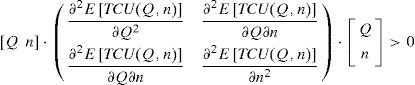
This study employs the Hessian matrix equations [36] here to prove the convexity of E[TCU(Q,n)]. That is to verify whether the following equation holds:
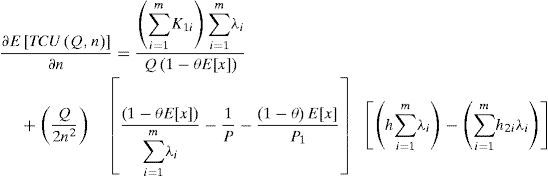
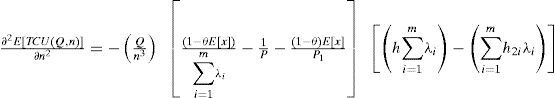
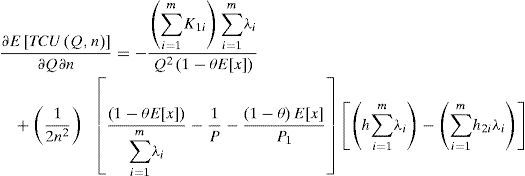
Applying differentiation to Equation 14 we obtain
Substituting Equations 17, 19 and 20 in Equation 15 we have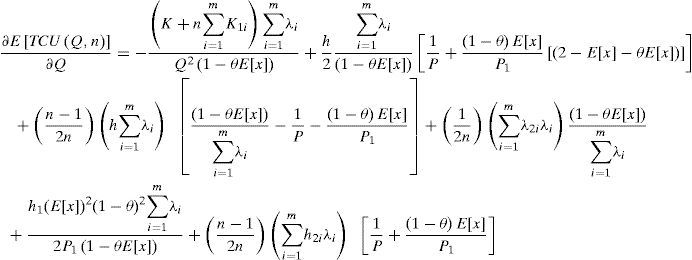
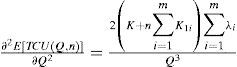
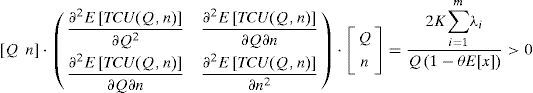
Equation 21 resulted positive, because K,λ, Q, and (1-θE[x]) are all positive. Hence, E[TCU(Q,n)] is a strictly convex function for all Q and n different from zero. Hence, we know that there is a minimum of E[TCU(Q,n)].
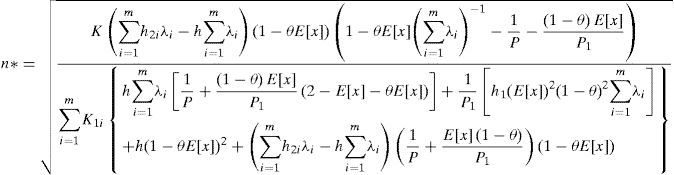
3.2The optimal replenishment-shipment policyTo jointly determine the optimal replenishment-shipment policy for the proposed multi-customer FPR model, we can solve the linear system of Equations 16 and 18 by setting these partial derivatives equal to zero. With further derivations we have the optimal lot size Q* and optimal number of delivery n* as follows:
and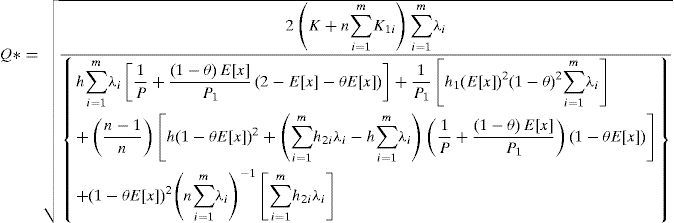
As we can see, in a real-life situation the number of deliveries n can only be an integer value. In order to determine the integer value of n* that minimizes the expected system cost, two adjacent integers to n must be examined respectively [31]. Let n− denote the largest integer less than or equal to n and n+ denote the smallest integer greater than or equal to n (as was derived from Equation 23. Substitute n+ and n− respectively in Equation 22 and then applying the resulting (Q, n+) and (Q, n−) in Equation 14 respectively. By selecting the one that gives minimum long-run average cost as the optimal replenishment- distribution policy (Q,*, n*). A numerical example is provided next to show the practical applicability of the obtained results.
4Numerical exampleSuppose a manufacturer can make a product at a production rate P=60000 items/year and this product has experienced stable annual demand from five different industrial clients, where λi, is 400, 500, 600, 700, and 800 respectively (hence, the sum of demand is 3000 per year). During the production process, the producer has experienced a random defective rate that follows a uniform distribution over the range of [0, 0.3]. Among the defective items 20% (i.e. θ=0.2) is found to be scrap items. The other portion of them can be reworked and repaired at a reworking rate P1=3600 per year. Other parameters used in this study include
C = $100 per item,
K = $35000 per production run,
h = $25 per item per year (manufacturer's unit holding cost per year),
h1 = $60 per item per year (manufacturer's unit holding cost for reworked item),
Cs = $20, disposal cost for each scrapped item,
CR = $60, repairing cost for each reworked item,
K1i = $100, $200, $300, $400 and $500 (the fixed delivery cost per shipment to customer i=1, 2, …, and 5, respectively),
CTi, = $0.5, $0.4, $0.3, $0.2, and $0.1 (transportation cost per item delivered to customer i=1, 2, …, and 5, respectively),
h2i = $75, $70, $65, $60, and $55 (holding cost per year per item kept by customer i=1, 2, …, and 5, respectively).
First, applying Equation 23 we have n=4.47. By examining two adjacent integers to n and applying Equation 22, we obtain (Q,n+)=(2472,5) and (Q,n−)=(2385,4). Then, substituting (Q,n+) and (Q,n−) in Equation 14 respectively and selecting the one that gives the minimum system cost, we obtain the optimal number of delivery n*=4, optimal replenishment Q*=2385, and the expected cost E[TCU(Q*,n*)] =$440,531.
Variation of random defective rate and scrap rate effects on E[TCU(Q*,n*)] is depicted in Figure 4. We note that as random defective rate x increases, the expected system cost E[TCU(Q*,n*)] increases significantly, and as the scrap rate x increases the expected system cost E[TCU(Q*,n*)] increases slightly.
5Conclusions![Variation of random defective rate and scrap rate effects on the E[TCU(Q*,n*)]](https://static.elsevier.es/multimedia/16656423/0000001200000001/v2_201505081640/S1665642314716013/v2_201505081640/en/main.assets/gr4.jpeg?xkr=ue/ImdikoIMrsJoerZ+w997EogCnBdOOD93cPFbanNcX6PcOHo8VDqRKrp6xHZ/NlPxKUvo805ICrHlplwxcm7hYIESfjCCTNDlVokL+8rMlTjp9raMXimnUFd4iLoTgjdntP1JuwaMTTXVpOxV9YeiqLZo9yHdP/q8mUtGb2XLotN22lHvcwwWeC6Ad1YTA2+T6hy2V+3wqhdcRMqra3pc2sbH5Isw8iRYy8vgsIjTwIRKdReBGhzGiAfBfvSrpnu9pwj+PEisDsfl+mxgSNkHIfNPLgrpryYg07yeqQPwbfbo4SEiehL7C4YjYlM2SRbsshiK+6c+8CG2feFsfYg== "Variation of random defective rate and scrap rate effects on the E[TCU(Q*,n*)]")
A multi-customer finite production rate model with quality assurance and discontinuous deliveries was studied. It considers that a product is made by a manufacturer and a portion of random nonconforming items produced is reworked and repaired right after the end of regular production in each replenishment cycle. After the entire lot is quality assured, multiple shipments are delivered synchronously to multi-customer in each cycle. Each customer has its own annual product demand, unit stock holding cost, and fixed and variable product delivery costs.
In real world supply chains environments, management of such a supply chain system would certainly like to figure out the optimal replenishment-distribution policy hence, the long-run average system cost can be minimized. This study accomplished the purpose by developing a solution procedure using the mathematical modeling to deal with the aforementioned supply chain system. As a result, a closed form solution of the optimal replenishment-distribution policy is obtained. Effects of various system parameters on the optimal solution are investigated (as shown in Figures 4) in order to provide management with in- depth insights of such a realistic multi-customer supply chain system.
Authors sincerely appreciate the National Science Council of Taiwan for its support of this research under grant number: NSC-100-2410-H-324-007-MY2.
During the delivery time t3, n installments of fixed quantity Di of the finished lot are delivered to customers at a fixed interval of time tn, where


The derivations of customers” holding cost (Equation 12) are as follows (see Figure 3).
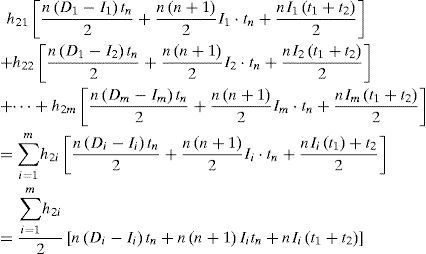
Because n installments of the finished lot are delivered to customer at a fixed interval of time tn, we have the following:
where Ii denotes number of left over items for each customer after demand during each fixed interval of time tn has been satisfied (see Figure 3). Equation (A-3) the customers' holding cost becomes

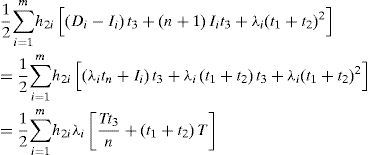
From Equation 13
by substituting all parameters from equations 1 to 12 in Equation 3 we havewith further derivations we have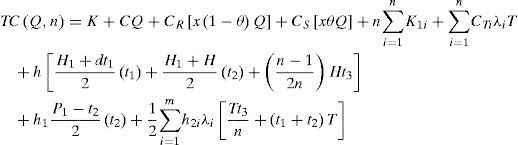
Taking into account of randomness of defective rate x and with further derivations, we obtain E[TCU(Q,n)] as