


The equilibrium adsorption of benzoic acid from an aqueous medium on a natural vermiculite-based adsorbent was studied in the presence and absence of hydrophilic silicon dioxide nanoparticles in batchwise mode. The adsorbent was prepared through grinding natural vermiculite in a laboratory vibratory disk mill and the surfactant modification of ground vermiculite by cetyltrimethylammonium bromide, subsequently. The equilibrium isotherm in the presence and absence of nanoparticles was experimentally obtained and the equilibrium data were fitted to the Langmuir, Freundlich, Dubinin–Radushkevich and Temkin models. The results indicated that the dispersion of silicon dioxide nanoparticles at optimum concentration in the liquid phase remarkably increases the removal efficiency. Furthermore, it yields a more favorable equilibrium isotherm and changes the compatibility of equilibrium data from the Langmuir and Temkin equations to just the Langmuir equation. A quadratic polynomial model predicting the equilibrium adsorbent capacity in the presence of nanoparticles as a function of the adsorbate and initial nanoparticle concentrations was successfully developed using the response surface methodology based on the rotatable central composite design. A desirability function was used in order to optimize the values of all variables, independent and dependent ones, simultaneously.
adjustable parameters of RSM-based model
Temkin isotherm equilibrium constant (L/mg)
Temkin isotherm constant (kJ/mol)
initial concentration of BA (mg/L)
equilibrium concentration of BA (mg/L)
initial concentration of nanoparticles (mg/L)
overall desirability function
individual desirability function
number of manipulated variables
Dubinin–Radushkevich isotherm constant (mol2/kJ2)
Freundlich isotherm constant ((mg/g)(L/mg)1/n)
Langmuir isotherm constant (L/mg)
lower limit
adsorbent mass (g)
number of data points
number of variables
number of central point replications
Freundlich adsorption intensity constant
importance weight
Dubinin–Radushkevich adsorption capacity (mg/g)
equilibrium adsorption capacity (mg/g)
calculated adsorption capacity at equilibrium (mg/g)
experimental adsorption capacity at equilibrium (mg/g)
Langmuir adsorption capacity (mg/g)
universal gas constant (kJ/molK)
temperature (K)
target value
upper limit
solution volume (L)
coded manipulated variable
uncoded manipulated variable
upper level of an uncoded manipulated variable
lower level of an uncoded manipulated variable
predicted response
variable
The burgeoning trend of industrialization has contributed to the discharge of a great deal of pollutants into our environment. Aromatic carboxylic acids (ACAs) are a sort of organic compounds whose occurrence in industrial waste effluents originates not only from the disposal of finished products and undesirable by-products, but also from the microbial oxidation of hydrocarbons. Because of the poor biodegradability of ACAs arising out of the electron-withdrawing carboxyl group on their phenyl ring, the wastewaters involved must be purified prior to discharge, as recommended by the European Environment Agency (Huang, Wang, & Huang, 2011; Knepper et al., 1999). Benzoic acid (BA) as the simplest ACA with widespread applications in many industrial sectors can serve as a suitable model compound to make a study of eliminating ACAs from aquatic media (Giannakas, Antonopoulou, Deligiannakis, & Konstantinou, 2013).
The conventional processes that have been thus far utilized for removing BA from aqueous solution include photocatalytic degradation (Gandhi et al., 2011), electrochemical oxidation (Garg & Prasad, 2015), microbial filtration (Zachritz, Lundie, & Wang, 1996) and adsorption (Xin et al., 2011; Yan et al., 2007; Yıldız, Gönülşen, Koyuncu, & Çalımlı, 2005). From the practical perspective, the adsorption process is approved as a highly selective, facile and economic in terms of design and operation and recyclable method for the removal of a vast array of organic and inorganic contaminants (Qu, 2008).
Nowadays, natural clay minerals, like vermiculite, because of being inexpensive, abundant and eco-friendly with a high capability for ion exchange, have drawn much attention either as direct adsorbent, for example, heavy metals (Gupta & Bhattacharyya, 2011) and a variety of dyes (Yagub, Sen, Afroze, & Ang, 2014), or as host matrices to fabricate effective adsorbents concerning low and high molecular weight organic acid species like BA (Borisover & Davis, 2015). The modification of clay minerals by substituting their inorganic interlamellar cations with quaternary ammonium cations using cationic surfactants like cetyltrimetylammonium bromide (CTAB) is one of the most common methods to decrease the high degree of hydrophilicity and the high concentration of negative structural charge of clay minerals, thereby improving their performance for the adsorption of organic acids from aqueous solution (Anirudhan & Ramachandran, 2006; De Araújo Medeiros, Sansiviero, Araújo, & Lago, 2009; Su, Lin, Wang, Xie, & Chen, 2011; Xin et al., 2011; Yan et al., 2007; Yıldız et al., 2005). There are also reports on the increase of cation exchange capacity, porosity and surface chemical reactivity of clay minerals after grinding by a vibratory disk mill, which favors their susceptibility to be modified organically (Filipović-Petrović, Kostić-Gvozdenović, & Erić-Antonić, 2002; Hongo, Yoshino, Yamazaki, Yamasaki, & Satokawa, 2012; Jiménez De Haro et al., 2004).
Over the past decade, the nanotechnology revolution has opened up a promising era in numerous fields of science (Choolaei, Rashidi, Ardjmand, Yadegari, & Soltanian, 2012) (Banaei, Vojoudi, Karimi, Bahar, & Pourbasheer, 2015). In this regard, several studies have been recently carried out to increase the efficiency of separation processes like liquid–liquid extraction (Bahmanyar, Khoobi, Mozdianfard, & Bahmanyar, 2011; Khoobi et al., 2013; Raji-Asadabadi, Abolghasemi, Maragheh, & Davoodi-Nasab, 2013) and liquid chromatography (Nilsson, Birnbaum, & Nilsson, 2007; Zhang, Wang, Liao, & Liu, 2006) in the presence of dispersed nanomaterials (typically nanoparticles). Although these studies are in their infancy, they have shown the potential of nanomaterials as multifunctional components to improve the separation efficiency. All the foregoing studies are focused on the increase of mass transfer in nanofluids. The enhanced mass transfer of several substances in water-based nanofluids in comparison with pure water has been reported by a number of scholars (Ashrafmansouri & Nasr Esfahany, 2014; Krishnamurthy, Bhattacharya, Phelan, & Prasher, 2006; Veilleux & Coulombe, 2011).
To our best knowledge, the present study is one of few investigations on the effect that the dispersion of nanoparticles in the adsorption medium has on the removal efficiency and the adsorbent capacity. In 2010, Jasper et al. (2010) evaluated the effect of dispersed silicon dioxide, titanium dioxide and iron(III) oxide nanoparticles on the batch adsorption of trichloroethylene from contaminated water by activated carbon. They found that silicon dioxide nanoparticles do not have any remarkable effect on the adsorption efficiency whereas the two other nanoparticles remarkably increase the adsorption efficiency. Silicon dioxide nanoparticles are one of the most common nanoparticles by reason of their low cost and commercial availability. The good biocompatibility of these nanoparticles makes them applicable to processes dealing with environmental issues (Sun, Yan, Yang, & Sun, 2006; Sun et al., 2007).
Today, multivariate statistical techniques are favored because they are time and cost efficient for experimentation and because they facilitate probing in the effect of inputs, alone and in combination, on the outputs in a multivariable system. Response surface methodology (RSM) is one of the most useful multivariate statistical techniques, particularly when a few variables are involved. This methodology is on the basis of fitting a polynomial model to a series of experimental data with the aim of making statistical previsions (Bezerra, Santelli, Oliveira, Villar, & Escaleira, 2008; Jain, Garg, & Kadirvelu, 2011). Since the most successful development of an RSM-based model is intertwined with the most detailed knowledge of process, an experimental design is essential to ascertain which experiments need to be performed in the experimental region being studied. The central composite design is one of the most standard experimental designs applied for establishing mathematical models estimating the first- and second-order effects in a multivariable system (Montgomery & Runger, 2010; Murugesan et al., 2014). The application of desirability function approaches in applied and analytical chemistry in order to find the best operating conditions and obtain the best result has attracted much attention in recent years (Bezerra et al., 2008).
In brief, this research is aimed at: (1) optimizing the concentration of dispersed hydrophilic silicon dioxide nanoparticles for the batch adsorption of BA from aqueous solution on mechanically and chemically modified natural vermiculite, (2) comparing the equilibrium isotherm in the presence and absence of nanoparticles, (3) analyzing the equilibrium data by four frequently used isotherm models (the Langmuir, Freundlich, Dubinin–Radushkevich and Temkin models), (4) developing an RSM-based model to study how the initial concentrations of adsorbate and nanoparticles influence the adsorption capacity and, lastly, (5) finding the best local conditions using a desirability function optimization approach.
2Materials and methods2.1MaterialsNatural vermiculite was collected from a mineral deposit in Kaleybar County (East Azerbaijan Province, Iran). BA (C7H6O2) and CTAB (C19H42BrN) of analytical grade were purchased from Merck and Sigma–Aldrich companies. Highly pure hydrophilic silicon dioxide (SiO2) nanoparticles were supplied by TECNAN Company. The field emission scanning electron microscopy (FE-SEM) analysis was conducted using a scanning electron microscope (TESCAN, MIRA3 LM) in order to investigate the surface morphology of silicon dioxide nanoparticles. The X-ray diffraction (XRD) analysis was performed using an X-ray diffractometer (PANalytical, X’Pert Pro MPD) in order to investigate the crystalline/amorphous structure of nanoparticles. The inductively coupled plasma mass spectroscopy (ICP-MS) analysis was performed by means of a mass spectrometer (Varian, OES-730) in order to determine the quantitative chemical composition of impurities in the sample of silicon dioxide nanoparticles. The dynamic light scattering (DLS) analysis was conducted by means of a dynamic light scattering analyzer (Microtrac, Nanotrac Wave) in order to determine the average particle size and also the size distribution of nanoparticles. The textural characteristics (the BET surface area, the total pore volume and the average pore diameter) of silicon dioxide nanoparticles were obtained by the N2 adsorption/desorption technique at −196°C using a gas adsorption analyzer (BEL Japan, BELSORP-mini II). Some characteristics of the used nanoparticles are listed in Table 1. The silicon dioxide nanofluid was prepared by dispersing a desired amount of nanoparticles in distilled water using an ultrasonicator at a frequency of 20kHz for 2hr.
2.2Preparation of adsorbentInitially, the natural vermiculite was reduced in size with a knife mill, passed through a 120-mesh sieve, and subsequently ground in a vibratory disk mill at 2000rpm for 10min. Thereafter, 10g of ground vermiculite was gently contacted with 1000mL of 23mM CTAB solution in a beaker at 60°C for 24h using a heater/stirrer. Finally, the solid phase was removed by centrifugation, rinsed with enough deionized water until no detection of bromide ions by 0.1M silver nitrate solution, dried at 60°C for 48h, activated at 120°C for 1h, pulverized in an agate mortar and packed for further use. The characteristics of the resultant adsorbent, hereinafter designated as CTAB-V, has been thoroughly described in our earlier works (Sadeghi Pouya et al., 2015a; Sadeghi Pouya et al., 2015b).
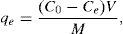
2.3Batch adsorption experimentsIn general, the adsorption experiments were conducted by placing an optimum amount of CTAB-V samples into 100-mL Erlenmeyer flasks filled with 50mL of BA solutions at an optimum initial pH value and then shaking the flasks at 200rpm at a temperature of 30°C for 12h using a thermostatic shaking incubator. After attaining the equilibrium state, the suspensions were centrifuged at 4000rpm for 15min and the supernatants were spectrophotometrically analyzed for the remaining BA concentration at a λmax of 227nm (corresponding to the maximum absorbance) using a Unico UV-2100 UV/vis spectrophotometer. Our preliminary experiments demonstrated that in the studied range of BA and nanoparticles initial concentrations, the optimum adsorbent dosage is 0.5g/50mL and the initial solution pH is optimum when not adjusted (i.e. the initial solution pH of 3.5±0.1). The upper and lower limit of BA and nanoparticles initial concentrations was also chosen as 100–1000mg/L and 1–10mg/L, respectively. The removal efficiency of BA and the adsorption capacity of CTAB-V at equilibrium were calculated by Eqs. (1) and (2):
where C0 is the initial concentration of BA; Ce is the equilibrium concentration of BA; qe is the equilibrium adsorption capacity; V is the solution volume; M is the adsorbent mass.2.4RSM modeling approach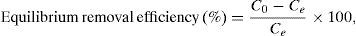
To explore an RSM-based correlation between the equilibrium adsorption capacity of CTAB-V in the presence of nanoparticles (as predicted response) and the initial concentrations of BA and nanoparticles (as manipulated variables), the design-expert software package (v. 7.0.0) was employed. A rotatable central composite design was implemented to create an experimental framework totally consisting of 13 runs, as calculated by the expression of 2n+2n+n0 using five central point replications that is the software default value for a system with two manipulated variables (Arulkumar, Sathishkumar, & Palvannan, 2011; Cho & Zoh, 2007). Given that the manipulated variables in this study were too different in scale, they were normalized in advance of modeling. In this regard, the upper level was coded as +1, the center level as 0 and the lower level as −1. For any value that lies either between the lower limit and the center level or between the center level and the upper limit, Eq. (3) was used as follows (Cho & Zoh, 2007; Karnik, Gaitonde, & Davim, 2007):
where Xi is the coded manipulated variable; xi is the uncoded manipulated variable; xi,max is the upper level of an uncoded manipulated variable; xi,min is the lower level of an uncoded manipulated variable.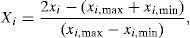
The response surface was related to the coded manipulated variables by a full second-order polynomial equation suggested by Box and Wilson in 1951 as follows (Bezerra et al., 2008; On the Experimental Attainment of Optimum Conditions on JSTOR, n.d.):
where Y is the predicted response; a0, ai, aij is the adjustable parameters.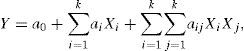
Regarding the experimentally obtained data, the model adjustable parameters were calculated by the multiple linear regression analysis using the least-squares optimization method. The model validity was assessed using the analysis of variance (ANOVA) subroutine and by plotting internally studentized residuals versus run number and also by constructing a normal probability plot of internally studentized residuals.
2.5Desirability function optimization approachThe desirability function optimization approach is a highly popular optimization technique used to simultaneously determine the optimum values of manipulated variables that can determine the optimum performance levels of one or more responses. During the optimization of a multivariate system, every single variable is converted into an individual desirability function with a value that varies from 0 to 1, the lowest desirability value to the highest desirability value (Islam, Sakkas, & Albanis, 2009; Mourabet et al., 2012). The individual desirability functions are then combined in an overall desirability function as follows (Bezerra et al., 2008; Paterakis, Korakianiti, Dallas, & Rekkas, 2002):
where D is the overall desirability; di is the individual desirability; n is the number of variables.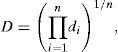
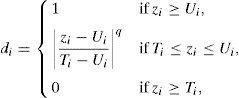
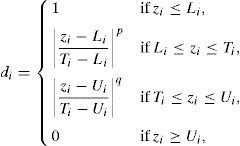
Depending on whether the target value of a particular variable is to be maximized, minimized or located between the lower limit and the upper limit, the individual desirability function is defined by Eqs. (6)–(8) (Bezerra et al., 2008; John, 2013):
where zi is the variable; Li is the lower limit; p, q is the importance weight; Ui is the upper limit; Ti is the target value.3Results and discussion3.1Characterization analysis of silicon dioxide nanoparticles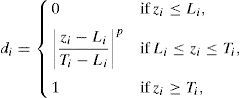
The surface morphology of silicon dioxide nanoparticles at two magnification levels (100.0kx and 150.0kx) is illustrated in Fig. 1. As this figure shows, silicon dioxide nanoparticles have a spherical and non-crystalline (or amorphous) morphology.
 100.0kx and (B) 150.0kx.")
The XRD pattern of silicon dioxide nanoparticles in the range of 2θ=10–80° is shown in Fig. 2. The low-intensity broad peak detected around 20° indicates the presence of a non-crystalline silicon dioxide phase in the sample that is totally in agreement with the FE-SEM images. Similar observations have been reported in previous research works (Fang et al., 2008).

The size distribution of silicon dioxide nanoparticles in semi-logarithmic coordinates is plotted in Fig. 3. This figure clearly shows that most of the nanoparticles lie in the range of 10.0–15.0nm in diameter. The results of the DLS analysis indicated that half of the silicon dioxide nanoparticles have an average diameter of about 12.80nm.

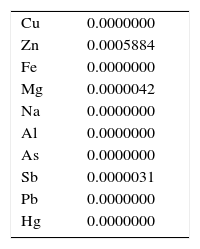
The quantitative chemical composition of impurities the sample of silicon dioxide nanoparticles determined by the ICP analysis and is listed in weight percentage in Table 2. A perusal of this table indicates that the purity of silicon dioxide in the sample is higher than 99.9wt.%.
Fig. 4A and B illustrates the N2 adsorption/desorption isotherm and the pore size distribution of the sample based on Barrett–Joyner–Halenda (BJH) model. The isotherm clearly shows that the hysteresis loop does not form even at high relative pressures, which suggests that the sample is not mesoporous (Naumov, 2009; Sing, 2001).
3.2Optimization of nanoparticles initial concentration N2 adsorption/desorption isotherm and (B) BJH pore size distribution of silicon dioxide nanoparticles.")
The initial concentration of silicon dioxide nanoparticles was optimized by shaking 0.5g of the CTAB-V samples with 50mL of 100–1000mg/L BA solutions at the initial pH value of 3.5 in the presence of various concentrations of dispersed nanoparticles (1, 2, 3, 5, 7.5 and 10mg/L). Fig. 5 shows the equilibrium removal efficiency as a function of the initial concentration of silicon dioxide nanoparticles and BA. It can be observed from Fig. 5 that the equilibrium removal efficiency peaks at a certain initial concentration of nanoparticles and completely levels off afterwards. The initial concentration of nanoparticles was found to be optimum at 5mg/L when the initial concentration of BA ranges between 100 and 400mg/L and to be optimum at 7.5mg/L when the initial concentration of BA in the range of 400–1000mg/L. Accordingly, the nanofluid of 7.5mg/L of the initial concentration was used in order to equalize the conditions for the equilibrium adsorption isotherm experiments. Fig. 6 shows the equilibrium removal efficiency in the presence and absence of nanoparticles. As it displayed in Fig. 6, the equilibrium removal efficiency increases in the range of about 9–31.5% in the presence of 7.5mg/L silicon dioxide nanoparticles in comparison with their absence when the initial concentration of BA varies from 100 to 1000mg/L. Since the colloidal stability of nanofluid has an extremely important effect on the performance of nanoparticles, the relative stability of 7.5mg/L nanofluid was investigated as a function of the elapsed time using the UV/vis spectrophotometer method, as stated by Bahmanyar et al. (2011). For this purpose, the absorbency of nanofluid with an initial concentration of 7.5mg/L was continually determined at a λmax of 325nm (corresponding to the maximum absorbance) over 12h that is the required contact time for the equilibrium establishment. As the results are illustrated in Fig. 7, the relative concentration of suspended nanoparticles (the concentration at time t divided by the initial concentration) reduces less than 7% within 12h, which is indicative of an adequate stability of nanofluid during the adsorption experiments.


The first probable explanation for the enhanced removal efficiency in the presence of silicon dioxide nanoparticles was the adsorption of BA by the mentioned nanoparticles. But this hypothesis was rejected because our additional experiments revealed that the dispersed hydrophilic silicon dioxide nanoparticles at the aforementioned concentrations do not have any remarkable affinity toward BA without introducing CTAB-V into the adsorption system. As shown in Fig. 8, the equilibrium removal efficiency of 100–1000mg BA/L in a 7.5mg/L silicon dioxide nanofluid in the absence of CTAB-V was found to be up to a maximum of approximately 4.7%. In contrast, Jasper et al. (2010) have found from their adsorbent-free experiments that both titanium dioxide and iron(III) oxide nanoparticles alone act as adsorption sites for up to 60% of trichloroethylene. Hence, it was concluded that the presence of nanoparticles certainly has a positive side effect on the adsorptive behavior of BA. It can be proposed that the increase in BA removal efficiency may correspond to the increase in BA mass diffusion rate in the liquid phase arising from the Brownian motion of nanoparticles that creates micro/nanoscale convection through the interstices of adsorbent particles (Ashrafmansouri & Nasr Esfahany, 2014; Krishnamurthy et al., 2006).
3.3Equilibrium adsorption isotherm
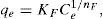
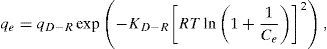
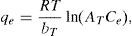
The Langmuir, Freundlich, Dubinin–Radushkevich and Temkin models were used to analyze the equilibrium data. The mathematical expression of these models is given in Eqs. (5)–(8) (Foo & Hameed, 2010; Ho, Porter, & McKay, 2002):
where qL is the Langmuir adsorption capacity; KL is the Langmuir isotherm constant; KF is the Freundlich isotherm constant; nF is the Freundlich adsorption intensity constant; qD–R is the Dubinin–Radushkevich adsorption capacity; KD–R is the Dubinin–Radushkevich isotherm constant; R is the Universal gas constant; T is the temperature; bT is the Temkin isotherm constant; AT is the Temkin isotherm equilibrium constant.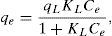
The adjustable parameters together with the coefficient of determination for each isotherm model was calculated using the MATLAB nonlinear least-squares optimization routine. The values of qe from the experiments and from the models were also compared based on the average absolute relative deviation (AARD) defined as follows (Foo & Hameed, 2010):
where N is the number of data points; qe,exp is the experimental adsorption capacity at equilibrium; qe,cal is the calculated adsorption capacity at equilibrium.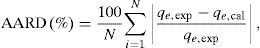
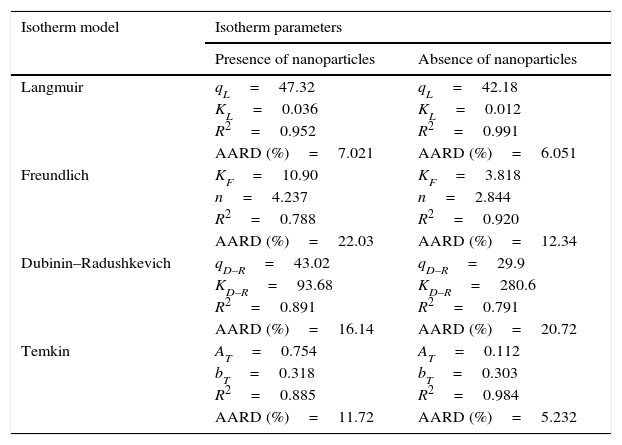
Fig. 9A and B shows the experimental equilibrium data and the predicted equilibrium isotherms for BA adsorption onto CTAB-V in the presence and absence of nanoparticles. According to Alberti, Amendola, Pesavento, and Biesuz (2012), it is apparent that the shape of experimental isotherm alters from the Langmuir type (without strict plateau) in the absence of silicon dioxide nanoparticles to the high affinity type in the case of nanoparticles presence. This in turn manifests that the adsorption of BA onto CTAB-V takes place more favorably in the presence of nanoparticles (Kyzas & Matis, 2015). Table 3 tabulates the fitting results together with the AARD values for each isotherm model. As can be seen, the equilibrium data are better fitted to the Langmuir and Temkin models in the absence of nanoparticles whereas in the presence of nanoparticles, they are satisfactorily fitted by just the Langmuir model.
 in the presence of 7.5mg/L silicon dioxide nanoparticles and (B) in the absence of nanoparticles.")
Isotherm model parameters, coefficients of determination and AARD values for BA adsorption onto CTAB-V in the presence of 7.5mg/L silicon dioxide nanoparticles and in their absence.
| Isotherm model | Isotherm parameters | |
|---|---|---|
| Presence of nanoparticles | Absence of nanoparticles | |
| Langmuir | qL=47.32 | qL=42.18 |
| KL=0.036 | KL=0.012 | |
| R2=0.952 | R2=0.991 | |
| AARD (%)=7.021 | AARD (%)=6.051 | |
| Freundlich | KF=10.90 | KF=3.818 |
| n=4.237 | n=2.844 | |
| R2=0.788 | R2=0.920 | |
| AARD (%)=22.03 | AARD (%)=12.34 | |
| Dubinin–Radushkevich | qD–R=43.02 | qD–R=29.9 |
| KD–R=93.68 | KD–R=280.6 | |
| R2=0.891 | R2=0.791 | |
| AARD (%)=16.14 | AARD (%)=20.72 | |
| Temkin | AT=0.754 | AT=0.112 |
| bT=0.318 | bT=0.303 | |
| R2=0.885 | R2=0.984 | |
| AARD (%)=11.72 | AARD (%)=5.232 | |
By fitting the results from the designed experiments to Eq. (4), the model predicting the equilibrium capacity of CTAB-V in terms of coded manipulated variables was derived as follows:
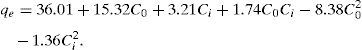
The high coefficient of determination (0.988) and Fisher value (115.1) verified the model adequacy. Additionally, the probability value was about 0.000. By definition, if the probability value is less than 0.05, the model is statistically considered significant and the Fisher value is high enough. The latter signifies that the most of variations in the response can be predicted by the model (Jain et al., 2011; Murugesan et al., 2014). Fig. 10A depicts the internally studentized residuals against the run number. It is evident from this figure that the differences between the actual and the model-predicted responses fall within the acceptable range, i.e. from −3 to +3 in the context of internally studentized residual (Dopar, Kusic, & Koprivanac, 2011; Jadhav, Surwase, Phugare, & Jadhav, 2012). Therefore, it is possible to conclude that there were no outliers among the experimental data set. Fig. 10B depicts the normal probability plot of internally studentized residuals. It is clear that the points in this figure are appropriately located near to the diagonal straight line. This satisfies the normality assumption. In other words, it corroborates the normal distribution of errors around the mean value and their independency from each other (Dopar et al., 2011; Jadhav et al., 2012). The mean and variance values of the internally studentized residuals in this study were found to be 0.044 and 1.342, respectively. Statistically, as the mean value of a group of data tends to zero and their variance value tends to unity, the distribution of those data is taken to be standard normal (Montgomery & Runger, 2010). Fig. 10A and B further confirms the validity of the suggested model.
 The internally studentized residuals versus run number and (B) the normally probability plot of the internally studentized residuals.")
Fig. 11A and B illustrates the individual and cumulative impacts of the initial concentrations of BA and nanoparticles on the equilibrium adsorption capacity in the choice of test range in three-dimensional response surface plot and two-dimensional contour plot, respectively. The plots represent that the adsorption capacity increases by increasing the initial concentrations of both BA and nanoparticles. Fig. 11A shows that the initial concentration of BA has a more profound effect on the response amplitude than the initial concentration of nanoparticles. The curvature of contour lines denotes to what extent the independent variables have communal interactions. If the shape of the contour lines is more elliptical rather than circular, the interactive effect of independent variables on the predicted response is more significant. As it illustrated in Fig. 11B, the contour lines are of elliptical type in this study, which means that the interactions between C0 and Ci are likely to be of great significance to the equilibrium adsorption capacity (Jadhav et al., 2012; Zhong & Wang, 2010).
3.5Desirability function optimization three dimensional response surface plot and (B) two dimensional contour plot.")
A maximum level of BA initial concentration, minimum level of silicon dioxide nanoparticles initial concentration and maximum level of CTAB-V adsorption capacity were set for the maximum desirability. By seeking from 30 points per optimizations that is the software default and considering the importance of each variable the highest value that can vary from 1 to 5, the best local conditions were found to be the initial concentration of BA at 969.2mg/L, the initial concentration of silicon dioxide nanoparticles at 1mg/L and the adsorbent capacity at about 36.83mg/g. Fig. 12 shows the optimum values for all variables suggested by the software. The effect of BA and silicon dioxide nanoparticles initial concentration on the combined desirability values is h shown in Fig. 13. Fig. 14 also shows the values of individual desirability values as well as the combined desirability value that was found to be 0.916, which indicates the reliability of the optimizations process.
4Conclusions


To sum up, the batch adsorption of BA from aqueous solution onto CTAB-V at equilibrium was compared in the presence and absence of hydrophilic silicon dioxide nanoparticles in this research. An RSM-based model was also developed for investigating the equilibrium adsorption capacity by varying the initial concentrations of BA and nanoparticles. The main conclusions can be summarized as below:
- (I)
A 5 and 7.5mg/L initial concentration of nanoparticles optimizes the equilibrium efficiency of BA adsorption onto CTAB-V when the initial concentration of BA is 100–400 and 400–1000mg/L, respectively.
- (II)
The equilibrium removal efficiency of BA in the presence of 7.5mg/L nanoparticles increases by between about 9.0% and 31.5% when the initial concentration of BA varies from 100 to 1000mg/L.
- (III)
The equilibrium adsorption isotherm changes from the Langmuir type (without strict plateau) in the absence of nanoparticles to the high affinity type in the presence of nanoparticles, which implies the more favorable adsorptive behavior of CTAB-V when the nanoparticles are present.
- (IV)
In the presence of nanoparticles, the equilibrium data are better fitted to the Langmuir model compared to the Freundlich, Dubinin–Radushkevich and Temkin models. In the absence of nanoparticles, the equilibrium data are better fitted to the Langmuir and Temkin models compared to the two other models.
- (V)
The RSM-based model reliability was confirmed by the high coefficient of determination and Fisher value as well as the probability value of less than 0.05. The range of internally studentized residuals was acceptable (between −3 and +3) and they were normally distributed owing to their mean and variance values very close to zero and unity, respectively.
- (VI)
The interactive effect of the initial concentrations of BA and nanoparticles on the equilibrium adsorption capacity was found to be noticeable resulting from the elliptical form of contours. Individually, it was observed that the initial concentration of BA has a larger effect on the response than the initial concentration of nanoparticles.
- (VII)
The desirability function optimization approach showed that the best local conditions are to be the initial concentration of BA at 969.2mg/L, the initial concentration of silicon dioxide nanoparticles at 1mg/L and the adsorbent capacity at about 36.83mg/g.
The authors have no conflicts of interest to declare.
The authors are sincerely grateful to the editors and anonymous reviewers of the Journal of Applied Research and Technology for their insightful comments and suggestions on an earlier draft of this article. The authors would also like to wholeheartedly acknowledge Prof. Parissa Khadiv-Parsi, Mr. Amir Yadegari, Mr. Amir Rouhi, Ms. Maryam Nedaei and Dr. Mohammad Foroughi-dahr for their unwavering scientific support and encouragement.
Peer Review under the responsibility of Universidad Nacional Autónoma de México.