


We present the design and implementation of femtosecond pulse compression at 1030nm based on spectral broadening in single-mode fiber, followed by dispersion compensation using an optimized double-pass SF11 prism pair. The source laser produced 1030-nm 144-fs pulses which were coupled into Corning® HI 1060 fiber, whose length was chosen to be 40cm by using a pulse propagation model based on solving the generalized nonlinear Schrödinger equation. A maximum broadening to 60-nm bandwidth was obtained, following which compression to 60±3fs duration was achieved by using a prism-pair separation of 1025±5mm.
The compression of femtosecond pulses is a two stage process, comprising a nonlinear step to increase the pulse spectral bandwidth followed by a linear compensation step to remove any additional spectral phase distortion acquired during the spectral broadening process (Shank, Fork, Yen, Stolen, & Tomlinson, 1982). In this article, we describe the use of spectral broadening effects in standard Corning® HI 1060 fiber to achieve a more than a two-fold reduction in pulse duration. This fiber is readily available, easy to cleave and splice and is inexpensive, giving it several advantages over more highly nonlinear photonic crystal fiber (PCF) often used in supercontinuum or other spectral broadening applications (Farrell, Serrels, Lundquist, Vedagarbha, & Reid, 2012).
Many previous experiments have demonstrated the production of ultrafast pulses with the use of fibers and/or prisms (Fork, Greene, & Shank, 1981; Gordon & Fork, 1984; Knox, Fork, Downer, Stolen, & Shank, 1985; Shank et al., 1982). In some cases, a prism and grating pair are used in order to compensate more accurately for phase distortions of other positively dispersive elements in the optical system such as fibers or other saturable absorbers used to manipulate or amplify ultrafast pulses (Becker, Fragnito, Fork, Beisser, & Shank, 1989; Brito Cruz, Becker, Fork, & Shank, 1988; Fork, Brito Cruz, Becker, & Shank, 1987).
Specifically, our approach to femtosecond pulse compression employed spectral expansion in an optical fiber (Barviau, Randoux, & Suret, 2006; Dudley, Genty, & Coen, 2006) followed by the use of a prism pair to compensate for group delay dispersion (Fork, Martinez, & Gordon, 1984). Dispersion compensation using prisms is commonly used for intracavity dispersion compensation within lasers (Gordon & Fork, 1984; Knox, Downer, Fork, & Shank, 1984; Knox et al., 1985; Valdmanis & Fork, 1986; Valdmanis, Fork, & Gordon, 1985) and is attractive because the technique provides negative group delay dispersion despite the use of only positively dispersive media (Gordon & Fork, 1984).
This article describes in detail the design and operation of this pulse compression system, starting from the use of second-harmonic generation (SHG) frequency resolved optical gating (FROG) to characterize the original pulses from the source laser, before using these data as the input to a propagation code used to select the optimum length of HI 1060 fiber giving suitable spectral broadening without introducing excessive temporal broadening due to linear dispersion. SHG-FROG measurements of the output of the fiber were compared with the predictions of the propagation code to select the appropriate tip-to-tip spacing of a pair of fused silica prisms used for dispersion compensation after the fiber. Finally, SHG-FROG measurements of the output of the prism sequence were used to confirm the quality of the pulse compression. The remainder of this paper discusses each of the above steps and describes in detail their implementation.
2Pulse propagation modelling and characterization2.1Pulse characterization using frequency-resolved optical gatingSHG-FROG was used to measure the intensity and phase profiles of the pulses before and after the compression fiber. The entire setup is shown in Figure 1. The input pulses were separated by means of a beam splitter into two copies which traveled down independent arms of the Michelson interferometer before being recombined into parallel paths directed into a lens and a Type I LBO SHG crystal.

Schematic of the experimental setup. The pulses were coupled into the fiber followed by a prism pair with separation L. The downward angle permits the use of another mirror to steer the beam into the FROG. Upon entering the FROG, two copies of the pulse were made and they traveled down separate arms of an interferometer before recombining inside the frequency-doubling crystal. The SHG signal was captured by the spectrometer for a range of delays.
The noncollinear phase-matching geometry produced a background-free SHG signal which was steered into a spectrometer, and the SHG-FROG trace was recorded by stepping the delay in the interferometer under Matlab control using a Newstep actuator and synchronously acquiring the SHG spectrum on an Ocean Optics spectrometer.
The method of generalized projections was used to retrieve the pulse intensity and phase from the SHG-FROG data (DeLong, Kohler, Wilson, Fittinghoff, & Trebino, 1994); however, we note that it is impossible to avoid the inherent ambiguity in the direction of time associated with the SHG-FROG method, which means that the result is invariant to the exchange of the true pulse field E(t) with that of its time-reversed complex conjugate, E*(−t).
Prior to implementing the phase retrieval algorithm, a simple linear interpolation was used to re-sample the experimental data onto uniformly spaced axes in time and frequency suitable for phase retrieval. The retrieval algorithm employed the root-mean-square deviation (RMSD) to evaluate how successfully the algorithm had converged to the experimental data. The RMSD was calculated using the standard definition:
where ym is the model value, yd is the data value and N is the number of samples. Convergence was defined as when the RMSD no longer decreased with additional iterations of the phase retrieval algorithm.2.2Fiber propagation modeling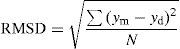
The generalized nonlinear Schrödinger equation (GNLSE) was solved numerically in order to characterize the pulse propagation in the compression fiber. The form of the GNLSE was taken from (Dudley et al., 2006) as:
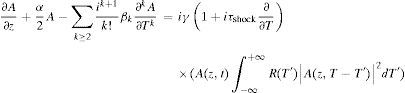
On the left-hand side of Eq. (2), the terms are defined as follows: A(z,t) is the pulse as a function of time after propagating a distance z; T is time within a co-moving frame associated with the group velocity: T=t−β1z; γ is the Kerr nonlinearity coefficient of the fiber based on n2; Aeff is the effective mode area (Dudley et al., 2006); α is a constant associated with the linear loss in the fiber; the sum containing the βk terms represents the effective wave vector expansion based on linear material and waveguide dispersion properties of the fiber (Dudley et al., 2006). On the right-hand side, the term containing τshock represents self-steepening which corresponds to the dispersion of the nonlinearity, and the integral represents other nonlinear processes such as SPM, four-wave mixing and Raman scattering with the response function R(t) characterizing the Kerr instantaneous electronic and delayed Raman contributions respectively in the form as follows:

The Raman fraction fR=0.18 in the case of fused silica and hR(t) is a function describing the Raman contribution theoretically (Blow & Wood, 1989). The split-step Fourier method with a fourth-order Runge–Kutta solver was used to allow the time- and frequency-dependent responses of the medium to be applied sequentially at each propagation step in order to solve the GNLSE (Dudley et al., 2006). In our model, the spontaneous Raman noise is assumed negligible.
It is worth noting that in the GNLSE shown in Eq. (2) there is a slowly varying envelope approximation (Dudley et al., 2006). This approximation simplifies calculations for soliton propagation and even accurately describes pulses operating in the single-cycle regime (Dudley et al., 2006). Therefore, it is a robust model that can be used in this case where a pulse contains several cycles within its duration.
For the purposes of the propagation model, we estimated the peak power of the input pulses by taking the average power and dividing by the repetition frequency and pulse duration obtained from SHG-FROG.
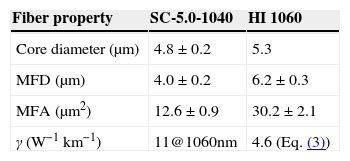
2.3Corning HI 1060 nonlinearity and dispersion parametersNo value of the nonlinear coefficient γ for HI 1060 fiber was available in the literature; however, an estimate of γ at the desired wavelength was made by comparison of the mode-field areas between HI 1060 and another silica fiber with known γ. In order to obtain the mode-field area for each fiber, a mode-field diameter measurement is required for each fiber. The quoted mode-field diameter (MFD) of Corning fiber is based on the reference method using the Petermann-II integral. The theoretical values of a highly nonlinear fiber manufactured by NKT Photonics were used as a comparison. The properties of both fibers are summarized in Table 1.
Fiber properties of SC-5.0-1040 and HI 1060. MFD and MFA are mode-field diameter and area respectively. The properties for SC-5.0-1040 were sourced from the datasheet (NKT Photonics Catalogue, 2015) and similarly for HI 1060 (Corning Catalogue, 2010). The value of the nonlinear coefficient γ for HI 1060 was estimated using Eq. (3).
| Fiber property | SC-5.0-1040 | HI 1060 |
|---|---|---|
| Core diameter (μm) | 4.8±0.2 | 5.3 |
| MFD (μm) | 4.0±0.2 | 6.2±0.3 |
| MFA (μm2) | 12.6±0.9 | 30.2±2.1 |
| γ (W−1km−1) | 11@1060nm | 4.6 (Eq. (3)) |
We estimated the value of γ for HI 1060 by scaling the value quoted for SC-5.0-1040 with respect to the effective mode-field areas as shown in Eq. (3).

The estimated value of γ at 1030nm for HI 1060 fiber was 0.0046±0.0007W−1m−1. The error was estimated at around 14% primarily because there was an uncertainty about the distribution of γ around 1060nm. Hence, despite the possibility of determining the MFD of the SC-5.0-1040 fiber more accurately using the graph (NKT Photonics Catalogue, 2015), it was left at 4.0±0.2μm to reflect the uncertainty in the quoted value of γ at 1060nm being used to estimate γ at 1030nm in HI 1060. This estimated value of γ is validated in Section 2.2.
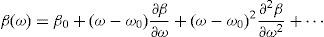
The fiber dispersion parameters were characterized by a Taylor expansion around the fundamental frequency ω0 (Dudley et al., 2006):
The fiber dispersion can be expressed in a standardized D-curve construct related to the group velocity dispersion β2 via the following relation (Paschotta, 2008):
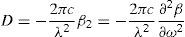
Here, D is the dispersion parameter defined in ps/nmkm. A computed D-curve was obtained from a paper on mode-field distortion (Várallyay & Szipőcs, 2014) and numerically extrapolated using Matlab's user input utility. The average deviation of the two points was calculated using interpolated values of the computed curve. The assumed vertical offset was quantified and subtracted from the entire curve to result in an estimated D-curve, as shown in Figure 2.
, the Corning data points and the vertical offset by an interpolated correction. Without a third data point, only a vertical or horizontal offset could be assumed. It is worth noting that the extrapolated data is only accurate in the neighborhood of 1.03μm and the TOF data are experimentally measured and accurate across the entire spectrum.")
D-curves for HI 1060, showing the MATLAB polyfit extrapolated values (Várallyay & Szipőcs, 2014), the Corning data points and the vertical offset by an interpolated correction. Without a third data point, only a vertical or horizontal offset could be assumed. It is worth noting that the extrapolated data is only accurate in the neighborhood of 1.03μm and the TOF data are experimentally measured and accurate across the entire spectrum.
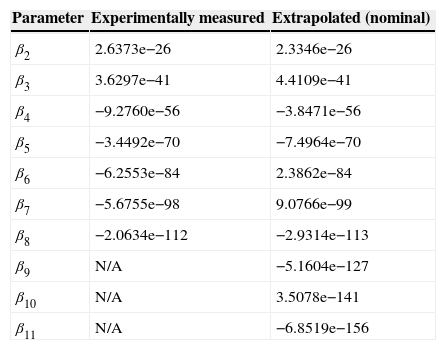
In Table 2, we compare the dispersion parameters obtained using this method with an independent set of previously unpublished values we obtained experimentally by direct time of flight (TOF) measurement. A dispersion curve calculated from the TOF data is plotted in Figure 2. The small difference between the D-curves was found to make no significant impact on the simulation results for the powers and nonlinearity presented in this work.
Table of comparison between measured HI 1060 dispersion parameters and those extrapolated from the nominal curve (Várallyay & Szipőcs, 2014). The small differences made no significant impact on the fiber modeling results.
| Parameter | Experimentally measured | Extrapolated (nominal) |
|---|---|---|
| β2 | 2.6373e−26 | 2.3346e−26 |
| β3 | 3.6297e−41 | 4.4109e−41 |
| β4 | −9.2760e−56 | −3.8471e−56 |
| β5 | −3.4492e−70 | −7.4964e−70 |
| β6 | −6.2553e−84 | 2.3862e−84 |
| β7 | −5.6755e−98 | 9.0766e−99 |
| β8 | −2.0634e−112 | −2.9314e−113 |
| β9 | N/A | −5.1604e−127 |
| β10 | N/A | 3.5078e−141 |
| β11 | N/A | −6.8519e−156 |
The compression effect of a prism pair can be represented by the following phase function containing the second- and third-order terms in a Taylor expansion of the spectral phase, φ(ω) (Fork et al., 1987),
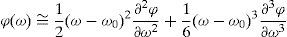
The terms are as follows: ω0 is the central wavelength; the second-order term, ∂2φ/∂ω2 is the group delay dispersion (GDD) and represents the quadratic phase distortion; the third-order term, ∂3φ/∂ω3 is the cubic phase distortion (CPD) which is a strong effect in a prism-pair configuration and so cannot be ignored (Fork et al., 1984, 1987). The GDD and CPD components can be expressed as a function of the path difference P and material dispersion in the prisms (Fork et al., 1987). We applied Eq. (7) and the expressions contained in (Fork et al., 1987) and (Fork et al., 1984) to identify the tip-to-tip prism separation needed to compensate for the frequency-dependent phase changes resulting from linear and nonlinear effects in the HI 1060 fiber. The spectral phase of the prism sequence can be applied to the spectral field amplitude of the pulses exiting the fiber to find the resulting time-domain profile,
where E(ω) is the complex spectral amplitude of the input pulse and E(t) is the complex time-domain amplitude of the pulse after the prisms.3Propagation model validation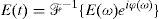
To establish the predictive credentials of the GNLSE propagation model, we first recorded experimental spectral data for laser pulses before and after the fiber for a range of average powers, up to a maximum coupled power of 170mW which corresponded to 65% coupling efficiency. This level of power was easily sufficient to facilitate the necessary SPM in the fiber.
Taking as its input the SHG-FROG data of the pulses directly from the laser, the GNLSE model was used to propagate the pulses down the fiber in order to estimate the broadening due to SPM and determine the minimum length of HI 1060 needed to provide adequate spectral broadening. To obtain close agreement with experiment, it was found to be necessary to adjust the exact value of the simulation peak-power parameter. This is not unexpected since there was known to be uncertainty in the experimental peak power, γ coefficient (Eq. (3)) and Taylor expansion dispersion terms (Eq. (4)). A nonlinear model such as the GNLSE is sensitive to small changes in these parameters but by adjusting the model peak power we were able to reproduce the same spectral broadening as we observed experimentally.
Comparisons of the experimentally measured spectra and the simulation output at 151mW and 76mW average (experimental) power are presented in Figure 3. It can be seen that the model reproduces the bandwidth and the general spectral shape of the fiber output pulses for both power levels. This agreement is a necessary prerequisite before proceeding to apply the model to predict the best fiber length. Based on these results, a fiber length of 40cm was selected which provided adequate spectral broadening without excessive linear dispersion, which would otherwise make it difficult to recover transform limited pulses using the limited dispersion compensation available from a prism compressor.
 151mW and (B) 76mW. The lab spectrum (blue) is fitted to the model (red).")
The pulse propagation simulation was extended by including a prism compressor section (a double-pass of one prism pair) at the output of the model. The modeled prism separation was varied and the FWHM duration was recorded at each value, as shown in Figure 4. The minimum compressed pulse duration was found for a separation L of around 1025mm and was 61±3fs.

The best prism separation was also investigated experimentally and the separation leading to the best compression was also found to be 1025mm. The compressed pulses were measured using the SHG-FROG and outputs of the SHG-FROG retrieval are compared with the compression model in Figure 5, illustrating excellent agreement.
4Discussion
We have presented here a systematic approach to pulse compression of 1030-nm pulses using commonly available single-mode fiber and shown it to be successful in producing a 2.5× reduction in the pulse duration. The system as presented here could still be significantly improved. There were significant power losses in the prism compressor as a result of the polarization state being lost in the fiber, which was not polarization maintaining. The use of SHG-FROG would potentially allow the development of a compressor utilizing both gratings and prisms together in a single arrangement. This offers certain advantages because the grating pair can be used to remove strong quadratic phase distortion while the prism pair is well suited to compensating residual cubic phase distortion. A combination of both can permit the compression of broadband ultrafast pulses to below 10fs (Fork et al., 1987).
The prism compressor was implemented experimentally by folding the tip-to-tip separation using two mirrors on translation stages. This scheme allowed the prism separation to be varied very easily without the need for extensive realignment of the beams entering and leaving the prism pair. Initial measurements at separations of 1290mm, 1100mm and 1000mm were sufficient to coarsely bracket the position of optimum compression, after which the translation stage between the prisms could be adjusted very finely. By controlling the stage position and measuring the peak SHG-FROG amplitude in real time, the optimal position could be located within a predefined region very quickly. This optimization technique was found to be very effective in determining the most effective compression point.
5ConclusionsIn summary, we have presented and validated a systematic means of implementing pulse compression of femtosecond laser pulses at 1030 nm using the readily available Corning HI 1060 fiber as a nonlinear spectral broadening medium. While the broadening available is limited because of the positive dispersion of the fiber at the laser wavelength, the pulses produced are expected to have full coherence across their bandwidth because broadening is driven only by self-phase modulation rather than by Raman or soliton fission effects. The presented values of γ and β(ω) for Corning HI 1060, and their validation in a pulse propagation model, should make it possible for a similar approach to be adopted by other researchers.
Conflict of interestThe authors have no conflicts of interest to declare.
The authors gratefully acknowledge the loan of a 1030-nm femtosecond laser system from Chromacity Ltd. for the duration of this research.
Peer Review under the responsibility of Universidad Nacional Autónoma de México.