


The development of an optoelectronic system to analyze the beam intensity profile of CO2 lasers is presented herein. The device collects the beam profile with a LiTaO3 pyroelectric detector and uses a sampling technique based on the acquisition of horizontal sections at different levels. The digital signal processing includes subroutines that drop down two dimensional and three dimensional beam profile displays to determine the laser beam parameters of optical power, peak pixel location, centroid location and width of the laser beam, with algorithms based on the ISO 11146 standard. With the systematic calibration of the analyzer was obtained in the measurement of power an error under 5%, for a 20–200W range and an error under 1.6% for spatial measurements of a TEM00 laser. By design, the analyzer can be used during the laser process.
The greatest application of lasers in the industry is for materials processing. Among the laser systems most used for manufacturing is found the CO2 laser. This is mainly due to the high absorption of its infrared radiation by materials such as wood, plastic and ceramics, in addition to its relatively high efficiency (greater than 10%) (De Maria & Hennessey, 2010). Before carrying out a laser process, it is recommended that the distribution of its intensity (profile) be checked, to verify that its transversal electromagnetic mode (TEM) is not distorted, since this reduces the performance of the laser. The inspection of the profile can be carried out with non-electronic methods, such as florescent cards and burning paper, however, these only allow one to distinguish a reduced number of intensity levels by simple observation. Another non-electronic technique consists of marking the profile on an acrylic block to obtain its three dimensional representation, however, this produces toxic fumes during the sample (Green, 2001). Added to that previously mentioned, these techniques are considered to be static, since they do not reveal instantaneous fluctuations. On the other hand, there are electronic devices for analyzing the profile that measures its attributes and that present it in a two dimensional (2D) and three dimensional (3D) manner with the help of a computer. This equipment varies in design, depending on the wavelength of the laser studied and the techniques used for sampling and attenuation of the beam (Roundy & Kirkham, 2014).
In this respect, the development of a beam profile analyzer is presented along with its graphical user interface (GUI). The device was designed for the specific study of CO2 lasers that have an optical bandwidth between 9μm and 11μm (infrared). To collect the intensity profile, the analyzer uses an alternative sampling technique based on obtaining horizontal sections at different levels (López & Villagómez, 2014), which can be observed in Figure 1. For horizontal sampling a mirror mounted on a rotating arm is used, with a frequency of 240rpm. This mirror deviates the entering laser beam toward a pyroelectric detector for 12.5ms, limiting the irradiance to 5% and obstructing the beam only 5% of the time, which means that it does not significantly interfere with the laser process. As far as vertical scanning is concerned, the detector is placed on an elevator that changes its level every time the mirror finishes sampling a horizontal section. The signal supplied by the LiTaO3 detector is conditioned and it is later digitized and processed by the computer.
2Signal processing
Signal conditioning is performed with an electronic circuit consisting of a low noise amplifier, a demodulator and a filter. In Figure 2 a block diagram of its function is shown. In the detection stage, laser radiation is converted by a small electrical signal (A), consisting of alternate voltage pulses with different amplitudes (pyroelectric effect) (Meledina, 1998). These voltages are dependent upon the position of the rotating mirror, forming an amplitude modulating signal (AM). In the following stages, the signal is amplified (B) and the modulating signal is obtained by demodulation of AM (C) and finally, the signal passes through a filtering stage to eliminate ripple voltage and to obtain the analogical signal of the beam profile (D).
2.1Programming
Digital signal processing carried out by the computer uses algorithms that calculate total optical power, locating the maximum point of irradiance (peak pixel) and determining the centroid and the beam width through the method of moments specified by the ISO 11146 standard (ISO 11146, 2000; ISO 13694, 2000). To process information from the analyzer, programming was developed based on the flow diagram that is presented in Figure 3. From the beginning the GUI is generated and variables are initialized. Later, the program waits until the elevator indicates that it is found at any of its ends, through some optical switches. Upon obtaining a positive response from the analyzer, the software waits until it has the signal where the rotating arm indicates that it began to deviate the beam; when this happens the computer communicates with the data acquisition system to begin to digitize the signal conditioning of the detector. Horizontal sections are sampled until the elevator is found at the other end, that is, when it has finished collecting the profile. Once this has been done, the program processes the information acquired, shows the graph of the profile and the measurements. Finally, it asks if it will finish the process or begin another profile.
2.2Measurement of power and dimensional parameters
The measurement of power PA delivered by the analyzer is calculated by adding up the intensity I(x, y) of all points that make up the beam profile sampled, with the equation:
where (x, y) are the coordinates of the sample point, m and n are the number of samples taken and α is a scaling factor obtained upon dividing the reading of an optical power meter (OPM) by PA with α=1 (calibration stage).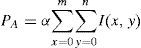
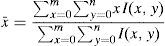
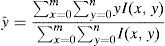
For that concerning the coordinates of the maximum point of irradiance and the centroid, the first is located in the position (xImax,yImax), and for the second, the coordinates (x¯,y¯) are determined by the discrete formulas of the first moment of distribution of intensity, with the equations:
In the same manner, the second moment of distribution of intensity provides the beam width for both coordinated axes, with the equations:
where (x−x¯) and (y−y¯) are the distances to the centroid.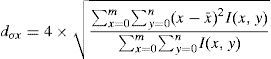

In addition to the moment method, there are alternative optomechanical techniques that use a detector and different types of shutters to obtain the beam width. One of them is the knife-edge method (Cohen, Little, & Luecke, 1984). This consists of sliding a knife in front of a detector to obstruct the beam in the direction of the Cartesian axis that is required to know the width. With that, the power transmitted as a function of the position of the knife is measured. The ISO 11146 standard establishes that for this method, the beam width is directly proportional to two times the distance existing between the positions of x1 and x2 of the knife. These positions are determined respectively by 84% and 16% of the power transmitted, as is indicated in the equation:
where K is the beam propagation factor (provided by the manufacturer) and 0.81 is the correlation factor between the knife-edge method and the standard method (moments). To use this technique, the laser beam study must have a diameter that is less than the active area of the detector and this, at the same time, must be less than the diameter of the knife.3Analyzer calibration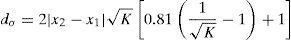
Calibration of the power and dimensional parameters was carried out with the experimental setup observed in Figure 4. The beam emitted from the laser passes through the analyzer where it is sampled and the information obtained is sent to a computer to be processed and analyzed. Upon exiting the analyzer, the beam continues its trajectory toward a knife-edge device with a two dimensional movement and an OPM. With this, total power values are obtained (open knife) as well as incidental power according to the position, necessary to determine the beam width.
4Results
The analysis of the profile was carried out with a DIAMOND 150K laser from Coherent Inc. This laser has a TEM00 and a maximum optical power of 275W (pulsed operation). The methodology to calibrate the measurement of power consisted of setting the laser pulse period at 100μs and later obtaining an average of 10 measurements taken with the analyzer and the OPM in a simultaneous manner, in a pulse width interval of between 6μs and 34μs. The comparison between the power measured by the analyzer proposed and the OPM can be observed in Figure 5. The curve represented by red blocks belongs to the average power values obtained with the analyzer and the blue diamonds represent the values obtained with the OPM. As a calibration reference an OPM model Field Master GS from Coherent Inc. was used. The error in the measurements of the analyzer in the 20W to 200W range was under 5%. This percentage is within the limit permitted by the IEC 61040 standard (IEC 61040, 1990), corresponding to this type of device.
 and the OPM (blue diamonds).")
Concerning the beam width, the analyzer requires calibration in the measurement of this parameter, due to the fact that the lower the power of the laser, the image of the profile shown in the computer will have smaller dimensions. This is due to the fact that the signal amplifier has a fixed gain. The laser manufacturer under study indicates a value of diameter of 7.0mm, with a tolerance of ±0.5mm and a K factor greater than 0.77. With the knife-edge method a beam width of 6.754mm in the x direction and 6.767mm in the y direction was obtained for this laser, which is within the tolerance indicated by the manufacturer. To compensate error in the measurement of the width, calibration curves that are shown in Figure 6 were obtained. In both graphs values obtained by the analyzer are represented by blue diamonds and the solid line is the calibration curve constructed with the expression shown (quadratic regression). With this adjustment, the device presented an error in the measurement of the width of less than 1.6% for both directions. For the dimensions of the rotating mirror, the maximum diameter that the analyzer can measure is 15mm.
 in direction x and (b) in direction y (solid lines). As well as the mathematical expressions that represent them. The blue diamonds show the values obtained by the analyzer.")
The graphical user interface of the analyzer, as well as the programming of data acquisition and algorithms for the calculation of laser parameters was developed with LabVIEW. The general screen for the GUI can be appreciated in Figure 7. The window on the right drop down the three dimensional representation (3D) of the beam profile in color map, in which red represents the greatest intensity and purple the minimum intensity. The intensity scale is normalized and spatial scales are represented in millimeters. In the same manner, the upper left window drop down the two dimensional profile (2D) with an automatic cursor at the maximum point of intensity. The resolution of both images is 64×64 pixels. On the other hand, the left central window shows the measurements made by the analyzer. A power measurement of 181.25W can be observed and beam widths of 6.77mm and 6.82mm in directions x and y respectively. Finally, the upper band shows the information of the laser under study uploaded previously by the user. The analyzer collects a profile every 10s and uses a National Instruments USB-6008 card to digitize the signal of detector model 450-3 from EDO Corp.
5Conclusions
The beam profile analyzer constructed can characterize pulsed CO2 lasers up to 200W with an error of less than 5% for the measurement of power. In the same manner, it can measure the width of the beam with an error under 1.6%. On the other hand, beam profile monitoring can be performed in line, since the rotating mirror interferes with the beam trajectory only 5% of the time. The analyzer can also be used in the study of carbon monoxide lasers, since their wavelength is found in the range operation of the pyroelectric detector used. Sampling speed and the resolution of the profile acquired, can be increased with a faster data acquisition system.
Conflict of interestThe authors have no conflicts of interest to declare.
Peer Review under the responsibility of Universidad Nacional Autónoma de México.