


The automotive supply chain industry is characterised for a well-known hierarchical structure, where manufactures exchange partially their forecasting with their first-tier suppliers as a requirements demand, which implies in the most of the cases that suppliers must be prepared for handling a variety of potential requirements. Moreover, considering technological tools for handling such variety are crucial for managing efficiently the decision-making in this domain. Therefore, this paper presents a simulation-based model to support the resource allocation decision-making process in a real automotive first-tier supplier UK company. Results shown that operations management is enhanced across the selected first-tier supplier by reducing the reworks, which leads to achieve its production targets.
Current globalisation phenomenon trends are implying that manufacturing management is moving towards strategic changes from local to global levels [10]. In this case, Just- In- Time (JIT) or lean manufacturing are required at production sites, which looks at well-managed information exchange synchronisation and material flow collaborations for activities among different tiers of suppliers and customers [4]. According to [8], companies that waged the achievement for JIT activities for three to five years have experienced a reduction cost of 20% to 40% of sales revenue due to a poor product quality. One of the well-positioned and representative industries that requires huge efforts in coordination the whole tiers in the supply chain is the automotive industry [3]. In this domain suppliers decision-makers should thusly make efforts to support the optimisation of the company’s supply chain activities in different stages of the operations processes, this within a view of running the business in a more profitable way. In a fact, as established by [7], simulation models are suggested for handling a variety of scenarios, since they might help to achieve the optimal cost-effective network design. Hence, and for the purpose of supporting the first-tier supplier decision-making, a discrete-event simulation-based model is considered for modelling the main manufacturing processes in an automotive industry in UK. For handling this endeavour, the following structure is considered. In the first place, a background is addressed for realising the key automotive supply chain decisions as well as to realise how simulation approaches can be considered in this kind of domain. Secondly, the simulation based modelling methodology is covered with a view of its real implementation. Next, the real case study for the UK’s automotive supply chain is described and the main experiments are tested. Finally, the main conclusions and further research are covered.
2Background2.1Decision-making in supply chainsBy the 1990s, when the concept of supply chain was arising, decision-makers were well experienced in mathematical and statistical techniques such as utility analysis, operations research, decision matrices and probabilistic decision trees. One of the main decisions in this industry was the selection of resource systems. These systems normally covers these requisites in different ways and not always considering all of them [15]. In fact, the best system approach for managing the organisations, within a supply context, should be decided by decision-makers using various methodologies. In this context, [14] propose different decision-making approaches which will be appropriate for different sort of analysis requirements, such as: process models, structural models, empirical methods and solutions. In a fact, [9] establishes that by supplying an adaptive problem-solving solution to a worker will help the business enterprise improve service and quality. Therefore, decision-making processes in supply chains can be covered from different perspectives and approached. One of the most well-known and relevant approaches are the simulation-based models, which combines process, structure and empirical approaches. This is approach is briefly described and analysed in the following section within a practical view in automotive supply chains.
2.2Simulation modelling in the automotive industryA production line is a bounded system that is dedicated to manufacture one or several standardised parts [16]. This system has an identifiable material flow, which remains the same each time that a new part is manufactured. Simulation modelling has demonstrated to be useful and applicable to almost any assembly or manufacturing production line including those of the automotive industry. In this context, simulation has become a powerful tool that is starting to be widely used in the main automotive companies and their suppliers. According to [19], the main generic applications of discrete-event simulation in the automotive industry are: (a) the designing of manufacturing system in its conceptual stage and testing operational policies during the launching phase; (b) the assessing of the performance of the manufacturing site when it is operating; and (c) Determining causes and solutions of operational problems that are affecting or might affect the desired performance of a manufacturing site.
In this context, [19] describe different case studies in which simulation modelling was applied in some major and small component plants. Some outstanding examples are the following:
Design of conveyor systems: simulation was used in an automotive assembly line to design a power and free conveyor. This conveyor was required to move a minimum number of carriers so that the manufacturing line could achieve its daily throughput.
Design of material handling systems: simulation was used in a stamping plant in order to determine the best possible material handling system and its policies. As a result, the plant was able to evaluate buffer space requirements.
Identification of bottlenecks in an instrument panel assembly line: Simulation was used to evaluate different ways in which the line could be arranged and the number of pallets needed to obtain the maximum output.
As it has been discussed, simulation modelling has several applications in the automotive industry. In fact, some of the first computer based simulations were carried out in this sector [19]. The possible reason for it is that the automotive industry requires high investments of money each time that a new plant, vehicle or assembly line is launched. Hence, simulation modelling can be seen as a powerful tool to design, assess and redefine processes within, especially in complex and dynamic environments such as the automotive industry.
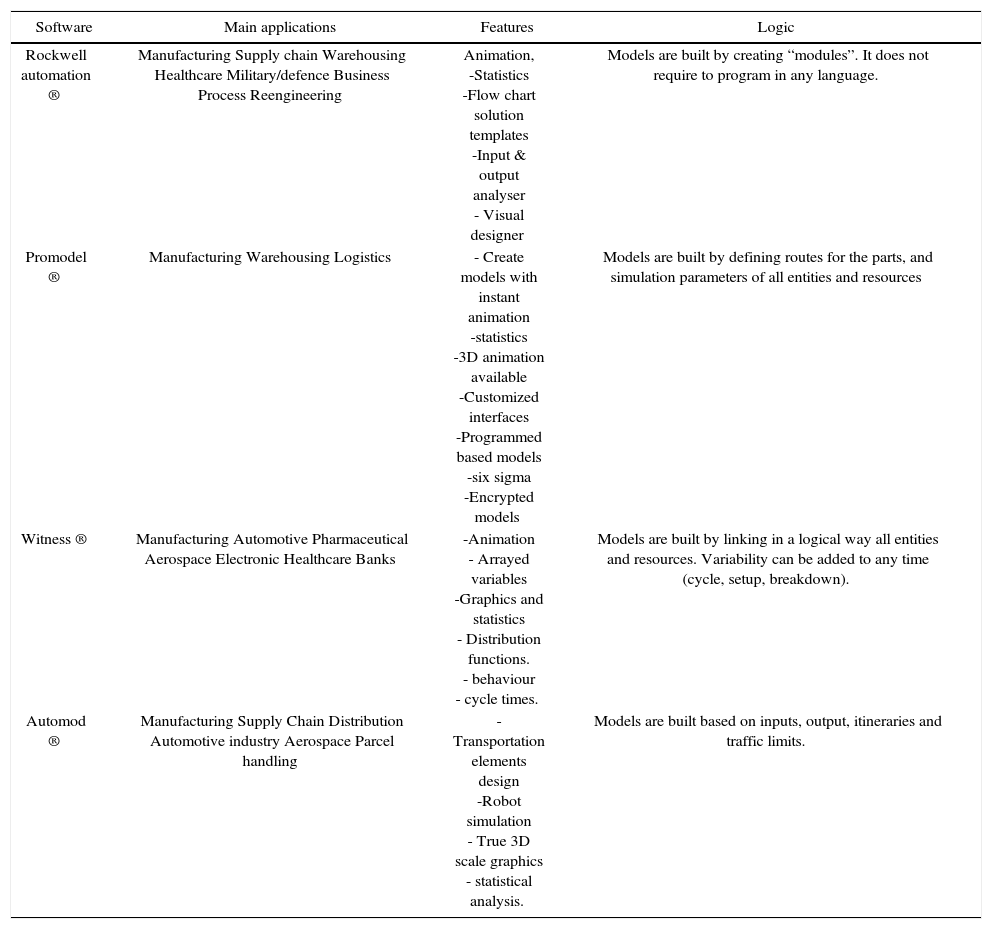
2.3Relevant discrete event based toolThe majority of the current simulation software packages are known as “Visual Interactive Modelling” [5]. This means that the model can be built as an animated representation that will show how the movement of the elements are actually deployed. Furthermore, the model can be built in several steps, can be changed at any of those steps, and can be tested when any of its variables are modified. The most common simulation software packages are Arena, AutoMod and Witness [10]. Regarding to this, Table 1 shows the main characteristics of the aforementioned software packages ([1]; [18]; [12]; [17] and [9]).
Relevant Simulation Tools.
| Software | Main applications | Features | Logic |
|---|---|---|---|
| Rockwell automation ® | Manufacturing Supply chain Warehousing Healthcare Military/defence Business Process Reengineering | Animation, -Statistics -Flow chart solution templates -Input & output analyser - Visual designer | Models are built by creating “modules”. It does not require to program in any language. |
| Promodel ® | Manufacturing Warehousing Logistics | - Create models with instant animation -statistics -3D animation available -Customized interfaces -Programmed based models -six sigma -Encrypted models | Models are built by defining routes for the parts, and simulation parameters of all entities and resources |
| Witness ® | Manufacturing Automotive Pharmaceutical Aerospace Electronic Healthcare Banks | -Animation - Arrayed variables -Graphics and statistics - Distribution functions. - behaviour - cycle times. | Models are built by linking in a logical way all entities and resources. Variability can be added to any time (cycle, setup, breakdown). |
| Automod ® | Manufacturing Supply Chain Distribution Automotive industry Aerospace Parcel handling | - Transportation elements design -Robot simulation - True 3D scale graphics - statistical analysis. | Models are built based on inputs, output, itineraries and traffic limits. |
When attempting to start a simulation project many questions come to the analyst’s mind such as: what is the first step?, what are the system’s boundaries?, does every single variable in the system need to be modelled?, what kind of data are available?, who can help to understand the process?, how many weeks will be necessary to model the system?. Hence, to cope with these questions, a methodology can be addressed considering the following three steps [6]:
- Step 1.
Conceptual modelling, which is one of the key step when carrying out a simulation project. According to [9], the first step of defining a conceptual model is called “visualisation”. In order to do that, the analyst needs to perform several activities. Once this has been done, the objectives and the scope of the model can be proposed.
- Step 2.
This step is named analysis [6]. At this stage, the analyst collects and analyses the available documents and information about the process; however, not all the necessary data might be available. When data is unavailable but needed, the analyst needs to do some assumptions and agree those assumptions with the company.
- Step 3.
This step is oriented to create the necessary documentation to conceptualize the system. Product flows, information flows and decision flows can be mapped [6]. In order to do so, the analyst must observe, analyse, and understand the process.
After these three steps are covered, the modelling process can start. For this, three additional steps to build a model in Witness are suggested as follows:
- Step 4.
Defining stage. In this step, the analyst decides the types of elements that are needed to build the model.
- Step 5.
Displaying stage. At this stage it is possible to define how the elements will be displayed in the simulation screen. Icons can be selected from the Witness menu or can be imported as images from other files.
- Step 6.
Detailing stage. The logic of the model is designed at this stage. In this step, the analyst sets details to all elements.
Finally, a correction phase must be considered as a preventive or a corrective step. This means that the correct model will not necessarily be built at the first attempt. Once all the parties validate the model, it is possible to start with the next stage of the methodology that is experimentation as the final step.
4Simulation modeling of the automotive first tier companyThe aim of this model is to explain in detail how the modelling steps has been applied to a real automotive industry. This in order to provide information about visualization (company overview, identification of team members, definition of objectives and scope), analysis (analysis of the process in existing documents), Conceptualisation (flowcharts and a value stream map) and modelling (for the explanation of the three main stages to develop a model in Witness®).
4.1Company overviewThe company understudy is a first-tier supplier of a large automotive supply chain industry in the UK which has around 73 manufacturing facilities in 15 countries across the three main geographic regions: Asia, Europe and North America. This company supplies interior components and systems to almost all the Original Equipment Manufacturer (OEMs). Multinational firms such as Ford Motor Company, Jaguar, Land Rover, Suzuki, Toyota, Audi, BMW, Volvo, Volkswagen, Renault, Chrysler, and Ferrari are included in the company’s broad portfolio. The main products that the company supplies to the automotive market are: instrument panels, consoles, cockpits, flooring and acoustic systems, door and trims systems, headliners, overhead systems and some exterior components. Currently, the company is supporting the Manufacturer with spare parts for two products: model L359 and the model L538. Hence, the company started facing several issues when the demand of the L538 suddenly rose from 72,000 units to 113,000 per annum. This unexpected demand led the company to make unplanned decisions about buying equipment and hiring people. In addition, during the first period, the real assets planning is not accurate because the aforementioned reasons, hence improvements are required in terms of planning better machines capacities and allocations, inventory control, human resources in order to reduce the unexpected operational costs.
4.2Identification of team membersThe identification of team members was one of the main issues during the simulation model development. In this context, the Launch Manager has been identified as the one who set the objectives and scopes for simulation model. The key experts from whom data was provided were the manufacturing engineer, the Industrial engineer, the quality supervisor, the Material Planning and Logistics analysts, and the operators and team leader from the leather wrapping manufacturing line. These team members compose the human resources to be considered in the simulation model.
4.3Model objectives and scopeThe model domain focuses on the leather wrapping manufacturing line. In here, the Launch Manager chooses this area for two main reasons. In the first place, this is one of the new areas of the company and, in the second place, the optimum number of operators at each cell is presented as a difficult figure to determine. This implies that solutions are needed further in order to support the required planning improvements and cost reductions. Therefore, the main objectives for this model are: assess how changes in the number of operators can impact the daily throughput and evaluate what are the main bottlenecks within the manufacturing line and what is their impact on the daily throughput. For this purpose, the simulation model is oriented to assess the potential benefits of using simulation for improving the planning process in this first-tier company.
4.4Analysis of the previous and existing documentationThe documentation provided by the company was a flowchart, a failure mode and effects analysis, scrap and rework data, daily polyurethane and leather throughput, the layout of the area, the cycle-times and the actual number of operators. This data is to be considered as main inputs for the simulation model.
4.5Process descriptionThe process consists mainly of the leather wrapping, which is held at production line. Two main parts for the instrument panel of the L538 model are manufactured. These parts are “knee rolls” and “toppers”. Knee rolls are composed by driver knee rolls and passenger knee rolls. All knee rolls and toppers can be wrapped with two different materials: leather and polyurethane (PU). The mix will vary depending on customer demand. Both knee rolls and toppers are manufactured for right and left hand vehicles. The leather wrapping line supplies knee rolls and toppers to the main assembly line in which the final product is assembled and then shipped to the final customer on a Just-in-Time (JIT) basis. Since the cycle-time of the leather wrapping area is longer than the assembly line, two days of inventory are required between these two lines in order to avoid shortages and avoid economic penalties from the Manufacturer. In addition, the leather wrapping area is working based on 2 shifts of 12 hours each, whilst the main assembly line works based on 2 shifts of 8 hours each.
Moreover, the leather-wrapping line is supported by one automated conveyor. This conveyor considers 48 fixtures assembled to it. Each fixture is designed to hang 2 items of the same product. The items that are needed to build one complete vehicle set are: passenger knee roll substrate, driver knee roll substrate, passenger jacket, driver jacket, topper substrate, and topper jacket. There are 8 different types of fixtures assembled in the conveyor (Right hand topper substrate, Left hand topper substrate, Right hand topper jacket, Left hand topper jacket, Right hand knee roll substrates, Right hand knee roll jackets, Left hand knee roll substrates and Left hand knee roll jackets). Then, and during the leather wrapping process, both knee rolls and topper substrates are wrapped with leather or polyurethane jackets. Substrates and jackets are documented, picked and loaded into the fixtures and moved by the conveyor through the line (See Figure 1 for visualising the loading process in the company)

The conveyor considers a transfer time of 10 sec, which leads to a robot zone. Hence, the conveyor moves the substrates to a first robot which sprays the substrates with fire. Then, the conveyor goes forward to the next two robots which sprays both fixtures and jackets with glue. Once this process has finished, the conveyor moves the fixtures to the oven, which capacity is 17 fixtures maximum. When the substrates and the jackets go out from the oven, they are wrapped in four different cells (see Figure 2).

Two cells are dedicated to knee rolls and two cells to toppers. The wrapping process is comprised of three main operations: stitch alignment and glue activation in the prefix tables and jigs, wrapping in the automated presses and finishing at the rework station. Leather toppers are stapled after the automated press process. Therefore, flowcharts and Value stream maps (VSM) are modelled based on the interviews within the operators and supervisors. Within the VSM model (see Figure 3), the ‘rework’ process can be seen, in a fact, as the bottleneck of the manufacturing line in the company.
4.6Modelling
The following considerations have been taken into account:
- a)
Substrates and jackets are always available to be loaded into the fixtures.
- b)
The index time of the conveyor is 50 sec.
- c)
The daily demand is 30 sets per hour.
- d)
The loading sequence of parts into the conveyor was considered as fixed. This means that the line will produce 50% of left hand sets and 50% of right hand sets.
- e)
The line is operating 2 shifts of 12 hours each
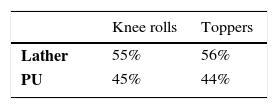
- f)
The mix of Leather/PU of knee rolls and toppers was calculated as the average of a 30 days throughput period. This mix is presented in Table 2.
- g)
The time that the glue robot takes to process the parts is 50 sec. However, important is to highlight that there is a difference between each kind of part that makes it difficult for the company to calculate their possible daily throughput. The observed times will be detailed later in this section.
- h)
The time of minor tasks such as transporting parts from one point to another or unloading parts was included in the cycle-time of the machines.
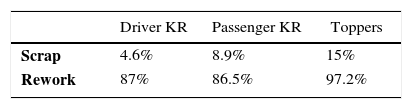
Considering this information, the scrap and rework percentages were calculated as the average of the daily throughput of 60 days. These percentages are shown in Table 3.
5The simulation modelThe simulation model process starts by defining which entities will be interacting and how. Considering the continuous observation of the process, it has been identified that the resources in the assembly line are the following: 1 Indexed Fixed Conveyor, 1 Fire spraying robot, 2 Glue spraying robots, 1 Oven, 1 jig for left hand passenger knee rolls, 1 jig for left hand driver knee rolls, 1 jig for right hand passenger knee rolls, 1 jig for right hand driver knee rolls, 1 jig for left hand toppers, 1 jig for right hand toppers, 1 press for right hand knee rolls, 1 press for left hand knee rolls, 1 press for right hand toppers, 1 press for left hand toppers, 1 stapling station and Buffers.
Relevant buffers to be considered are: Raw material buffers (the model will assume that raw material is always available), WIP between the glue line and the jigs (Knee rolls and toppers), WIP between the jigs and the presses (Knee rolls and toppers), WIP between the presses and the SIP station (Knee rolls and toppers), WIP between the presses and the Stapling station (Leather toppers only), WIP between the SIP station and the Rework station (Knee rolls and toppers), and Finished goods (knee rolls and toppers). In general, the following elements are to be considered in the simulation model:
- -
Parts and buffers: Active parts are assembled into fixtures at the loading station (this will be explained at the detailing stage).
For this reason, fixtures were displayed with different colours so that the operator can distinguish them in the conveyor.
- -
Conveyor: The indexed fixed conveyor was displayed in 8 sections (c1 to c8). The line has 3 robots (R1 that hits with fire and R2, R3 that hit with glue), and one oven.
- -
Machines: All machines are displayed with their queue as a counter or as a queue and their state.
- -
Manufacturing cells: The line has four manufacturing cells: left hand knee rolls, right hand knee rolls, left hand toppers, and right hand toppers. Figure 4 shows how the complete model was displayed in Witness.

In addition, the manufacturing line considers four main processes: loading, prefixing, pressing, and stapling. All the elements of each cell have been defined within different modules in Witness®. This makes easy to manipulate and understand the model. The defined modules are the following:
- a)
Loading station: This station assumes that all parts are ready to be loaded into the fixtures. The base model has 2 operators as loaders. These operators were defined as assembly machines (labour 3 and labour 4) because they will assemble substrates and jacket into the fixtures.
- b)
Conveyor: The indexed fixed conveyor has an index time of 1min (50 index time + 10 sec transfer time) in all of its sections. All sections together including the 3 robots and the oven have a capacity of 48 fixtures that is the capacity of the real conveyor.
- c)
Knee Roll Cells (Left Hand and Right Hand) Both left hand and right hand cells have the same logic, number of resources and cycle times.
There is a buffer of work-in-progress parts (WIP) after each process and the cycle-time of the Passenger Jig which is different for leather jackets and PU jackets. For this reason, an integer attribute “Time_Jackets” was defined and assigned to the leather and PU jackets. Leather jackets take 3.2min to be processed whilst PU jackets take 2.9min. It is important to mention that jackets are not differentiated from leather or PU at the loading station. Therefore, the machine “Labour 4” sends all jackets to a cell of machines that will take the jackets and create 55% of leather jackets and 45% of PU jackets. The cycle time of this operation is 0.0001min; hence, it does not affect the final throughput.
6Experiments and analysis.The simulation experiments were performed in order to measure and understand issues such as: evaluate the current state of the leather wrapping manufacturing line, identify its bottlenecks and its maximum throughput, test different scenarios where the number of operators at each cell will be modified, analyse the impact that the ‘rework’ process has in the daily throughput and run one stochastic experiment considering the machines cycle-times as the source of randomness of the model. In addition, and since this process there are 3 breaks during a 12 hours shift. These breaks represent one hour, al the experiments were run in a 12 hours shift in a steady state.
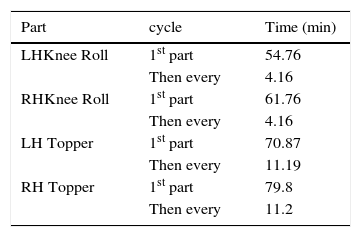
6.1Current stateThe ‘base model’, or Scenario 1, was designed with the data provided by the company. The model assumes that all parts are available and ready to be loaded into the fixtures. All cycle-times are deterministic and the base model ignores breakdown and maintenance times (see Table 4).
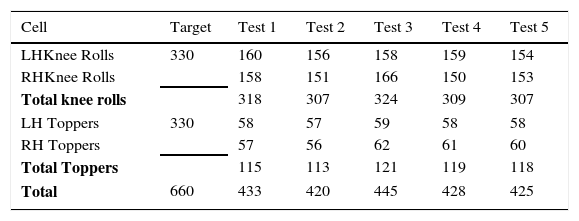
The maximum throughput of the model is presented in Table 5. This model does not consider breakdowns. Five tests were ran using different streams of part numbers (PRNs).
Throughput Base Model.
| Cell | Target | Test 1 | Test 2 | Test 3 | Test 4 | Test 5 |
|---|---|---|---|---|---|---|
| LHKnee Rolls | 330 | 160 | 156 | 158 | 159 | 154 |
| RHKnee Rolls | 158 | 151 | 166 | 150 | 153 | |
| Total knee rolls | 318 | 307 | 324 | 309 | 307 | |
| LH Toppers | 330 | 58 | 57 | 59 | 58 | 58 |
| RH Toppers | 57 | 56 | 62 | 61 | 60 | |
| Total Toppers | 115 | 113 | 121 | 119 | 118 | |
| Total | 660 | 433 | 420 | 445 | 428 | 425 |
It can be seen from Table 5 that the output of the model is far from the target of the company, which has been validated by the company. In here, topper cells are producing just the 35% of the objective. The Witness statistics highlights the ‘Rework’ process as the bottleneck of the cell. The WIP buffers before this process have 98 pieces waiting to be processed. Hence, to support the main experiments, and considering the company requirements, four additional scenarios have been considered (using different streams of PRNs) in order to produce a solution direction that will be useful for the company in order to reduce their rework activities.
6.2Scenario 2It considers the same operator for handling the ‘prefix table’ and ‘press’ processes in all cells. From this scenario, parts are produced at the same rate as the base scenario, but the percentage of ‘Busy’ time was increased by roughly 9% in all cases where the labour was modified.
6.3Scenario 3It tests the behaviour of the system when both cells of knee rolls and toppers share the same operator for the ‘SIP’ process. The throughput of this scenario remains constant even when the number of operators was reduced in the SIP station.
6.4Scenario 4It tests the behaviour of the system when one Rework station is added to the left hand toppers cell. The throughput of this scenario shows that the output of the left hand topper cell was increased by roughly 50%. In addition, both operators at the Rework stations in the left hand topper cell are more than 90% busy. However, the buffers of WIP before the rework station have 36 parts waiting to be processed. Then, adding one Rework station was not enough to achieve the daily target.
6.5Scenario 5It was designed to assess the impact of having three operators at the loading station. Considering that three operators might be able to load up to 1026 fixtures per shift. In here, the ‘toppers’ output remains the same since the bottleneck does not allow producing more parts even when more fixtures were loaded. Hence it is pointed out to the company that three operators might be the maximum number of operators recommended at this station.
Based on the aforementioned experiments, Figure 5 shows the variability in the throughput when the rework percentages are reduced. For this analysis, and considering the company recommendations, experiment assumes one breakdown each 60minutes. The repairing time was assumed as 8minutes. In this way, the line stops 96minutes, which is roughly 15% of the whole shift.

Figure 5 shows the difference in the throughput for each scenario. It can be seen from Figure 5 that if the company is able to reduce their rework, they might be able to achieve the goal of 30 sets per hour. If the company is able to improve their quality control and reduce their rework up to 30%, it would possible to reach their daily target. Within this information, the company will be able to plan better their resource allocation, especially when the manufacturer demand and requirements fluctuates, sometimes, unpredictably.
7ConclusionsThis paper has presented the application of process modelling techniques in order to analyse a real manufacturing line and to provide recommendations to a global first-tier supplier in the UK’s automotive industry. Considering the main requirements from the first-tier supplier, the base simulation model has shown that the leather wrapping line is unable to reach its daily target, the ‘rework’ process is the bottleneck of both, left hand and right hand topper cells, the operators at the prefix table, SIP, and press processes are busy less than 50% of their available time and the operators at the loading station are busy 100% of their available time. One operator is able to load 342 fixtures. The maximum number of fixtures that can be loaded in one shift is 720. From the simulated scenarios it has been found that the number of operators is not the only variable that needs to be changed in order to increase the throughput of the line. Hence, reducing the percentage of reworked pieces has been found as the way in which the daily target might be reached. Therefore, by considering this simulation-based model, the manufacturing process increases its throughput when 3 operators are working at the loading station and one operator is added to the rework process in the topper cells. In this context, the simulation-based approach can be seen as a flexible and adaptable way for experimenting and understanding different scenarios. With this, potential risks of implementing untested solutions are avoided and better planning proposals as well as handling and managing fluctuating manufacturer requirements becomes a more accurate process through the experimentation process. As further research it is expected to extend the simulation model to more first and second tier supplier to support an integrated decision-making process among the automotive supply chains. In addition, consider a data collection from a longer horizon will be a task to be considered in further developments of this simulation model.