


Background/Objective: Stress is perceived differently across individuals, which might be particularly true for nonclinical and clinical subjects. For this reason, we tested a German adaption of the 10-item Perceived Stress Scale (PSS-10) for model fit and measurement invariance in a big nonclinical and clinical sample. Method: We (1) conducted multiple confirmatory factor analysis (CFA) in 1,248 nonclinical subjects and 575 outpatients, (2) measurement invariance with multigroup CFA, (3) assessed correlations with relevant constructs and (4) calculated internal consistencies for overall stress and the subscales Helplessness and Self-efficacy. Results: In both samples, CFA revealed a robust two-factorial structure with an excellent model fit. Group comparisons revealed strict measurement invariance. Correlations with associated measures support validity. Internal consistencies were good to very good. Conclusions: We show highly satisfactory psychometric properties of the German PSS-10 for nonclinical and clinical individuals. Measurement invariance analyses demonstrated that varying stress levels of people with a different mental health status are due to true interindividual differences.
Antecedentes/Objetivo: El estrés se percibe de manera diferente entre los individuos, lo que podría ser particularmente cierto para los sujetos no clínicos y clínicos. Por esta razón, probamos una adaptación alemana de la Perceived Stress Scale de 10 ítems (PSS-10) para el ajuste del modelo y la invarianza de la medición en una gran muestra clínica y no clínica. Método: Realizamos (1) un análisis factorial confirmatorio múltiple (CFA) en 1.248 sujetos no clínicos y 575 pacientes ambulatorios, (2) invarianza de medición con CFA multigrupo, (3) correlaciones con constructos relevantes y (4) cálculos de la consistencia interna para la escala general y las subescalas Desvalidez y Autoeficacia. Resultados: En ambas muestras, el CFA reveló una estructura robusta de dos factores con un excelente ajuste del modelo. Las comparaciones grupales indicaron invarianza estricta. Las correlaciones con las medidas asociadas respaldan la validez. Los coeficientes de consistencia interna fueron buenos a muy buenos. Conclusión: Mostramos propiedades psicométricas altamente satisfactorias de la version alemana de la PSS-10 para individuos no clínicos y clínicos. Los análisis de invarianza de medición demostraron que los niveles variables de estrés de las personas con un estado de salud mental diferente se deben a diferencias interindividuales verdaderas.
Stress is a major contributor to both physical and mental illness (Cohen, Murphy, & Prather, 2019; Wessa, Perlini, & Brambilla, 2015; Zorn et al., 2017). In order to understand the etiological relevance of stress, we have to illuminate how stressors are subjectively perceived. According to the transactional stress model (Lazarus & Folkman, 1984), subjective stress typically occurs when situations are appraised as threatening and the environmental demands exceed an individual's coping resources. In line with this idea, research has shown that the mere exposure to a stressor (e.g., life events) or the presence of physiological stress symptoms (e.g., elevated cortisol levels) do not necessarily result in subjective stress (Campbell & Ehlert, 2012; Galatzer-Levy, Huang, & Bonanno, 2018). Instead, we have to take into account that the cognitive appraisal of an objective stressor essentially contributes to the overall degree of perceived stress (Conway, Rutter, & Brown, 2016).
A commonly used instrument to assess perceived stress is The Perceived Stress Scale (PSS; Cohen, Kamarck, & Mermelstein, 1983). The PSS assesses the degree of how individuals perceive situations in their lives as uncontrollable, unpredictable and overloaded relative to their subjective coping abilities (Cohen et al., 1983) as represented by the two subscales Perceived helplessness (PH) and Perceived self-efficacy (PSE). There has been an ongoing discussion whether the questionnaire is best described by two subscales or rather unidimensional (Cohen et al., 1983; Taylor, 2015). However, most studies have agreed on the two-factorial structure and that a subset of 10 out of 14 original items reflect the best psychometric properties. To date, the 10-item version (PSS-10) is internationally widely use (Nielsen et al., 2016; Taylor, 2015). Unlike other stress scales, the PSS is an economic tool to measure the interplay between the two dimensions and offers additional value to stress research, since its items do not only assess certain areas of life (e.g., work or social stress, as assessed in the Stress Reactivity Scale; Schlotz et al., 2011), do not concentrate on isolated aspects of stress theory exclusively (e.g., only asking for demands, Stressful Life Event Questionnaire; Roohafza et al., 2011; or resources, Coping Competence Questionnaire; Schroder & Ollis, 2013) and do not contain a large number of items (e.g., Stress Overload Scale, Amirkhan, 2012; Trier Inventory of Chronic Stress, Petrowski, Paul, Albani, & Brähler, 2012).
It is well understood that stress has negative effects on mental health (Francisco, Arce, Vílchez, & Vales, 2016). Amongst others, helplessness seems to be an essential component of psychopathological symptoms (Zahn et al., 2015), whereas self-efficacy can alleviate the effects of stressors on psychopathology (Guerra, Cumsille, & Martínez, 2014; Schönfeld et al., 2016). Given the fact that the report of internal states is highly influenced by the presence or absence of psychopathological symptoms (Gorlin et al., 2019), it becomes clear that the validity of a questionnaire like the PSS might be influenced by the characteristics of the sample it is administered in, because the nomological relations of a latent construct can strongly depend on the source of data (Skorikov & VanderVoort, 2003). From a psychometric perspective, testing whether the same instrument can be adequately used in multiple samples is essential, as a profound interpretation of results can only be ensured this way (Guillot-Valdés, Guillén-Riquelme, & Buela-Casal, 2019).
Interestingly, only one study has directly compared the two-factorial structure of the PSS between nonclinical and clinical subjects in an English-speaking population (Lavoie & Douglas, 2012), which is surprising given its frequent use in both populations (e.g., Denovan, Dagnall, Dhingra, & Grogan, 2019; Khalili et al., 2017). To find out about group differences, the authors performed multiple group confirmatory factor analysis (MGCFA). MGCFA has its roots in structural equation modelling and tests if a model and its manifest and latent properties are the same (invariant) across different subgroups, which, in turn, allows to draw inferences about the validity of group comparisons. Lavoie & Douglas (2012) only found configural (weak) invariance between a large psychiatric and a community sample, meaning that the overall construct of stress was measured differently in both populations and could not be interpreted equally. Furthermore, they used the 14-item version although to date the 10-item version is being preferred in a vast number of studies. After testing several models, they concluded an 11-item version fit their data best, which is contradictory to most research on the PSS model structure. Given the relevance the PSS has for clinical stress research, we are convinced that more empirical data is needed to clarify the latent structure of the questionnaire.
To the best of our knowledge, no study has investigated the latent construct of stress in the German PSS-10 for both nonclinical and clinical individuals. For this reason, we aimed to test several model structures and to compare them in both groups. Based on previous findings, we hypothesized a two-factorial model structure to show the best fit. To evaluate the models, we first performed CFA in both samples. Second, we compared both populations via MGCFA and tested for measurement invariance.
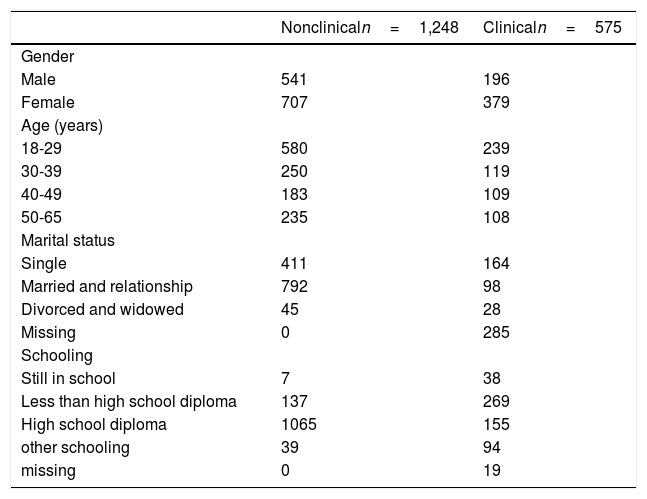
MethodParticipants and ProcedureData of the nonclinical sample was incidentally derived from online surveys carried out between November 2015 and February 2016, yielding N=1,248 individuals (541 men) aged between 18 and 65 years (M=34.89, SD=13.06). A majority of the subjects indicated to be in a relationship or married (63%) and to have a high school diploma (85%) (Table 1). Data of the clinical sample was incidentally collected between September 2016 and March 2017 from N=575 outpatients (196 men, 19-64 years, M=36.23, SD=12.53) waiting for or currently undergoing psychotherapy. Most subjects were single (57%) and had a high school diploma (28%) or less (48%). Amongst others, the most frequent diagnoses were affective (36%) and anxiety disorders (28%) with most patients having comorbidities as well (Table 1). The samples differed with regard to age (F(1821)=4.24, p=.04) and gender (χ2(1, N=1,823)=248.43, p<.001). As our data collection started before similar PSS versions were introduced (Klein et al., 2016; Reis, Lehr, Heber, & Ebert, 2017), we decided to stay with our version since we aimed at a congruent comparison of our nonclinical and our clinical sample. All subjects indicated German as their mother tongue and gave their written informed consent prior to the study. All studies were conducted in accordance with the Declaration of Helsinki and were approved by the local ethics committee at the University of Mainz.
Sociodemographic characteristics of nonclinical and clinical subjects.
| Nonclinicaln=1,248 | Clinicaln=575 | |
|---|---|---|
| Gender | ||
| Male | 541 | 196 |
| Female | 707 | 379 |
| Age (years) | ||
| 18-29 | 580 | 239 |
| 30-39 | 250 | 119 |
| 40-49 | 183 | 109 |
| 50-65 | 235 | 108 |
| Marital status | ||
| Single | 411 | 164 |
| Married and relationship | 792 | 98 |
| Divorced and widowed | 45 | 28 |
| Missing | 0 | 285 |
| Schooling | ||
| Still in school | 7 | 38 |
| Less than high school diploma | 137 | 269 |
| High school diploma | 1065 | 155 |
| other schooling | 39 | 94 |
| missing | 0 | 19 |
| Main diagnosis | n | comorbidity1 |
| Affective disorders | 163 | 107 |
| Psychotic disorders | 9 | 3 |
| Substance abuse and dependency | 1 | 1 |
| Anxiety disorders | 126 | 96 |
| Somatoform disorders | 51 | 44 |
| Eating disorders | 38 | 33 |
| Sleep disorders | 1 | 1 |
| Adjustment disorder | 12 | 5 |
| Sexual and sexual identity disorders | 2 | 1 |
| Personality disorders | 21 | 17 |
| Other | 25 | 15 |
| No final diagnosis yet2 | 126 | - |
Note. 1Absolute and relative number of people with one or more comorbidities within one of the categories shown on the left. 2All patients underwent a structured diagnostic interview (SCID-I and SCID-II; Wittchen, Wunderlich, Gruschwitz, & Zaudig, 1997). Patients waiting for psychotherapy did not have a verified diagnosis yet.
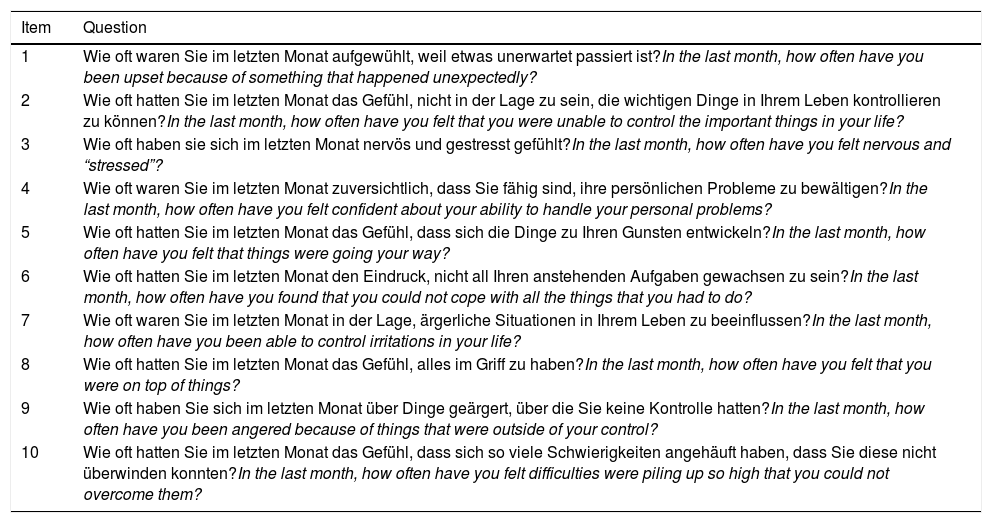
The PSS-10 was translated and back-translated by two independent native German and English speakers, both with a degree in psychology. Wording incongruities were discussed in an expert committee and conferred with a native speaker. The questionnaire consists of 10 items, each beginning with “In the last month, how often have you …” and has a 5-point Likert scale ranging from 1 (never) to 5 (very often). The PH scale consists of the six negative worded items (1, 2, 3, 6, 9, and 10) and the PSE scale contains the four positive worded items (4, 5, 7, and 8). The total score (PSS-TOTAL) is computed by reversing the PSE items and summing up all items. Higher scores reflect greater levels of perceived stress. Instructions and items can be retrieved from Appendix 1.
To find out about associated constructs in the clinical sample, we used the 53-item Brief Symptom Inventory (BSI; Franke, 2000) with the main subscale Global Severity Index (GSI), as a measure for symptom severity. The BSI has been validated in the German population and internal consistency of the GSI scale is excellent. Furthermore, we asked participants about their overall physical health (1 item) and mental health (1 item) in the last month using visual analogous scales (VAS), both ranging from 1 (very bad) to 9 (very good).
In the nonclinical sample, we also used the VAS named above and a well-being questionnaire to assess a related construct, as perceived stress and well-being are often investigated together (Wersebe et al., 2018). The WHO-5 has been well validated in numerous populations and shows good internal consistency of α=.84 (Bech, Olsen, Kjoller, & Rasmussen, 2003).
Data analysisCFA was calculated using the Bollen-Stine bootstrapped maximum likelihood (ML) estimation method in SPSS AMOS 23 (Arbuckle & Wothke, 1999). Given the variety of different PSS models claimed in the literature, we tested a (1) one-factor model (overall stress) and (2) a two-factor model (PH and PSE). For model evaluation, we used the comparative fit index (CFI), the Tucker-Lewis index (TLI), the root mean square error of approximation with 90% confidence intervals (RMSEA) and the standardized root mean square residual (SRMR). According to the criteria by Hu & Bentler (1999), values close to or higher than .95 for CFI and TLI; close to or smaller than<.06 for RMSEA and<08 for SRMR indicated a good fit. For competing models, lowest values of the Akaike Information Criterion (AIC) and the Bayesian Information Criterion (BIC) represented measures for parsimony and served as indicators for the favored model.
For group comparisons, we applied hierarchical nested modelling following the MGCFA procedure stated by Vandenberg & Lance (2000). In MGCFA, invariance is tested by restricting different model parameters in a stepwise fashion and comparing the resulting models between several groups (here: clinical vs. nonclinical). If the model fit does not worsen significantly, one can infer that latent group differences are caused by true interindividual differences. Here, we concentrated on equal form, equal factor loadings and equal intercepts and therefore gradually tested configural, metric and scalar invariance (CI/MI/SI) (Putnick & Bornstein, 2016). A more restrictive model was only nested if invariance of the preceding model held. Invariance was considered given if parameter changes for CFI, TLI, RMSEA and SRMR were no bigger than Δ=+/-.01 (Cheung & Rensvold, 2002).
Descriptive analyses (means, standard deviations) as well as Student's t-tests, Spearman's rank correlations and internal consistencies (Cronbach's alpha) and were performed using SPSS 23.0. p-values<05 indicated statistical significance. Correlations of r=.20, r=.50 and r=.80 were interpreted as small, moderate and strong (Cohen, 1992).
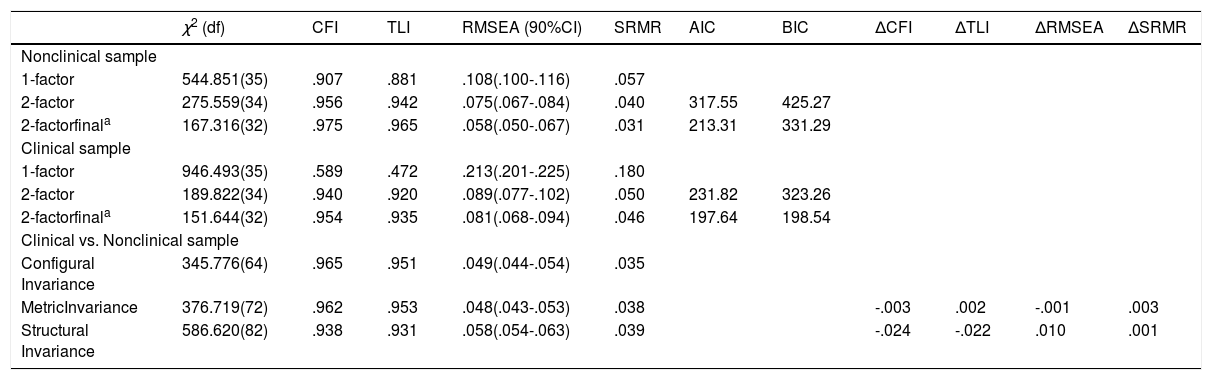
ResultsTests of factor modelsSince most studies on the PSS have been conducted in nonclinical individuals, we first tested competing models in the nonclinical sample. The one-factor model fit the data poorly. The two-factor solution fit the data well with the factors correlating at r=-.85 (see Table 2 for the statistical indices of every model). Since the two-factor solution was the most parsimonious, it was chosen as most viable PSS-10 model.
Goodness-of-fit statistics for different PSS-10 models and multigroup confirmatory factor analyses in nonclinical vs. clinical individuals.
| χ2 (df) | CFI | TLI | RMSEA (90%CI) | SRMR | AIC | BIC | ΔCFI | ΔTLI | ΔRMSEA | ΔSRMR | |
|---|---|---|---|---|---|---|---|---|---|---|---|
| Nonclinical sample | |||||||||||
| 1-factor | 544.851(35) | .907 | .881 | .108(.100-.116) | .057 | ||||||
| 2-factor | 275.559(34) | .956 | .942 | .075(.067-.084) | .040 | 317.55 | 425.27 | ||||
| 2-factorfinala | 167.316(32) | .975 | .965 | .058(.050-.067) | .031 | 213.31 | 331.29 | ||||
| Clinical sample | |||||||||||
| 1-factor | 946.493(35) | .589 | .472 | .213(.201-.225) | .180 | ||||||
| 2-factor | 189.822(34) | .940 | .920 | .089(.077-.102) | .050 | 231.82 | 323.26 | ||||
| 2-factorfinala | 151.644(32) | .954 | .935 | .081(.068-.094) | .046 | 197.64 | 198.54 | ||||
| Clinical vs. Nonclinical sample | |||||||||||
| Configural Invariance | 345.776(64) | .965 | .951 | .049(.044-.054) | .035 | ||||||
| MetricInvariance | 376.719(72) | .962 | .953 | .048(.043-.053) | .038 | -.003 | .002 | -.001 | .003 | ||
| Structural Invariance | 586.620(82) | .938 | .931 | .058(.054-.063) | .039 | -.024 | -.022 | .010 | .001 | ||
Note. The final 2-factor model was compared with the unmodified 2-factor model; a in the final model, errors of items 1 and 3 and items 1 and 9 were freed to correlate; df=degrees of freedom; CFI=Comparative fit index; TLI=Tucker-Lewis index; RMSEA=root mean square error of approximation (90% confidence interval shown in brackets); SRMR=standardized root mean square residual; Δ=difference; configural invariance=equal form; metric invariance=equal loadings; structural invariance=equal intercepts.
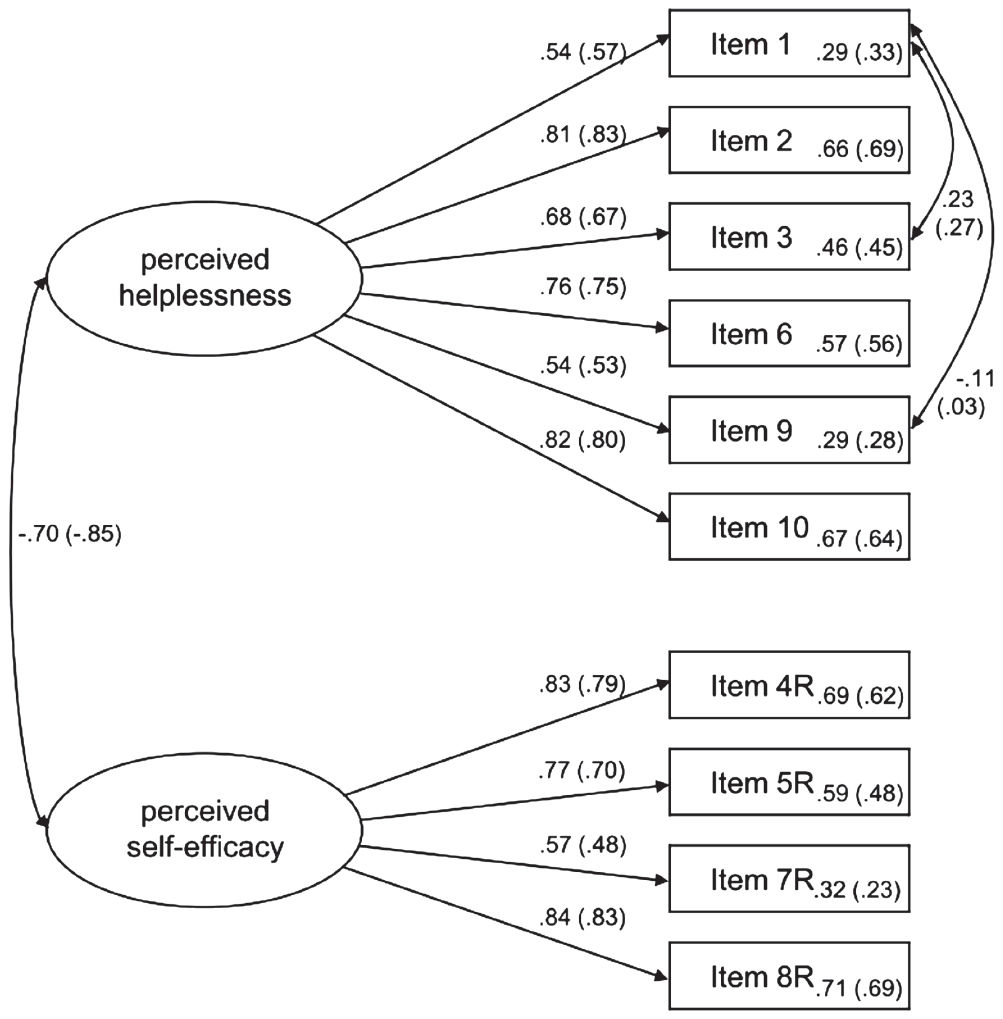
In a next step, we checked modification indices for significant residual correlations to uncover potential method bias. Accordingly, the residuals of items 1 and 9 and items 1 and 3 were freed to correlate (all belonging to the PH subscale; see Fig. 1). Following these adjustments, the overall model fit improved and appeared to be excellent, resulting as final PSS-10 model (χ232=167.316; p<.001; CFI=.975; TLI=.965; RMSEA=.058[.050-.067]; SRMR=.031).
 in nonclinical and clinical subjects; statistical indices from nonclinical subjects are shown in brackets. Factor loadings are shown above the arrows, communalities are shown next to the Items. Items 4, 5, 7 and 8 are reverse-scored (R). Items 2 and 8R served as marker variables. Residuals of items 1/3 and items 1/9 were freed to correlate.")
Final PSS model retrieved from CFA (standardized solution) in nonclinical and clinical subjects; statistical indices from nonclinical subjects are shown in brackets. Factor loadings are shown above the arrows, communalities are shown next to the Items. Items 4, 5, 7 and 8 are reverse-scored (R). Items 2 and 8R served as marker variables. Residuals of items 1/3 and items 1/9 were freed to correlate.
For the clinical sample, we calculated the same models (Table 2). Again, we found the 2-factor solution with correlating residuals to have the best overall fit (χ232=151.644; p<.001; CFI=.954; TLI=.935; RMSEA=.081[.068-.094]; SRMR=.046) with both factors correlating at r=-.70 (for the final model, see Fig. 1). Item loadings ranged from .48 to .83 (nonclinical) and .54 to .84 (clinical).
Group comparison for nonclinical vs. clinical subjectsFirst of all, the baseline CI model fit the data equally well in clinical and nonclinical individuals. Nesting the metric model into the configural model did not produce a worse fit meaning that the relationship between items and factors were equal across both populations. Finally, differences in goodness-of-fit indices in the scalar model were excellent (Table 2) except for CFI and TLI which yielded a minor change of ΔCFI=-.024 and ΔTLI=-.022. As this was due to differential item functioning (DIF), we did stepwise hierarchical nesting for every single item in order to find out which item(s) might be affected. Out of all 10 items, only item 7 revealed a violation of the criteria offered by Cheung amp; Rensvold (2002) with a difference of ΔCFI=-.017 and ΔTLI=-.020. This was regarded as minor issue since other studies have reported statistical deviations of item 7 as well (Cole, 1999; Reis et al., 2017) and the fit indices themselves were still adequate. Thus, SI and strong measurement invariance was given. It is important to note that multigroup analyses are sensitive to sample size. For this reason, we calculated an additional MGCFA with a random subsample of n=575 nonclinical subjects, which was retrieved using the SPSS random sample command. However, results did not differ substantially from the original analyses (SI: ΔCFI=-.033; ΔTLI=-.030; ΔRMSEA=.013; ΔSRMR=.003).
Internal consistence and associated constructsInternal consistencies in both samples were good to very good, yielding αnonclin=.88 and αclin=.89 for PSS-TOTAL, αnonclin=.85 and αclin=.85 for PH and αnonclin=.79 and αclin=.82 for PSE. For nonclinical individuals, PSS-TOTAL correlated negatively with well-being (r=-.71). In the clinical sample, PSS-TOTAL was positively associated with GSI (r=.49). In both samples, PSS-TOTAL correlated moderately with reported physical health (rclin=-.40; rnonclin=-.41) and strongly with mental health (rclin=-.72; rnonclin=-.73; all p's<.001) (Table 3). Mean scores of all PSS scales were significantly higher in the clinical population than in the nonclinical population (PSS-TOTAL: Mnonclin=28.33, SDnonclin=6.97,Mclin=31.61, SDclin=7.17, t(1821)=-9.24, p<.001, d=0.47; PH: Mnonclin=17.88, SDnonclin=4.77,Mclin=19.43, SDclin=4.86; t(1821)=-6.39, p<.001, d=0.32; PSE: Mnonclin=13.55, SDnonclin=2.80,Mclin=11.82, SDclin=3.26; t(1821)=10.99, p<.001, d=0.59).
Correlations between subjective stress and related self-reported constructs in nonclinical and clinical subjects.
| 1 | 2 | 3 | 4 | 5 | 6 | 7 | |
|---|---|---|---|---|---|---|---|
| 1 Global Stress (PSS-TOTAL) | 1 | ||||||
| 2 Helplessness (PH) | .95***(.96***) | 1 | |||||
| 3 Self-Efficacy (PSE) | -.86***(-.86***) | -.66***(-.69***) | 1 | ||||
| 4 Physical Health | -.45***(-.42***) | -.41***(-.40***) | .41***(.36***) | 1 | |||
| 5 Mental Health | -.75***(-.73***) | .70***(-.69***) | .66***(.64**) | .51***(.48***) | 1 | ||
| 6 Well-being (WHO) | (-.71***) | (-.66***) | (.65***) | (.44***) | (.71***) | 1 | |
| 7 Global Severity Index (BSI) | .49*** | .50*** | -.35*** | -.21*** | -.35*** | - | 1 |
Note. Correlation coefficients refer to N=1,248 nonclinical and N=575 clinical subjects; statistical indices from nonclinical subjects are shown in brackets; PSS=Perceived Stress Scale; Physical and Mental Health were assessed using 9-point visual analogue scales; WHO=Well-Being Index; BSI=Brief Symptom Inventory; **p<.01; ***p<.001.
In the present study, we introduced a German translation of the PSS-10 and assessed its factor structure, for the first time, in a large clinical sample consisting of patients with diverse mental illnesses. We also compared the results from the clinical sample with a big nonclinical sample and yielded highly satisfactory psychometric properties. In the light of the transactional stress model (Lazarus & Folkman, 1984), our findings support a two-dimensional model. Particularly, the factor structure could be replicated throughout both populations, which supports the notion that our adaptation of the German PSS-10 can be administered equally well in nonclinical and clinical samples. Therefore, this work is an important contribution for the psychometric measurement of helplessness and self-efficacy in clinical populations, both being substantial elements of overall perceived stress.
To our best of knowledge, we conducted the first study that directly compared multiple models and groups by using a sophisticated methodological approach. To find the best fitting model, we carefully chose a multistep procedure: First, we ran multiple CFAs for both nonclinical and clinical individuals to test several competing models. Our findings revealed a robust two-factorial structure which is in line with previous studies (Denovan et al., 2019; Nielsen et al., 2016). Although Cohen and colleagues (1983) originally stated a one-factorial model, our findings clearly support a two-factorial structure.
In our two-factor solution, item 7 (PSE scale) showed slightly low communality and factor loading in the nonclinical sample (ʎ2=.23; β=.48), which has been observed previously (Reis et al., 2017). Yet, due to relevant scale downsizing, it would not have been statistically recommendable to exclude it (Marsh, Hau, Balla, & Grayson, 1998), why we did not calculate another model without this item (Marsh et al., 1998). Interestingly, when we tested for strong measurement invariance, the same item was the only one affected by differential item functioning. Since strong invariance can hold even when single items show slight statistical variations (Cole, 1999), however, we concluded that the minor deviations by item 7 were not meaningful for the overall construct of perceived stress and thus came to the conclusion that the PSS-10 is strictly invariant over clinical and nonclinical subjects.
In a practical perspective, our study entails some important implications. Based on our finding that the clinical population showed significantly higher perceived stress, the PSS-10 could be used as a first screening instrument to detect individuals with heightened levels of stress. This is of particular importance, since higher levels of stress put people into risk for the development of mental illness (Dikmen-Yildiz, Ayers, & Phillips, 2018). By identifying overall helplessness and current coping abilities, clinicians can get a first idea of an individual's overall psychiatric strain. As we could show, the PSS-10 reliably measures stress in nonclinical and clinical individuals and thus offers a possibility to crosswalk between different phases of subjective stress. Also, due to the dynamic nature of stress, it is important to monitor both acute and continuous perceived stress. Thus, assessing the connection between PSS-scores and long-term clinical outcomes would be a promising direction for future research. Monitoring stress levels over a longer period of time could provide additional insights about intraindividual changes. In this vein, studies should also apply the PSS-10 over the time course of psychotherapeutical interventions, given the fact that the two PSS core facets are typically targeted in cognitive-behavioral therapy: Counteracting helplessness and promoting coping abilities fosters self-efficacy and, in turn, behavioral change (the close association of the two constructs was also reflected by the correlation of the latent factors in our model). For example, studies have shown that enhancing self-efficacy promotes overall psychotherapy outcome (e.g., Cusack, Coleman, Rappaport, & Sheerin, 2018; Leon-Quismondo & Lahera, 2016). Together with the interplay of stress and mental health (Conway et al., 2016; Keeley et al., 2016; Schönfeld et al., 2016) research also points to a connection with well-being (Cleland, Kearns, Tannahill, & Ellaway, 2016). Results from our study also indicate that well-being as well as psychological and physiological health have a strong association with global subjective stress.
Limitations and future directionsWe did not divide our clinical sample by diagnosis but ran our analyses for the overall population instead because we wanted to maximize generalizability of our findings, since there is a broad range of mental disorders and the presence of at least one comorbidity is fairly common (about 55%; Jacobi et al., 2015). As our study shows promising results, future studies ought to obtain validation data in more homogeneous subgroups to find out about disorder-specific psychometric characteristics. Besides, as pointed out earlier, observing long-term changes in perceived stress over the course of illness and/or psychotherapy could also be of particular interest. Finally, our study did not take specific sources of stress and external stressors into account. Linking global stress with the occurrence and impact of life events could yield insights into the interplay of objective stressors and subjective stress responses.
Taken together, our analyses show that the German PSS-10 is a valid questionnaire to capture perceived helplessness and self-efficacy which, in the light of the transactional stress model, are known to be hallmark features of subjective perceived stress. Our study yielded highly satisfactory psychometric results for different populations and thus is an economic and easy-to-use scale to assess global subjective stress and its facets helplessness and self-efficacy.
FundingThis study was supported by the German Research Foundation (grant number WE3638/5-1).
The authors would like to thank Dr. Dominik Leiner for the possibility to use the German SoSci survey panel for data acquisition and Simone Klöckner for her help with editing the manuscript. We also thank Dr. Anne Szostek and Louisa Morrison for their translations of the PSS-10 as well as Tonio Krappmann and Nastasja García Rodríguez for their help with the Spanish manuscript.
Instruktionen: Die folgenden Fragen beschäftigen sich mit Ihren Gedanken und Gefühlen während des letzten Monats. Bitte geben Sie für jede Frage an, wie oft sie in entsprechender Art und Weise gedacht oder gefühlt haben.
Instructions: The questions in this scale ask you about your feelings and thoughts during the last month. In each case, you will be asked to indicate how often you felt or thought a certain way.
| Item | Question |
|---|---|
| 1 | Wie oft waren Sie im letzten Monat aufgewühlt, weil etwas unerwartet passiert ist?In the last month, how often have you been upset because of something that happened unexpectedly? |
| 2 | Wie oft hatten Sie im letzten Monat das Gefühl, nicht in der Lage zu sein, die wichtigen Dinge in Ihrem Leben kontrollieren zu können?In the last month, how often have you felt that you were unable to control the important things in your life? |
| 3 | Wie oft haben sie sich im letzten Monat nervös und gestresst gefühlt?In the last month, how often have you felt nervous and “stressed”? |
| 4 | Wie oft waren Sie im letzten Monat zuversichtlich, dass Sie fähig sind, ihre persönlichen Probleme zu bewältigen?In the last month, how often have you felt confident about your ability to handle your personal problems? |
| 5 | Wie oft hatten Sie im letzten Monat das Gefühl, dass sich die Dinge zu Ihren Gunsten entwickeln?In the last month, how often have you felt that things were going your way? |
| 6 | Wie oft hatten Sie im letzten Monat den Eindruck, nicht all Ihren anstehenden Aufgaben gewachsen zu sein?In the last month, how often have you found that you could not cope with all the things that you had to do? |
| 7 | Wie oft waren Sie im letzten Monat in der Lage, ärgerliche Situationen in Ihrem Leben zu beeinflussen?In the last month, how often have you been able to control irritations in your life? |
| 8 | Wie oft hatten Sie im letzten Monat das Gefühl, alles im Griff zu haben?In the last month, how often have you felt that you were on top of things? |
| 9 | Wie oft haben Sie sich im letzten Monat über Dinge geärgert, über die Sie keine Kontrolle hatten?In the last month, how often have you been angered because of things that were outside of your control? |
| 10 | Wie oft hatten Sie im letzten Monat das Gefühl, dass sich so viele Schwierigkeiten angehäuft haben, dass Sie diese nicht überwinden konnten?In the last month, how often have you felt difficulties were piling up so high that you could not overcome them? |
Note. English translation in italics. Answer range: 1-5; the helplessness subscale is computed by summing up Items 1, 2, 3, 6, 9 and 10; the self-efficacy subscale is computed by summing up items 4, 5, 7 and 8; the total score is the sum of all helplessness and reversed self-efficacy items. Higher scores reflect greater levels of stress.
