


The main purpose of this study was to analyze the internal structure and measurement invariance across gender and age of the Strengths and Difficulties Questionnaire (SDQ), self-reported version, in Spanish adolescents. The sample consisted of 1,547 participants, 606 were male (39.1%), with a mean age of 15.15 years (SD=1.99). Results from the confirmatory factor analysis showed a five-factor model and a bifactor model with correlated errors added as the most appropriate. Nevertheless, the bifactor model displayed lower and non-significant factor loadings. The hypothesis of measurement invariance of the SDQ scores across gender and age was supported. The level of internal consistency of the Total difficulties score was .84, ranging between .71 and .75 for the SDQ subscales. The study of the psychometric properties showed that the Spanish version of the SDQ, self-reported form, seems to be an adequate tool for the screening of emotional and behavioural problems during adolescence. Future research should analyze the internal structure of the SDQ in other regions and testing the measurement invariance across cultures.
El principal objetivo del presente estudio fue analizar la estructura interna y la invarianza de medición en función del género y la edad del Strengths and Difficulties Questionnaire (SDQ), versión autoinforme, en adolescentes españoles. La muestra está formada por 1.547 participantes, 606 varones (39,1%), con una media de edad de 15,15 años (DT=1,99). Los resultados del análisis factorial confirmatorio mostraron que el modelo de cinco factores y el modelo bifactor con modificaciones presentaron los mejores índices de bondad de ajuste. Sin embargo, en el modelo bifactor algunas cargas factoriales no fueron estadísticamente significativas. La hipótesis de invarianza de medición de las puntuaciones del SDQ en función del género y la edad fue confirmada. El nivel de consistencia interna de la puntuación Total de dificultades fue 0,84, mientras que para las subescalas osciló entre 0,71 y 0,75. El estudio de las propiedades psicométricas de la versión española del SDQ autoinforme parece indicar que se trata de una herramienta adecuada y útil para el cribado de problemas emocionales y comportamentales en la adolescencia. En investigaciones futuras se debería analizar la estructura interna del SDQ en otras regiones y someter a prueba la invariancia de medición en función de las culturas.
Interest in the detection of children and adolescents at-risk for emotional disorders or behavioural problems has increased in the last two decades (Blanco et al., 2015; Carli et al., 2014; Fonseca-Pedrero, Paino, Lemos-Giráldez, & Muñiz, 2013). Despite the efforts in early detection, different research studies have suggested that only a minority of the adolescent population with needs of intervention in the area of mental health comes in direct contact with specialized services (Costello, Copeland, & Angold, 2011; Ford, Hamilton, Meltzer, & Goodman, 2008). Early detection, identification and treatment of those individuals at-risk may delay or prevent the onset of the clinical outcome; however prior to early identification and prevention efforts, we need brief, well-validated, and psychometrically sound assessment tools.
The assessment of emotional and behavioural problems in children and adolescents is a priority issue for public health policy. The Strengths and Difficulties Questionnaire (SDQ) (Goodman, 1997) is a screening tool for behavioural and emotional problems that similarly allows the assessment of capacities in the social sphere. The SDQ is composed of 25 items, Likert response format with three options, which are grouped into five subscales: Emotional symptoms, Conduct problems, Hyperactivity, Peer problems, and Prosocial behaviour. The first four subscales form a Total difficulties score. In total, 15 items reflect problems and 10 strengths, of which five belong to the Prosocial subscale and five should be recoded, since they belong to the Total difficulties score. The inclusion of these positive items increased the acceptability of the instrument between parents and teacher. Moreover as it addresses contemporary issues like impulsiveness or bullying is widely accepted by clinicians.
Specifically, psychometric properties of the SDQ have been analyzed previously and different types of validity evidence, according to the international Standards, have been gathered (American Educational Research Association, American Psychological Association, & National Council on Measurement in Education, 2014). Previous studies have indicated an adequate reliability scores in the self-report version of the SDQ (Gómez, 2012; Muris, Meesters, & van den Berg, 2003); nevertheless, a significant number of studies have detected low values of reliability through Cronbachs's alpha coefficient (α < .60), especially in the subscales of Conduct problems and Peer problems (Capron, Therond, & Duyme, 2007; Mellor & Stokes, 2007; Muris & Maas, 2004; Rønning, Helge Handegaard, Sourander, & Mørch, 2004; Ruchkin, Jones, Vermeiren, & Schwab-Stone, 2008; Ruchkin, Koposov, & Schwab-Stone, 2007; Yao et al., 2009).
Factorial studies conducted in order to test the internal structure of the SDQ scores, self-reported version, yielded contradictory results. Previous studies, using confirmatory factor analysis (CFA), have supported the five-factor model (Emotional symptoms, Conduct problems, Hyperactivity, Peer problems, and Prosocial behaviour) as the most appropriate solution (He, Burstein, Schmitz, & Merikangas, 2013; Ruchkin et al., 2008; Svedin & Priebe, 2008; Van Roy, Veenstra, & Clench-Aas, 2008; Yao et al., 2009); however, other studies concluded that a solution with three dimensions was as satisfactory as the five-factor solution (Percy, McCrystal, & Higgins, 2008; Ruchkin et al., 2008). The three-factor model is composed by: a) Internalizing symptoms, resulting of the Emotional and Peer problems subscales, b) Externalizing symptoms, comprising Conduct problems and Hyperactivity subscales, and c) the Prosocial subscale. Also, a five-factor model with two second order factors (Internalizing and Externalizing) (Goodman, Lamping, & Ploubidis, 2010) has been proposed. Nonetheless, Mellor and Stokes (2007) reported that none of the five subscales was essentially one-dimensional, questioning the adequacy of the internal structure of the five-factor solution.
Other research, likewise, discussed the adequacy of the setting of SDQ subscales, indicating that the factorial structure of the SDQ scores was not appropriate or was needed of modifications (Ortuño-Sierra, Fonseca-Pedrero, Paino, Sastre i Riba, & Muñiz, 2015; Percy et al., 2008; Rønning et al., 2004). One of the added values of the SDQ, the inclusion of several positive items, could be a key factor in explaining low levels in Cronbach's alpha coefficient and the inconsistency of factorial solutions (Ortuño-Sierra et al., 2015). The fact that the difficulties subscales include these type of items can mean that they behave as part of a distinct construct (Dickey & Blumberg, 2004; van de Looij-Jansen, Goedhart, De Wilde, & Treffers, 2011).
According to Ortuño-Sierra et al. (2015), another relevant aspect with regards to the factor structure of the SDQ is the study of measurement invariance across groups (e.g., gender, age, or ethnicity). The analysis of the equivalence of the factor structure across different groups, for instance, gender or age has hardly been studied. Testing for measurement invariance permits more meaningful groups comparisons and readily interpretable results than those psychometric scenarios in which measurement equivalence is not examined. As yet, just a reduced amount of studies have examined the question of whether or not the dimensional structure of the SDQ is invariant across variables (e.g., gender and age) (He et al., 2013; Ortuño-Sierra et al., 2015; Ruchkin et al., 2008; van de Looij-Jansen et al., 2011). For instance, Ruchkin et al. (2008) advised measurement invariance across urban and suburban areas, while He et al. (2013) found invariance of the SDQ scores across sex, age, race/ethnicity and income subgroups.
Moreover, when studying the internal structure it is important to account the psychometric multidimensionality, related to the possibility that the items used to assess the multiple dimensions could reflect multiple hierarchically organized constructs. For instance, a specific subscale and, in addition, more general constructs. In order to solve this issue, hierarchical models (i.e., higher-order) CFA have been suggested (Goodman et al., 2010). In this case, each item is specified as loading on its specific subscale (i.e., a first-order factor), and each first-order factor is specified as loading on a higher-order factor (i.e., a second-order factor). In this regard, and although developed in the past, bifactor solutions have recently acquired more attention as they provide an alternative to the hierarchical models (Chen, West, & Sousa, 2006; Holzinger & Swineford, 1937; Reise, Moore, & Haviland, 2010). In fact, there is an increasing agreement that psychological symptoms and disorders have a hierarchical structure with a general (common) factor, and specific (conceptually narrow) or unique components that play important roles. This approach provides an alternative to non-hierarchical multidimensional representations of individual differences, being an effective approach to modeling construct-relevant multidimensionality (Reise et al., 2010).
A bifactor model is based on the assumption that a f-factor solution exists for a set of n items with one Global (G) factor and f-1 Specific (S) factors (Marsh et al., 2010). Attending to the SDQ, the bifactor model allows the different items of the SDQ to load on an overall primary dimension and, in addition, to have a secondary loading on a specific subdomain (Kóbor, Takács, & Urbán, 2013). The existence of a general factor could be relevant in order to solve, from a theoretical point of view, the comorbility found between some of the domains of the SDQ when considered separately (e.g., ADHD or prosocial capabilities), among others (Rhee, Willcutt, Hartman, Pennington, & DeFries, 2008). To date, the only study that have analyzed the bifactor solution in the SDQ (Kóbor et al., 2013) revealed better goodness-of-fit indices with bifactor than with traditional model solutions.
Studies analyzing the psychometric properties of the SDQ for the Spanish version have been found only for the parents and teachers form (Ezpeleta, Granero, de la Osa, Penelo, & Doménech, 2012; Rodríguez-Hernández et al., 2012). Recently, Ortuño-Sierra et al. (2015) studied the psychometric properties of the SDQ, self-reported version, with a modified version of the instrument that included a five-options Likert response format (1=Totally Disagree, 5=Totally agree). Although the findings showed the adequateness of this alternative to the official response format, studies analyzing the internal structure of the SDQ with the original three-options Likert response format (0=Not true, 1=Somewhat true, and 2=Certainly true), are still needed for the Spanish version. In addition, due to the lack of consistency about the factor structure of the tool, new approaches as the bifactor model can contribute to better understand the factor structure of the SDQ and the phenotypic structure of behavioural and emotional symptoms during adolescence.
Therefore, the main purpose of the present study was to analyze the internal structure and measurement invariance across gender and age of the SDQ, self-reported version, in Spanish adolescents. This objective allowed analyzing: a) the internal structure of the SDQ using CFA; b) the measurement invariance of the SDQ scores according to gender and age of participants; and c) the internal consistency of the SDQ scores using Ordinal alpha. It is hypothesised that the bifactor solution and the original five-factor model with modifications will result in a better model fit. Also, it is further hypothesised that the factor structure of the SDQ will be equivalent across gender and age. This study was carried out using an instrumental, transversal design (Montero & León, 2007).
MethodParticipantsThe initial sample comprised a total of 1,602 students, eliminating participants who presented: a) omission of any demographics information or item without responding (n=35); and b) outliers scores (n=20). Thus, the final sample was composed of 1,547 non-clinical adolescents, 606 were male (39.1%). Participants volunteered to take part in the study. Participants’ ages ranged from 11 to 19 (M=15.15 years; SD=1.99 years). With regards to the educational level, a total of 1,417 (91.5%) participants belonged to secondary and high school centres, while 130 (8.5%) were studying at university level. High school students were from different types of schools –public, grant-assisted private and private– and from vocational/technical schools in La Rioja and Navarra (two regions situated in the north of Spain). University students were selected from the first course of Educational Sciences studies from the University of La Rioja.
InstrumentsThe Strengths and Difficulties Questionnaire (SDQ) (Goodman, 1997), self-reported form, is a measuring instrument widely used for the assessment of different emotional and behavioural problems related to mental health in children and adolescents. The SDQ is made up of a total of 25 statements distributed across five subscales: Emotional symptoms, Conduct problems, Hyperactivity, Peer problems, and Prosocial behaviour. In this study we used the original three-options Likert response format, so that the score on each subscale ranged from 0 to 10 points. The first four subscales yield a Total difficulties score. In the present study we used the SDQ Spanish version (www.sdqinfo.org), validated in previous studies (Ortuño-Sierra, Fonseca-Pedrero, Paino, & Aritio-Solana, 2014).
ProcedureThe questionnaire was administered collectively, in groups of 10 to 35 students, during school time in a classroom specially prepared for this purpose. For participants under 18, parents were asked to provide written informed consent in order for their children to participate in the study. Participants were informed of the confidentiality of their responses and the voluntary nature of the study, and no incentive was provided for their collaboration. The administration took place under the supervision of the researchers. This study is part of a broader research on the detection of psychological disorders in adolescence and early intervention. The study was approved by the research and ethics committee at the University of La Rioja.
Data analysesFirst, we calculated descriptive statistics (mean, standard deviation, skewness and kurtosis) of the SDQ subscales and Total difficulties score.
Second, in order to analyze the internal structure of the SDQ, several CFAs were conducted. Previous to the analysis, positive items from the problems subscales were recoded. Due to the categorical nature of the data, we used the Weighted Least Squares Means and Variance adjusted (WLSMV) estimator and the polychoric correlation matrix. Different hypothetical factor models were tested: a) the three-factor model with Internalizing and Externalizing problems, and Prosocial capabilities as dimensions; b) Once different correlated errors (CE) were identified, a three-factor model with the inclusion of the CE was analyzed; c) the five-factor original model (Goodman, 1997); d) five-factor model with CE; e) the five-factor model with two second-order factors (Goodman et al., 2010); f) the inclusion of the CE was also tested in model e; g) the bifactor model that includes a general factor and five dimensions (Kóbor et al., 2013); and h) finally, the bifactor model with the inclusion of the CE was also studied. The following goodness-of-fit indices were used: Chi-square (χ2), Comparative Fit Index (CFI), Tucker-Lewis Index (TLI), Root Mean Square Error of Approximation (RMSEA), and Weighted Root Mean Square Residual (WRMR). According to Marsh, Hau, and Wen (2004), RMSEA scores obtaining .05 or less are preferred; however, values below .08 are considered acceptable. The CFI and TLI values over than .95 are preferred and values close to .90 are considered acceptable, and WRMR values less than .08 as a good model fit (Hu & Bentler, 1999).
Third, in order to test measurement invariance, successive multigroup CFAs were conducted (Byrne, 2008; Byrne & van de Vijver, 2010). Generally the measurement invariance reflects that the construct measured has the same structure and meaning across the groups compared.
Using Delta parameterization in Mplus two steps on measuring invariance need to be considered: Configural and strong invariance models (Muthén & Asparouhov, 2002). In the first step we established the configural invariance model, in which items were constrained to load on the same factors across groups, but all item thresholds and factor loadings were free to vary across groups. In a second step we established a strong invariance model, which contained cross-group equality constraints on all factor loadings and item thresholds. Furthermore, factor means fixed to zero in the first group and free in the other groups and scale factors fixed to one in the first group and free in the other groups.
Due to the limitations of the Δχ2 regarding its sensitivity to sample size, Cheung and Rensvold (2002) proposed a more practical criterion, the ΔCFI, to determine if nested models are practically equivalent. In this study, when ΔCFI is greater than .01 between two nested models, the more constrained model is rejected since the additional constraints have produced practically worse fit. However, if the change in CFI is less than or equal to .01, it is considered that all specified equal constraints are tenable and, therefore, we can continue with the next step in the analysis of measurement invariance.
Finally, Ordinal alpha for Likert data was calculated as a measure of the reliability of the SDQ scores. Ordinal alpha is conceptually equivalent to Cronbach's alpha and it performs better for dichotomous and ordinal data (Zumbo, Gadermann, & Zeisser, 2007). SPSS 15.0 (Statistical Package for the Social Sciences, 2006), Factor 9.2 (Lorenzo-Seva & Ferrando, 2013), and Mplus 7.0 (Muthén & Muthén, 1998-2012) were used for data analyses.
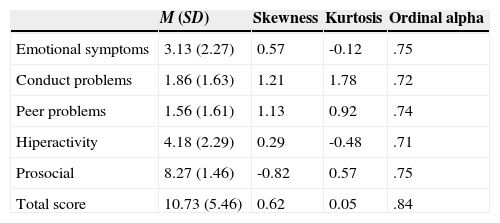
ResultsDescriptive statistics for the SDQ scoresDescriptive statistics for the subscales and the SDQ Total score for the total sample are shown in Table 1. As it can be seen, the values for skewness and kurtosis ranged between ±2. Mardia's coefficient was computed as a test for multivariate normality. According to Mardia's coefficients the SDQ subscales and Total difficulties score were non-normally distributed (p < .05).
Descriptive statistics for the Strengths and Difficulties Questionnaire.
| M (SD) | Skewness | Kurtosis | Ordinal alpha | |
|---|---|---|---|---|
| Emotional symptoms | 3.13 (2.27) | 0.57 | -0.12 | .75 |
| Conduct problems | 1.86 (1.63) | 1.21 | 1.78 | .72 |
| Peer problems | 1.56 (1.61) | 1.13 | 0.92 | .74 |
| Hiperactivity | 4.18 (2.29) | 0.29 | -0.48 | .71 |
| Prosocial | 8.27 (1.46) | -0.82 | 0.57 | .75 |
| Total score | 10.73 (5.46) | 0.62 | 0.05 | .84 |
Note. M=Mean; SD=Standard Deviation.
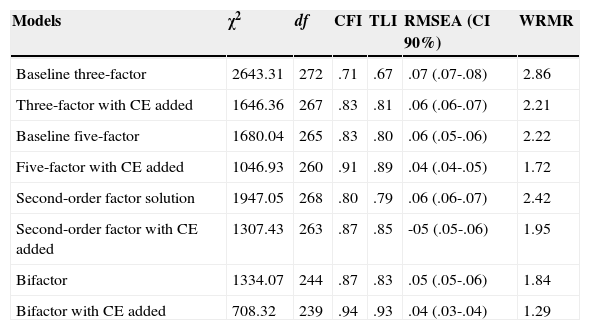
As shown in Table 2, goodness-of-fit indices for the three-factor baseline model did not reach the cut-offs recommended. The five-factor baseline model showed better fit but was still questionable. For both models, substantial Modification Indices (MIs) (i.e., ≥ 25) were found, for error correlation between items 2 and 10, items 15 and 25, items 16 and 15, items 19 and 18, and items 23 and 20. This correlation between errors was made between those items that have similar content. The items wording are shown in Table 3. As it can be seen some of the items belong to the Hyperactive subscale, suggesting the possibility that this subscale could have overlapping items. Also, other CE suggest the possibility of overlapping between items from different subscales. It is worth noting that more CE were found. However, taking into account the inherent problematic in the use of CE (Heene, Hilbert, Freudenthaler, & Bühner, 2012), and from a pragmatic criterion, we decided to compute just five out of 180 potential CE. Thus the model is far from being fully saturated.
Goodness-of- fit indices of the confirmatory factor analysis.
| Models | χ2 | df | CFI | TLI | RMSEA (CI 90%) | WRMR |
|---|---|---|---|---|---|---|
| Baseline three-factor | 2643.31 | 272 | .71 | .67 | .07 (.07-.08) | 2.86 |
| Three-factor with CE added | 1646.36 | 267 | .83 | .81 | .06 (.06-.07) | 2.21 |
| Baseline five-factor | 1680.04 | 265 | .83 | .80 | .06 (.05-.06) | 2.22 |
| Five-factor with CE added | 1046.93 | 260 | .91 | .89 | .04 (.04-.05) | 1.72 |
| Second-order factor solution | 1947.05 | 268 | .80 | .79 | .06 (.06-.07) | 2.42 |
| Second-order factor with CE added | 1307.43 | 263 | .87 | .85 | -05 (.05-.06) | 1.95 |
| Bifactor | 1334.07 | 244 | .87 | .83 | .05 (.05-.06) | 1.84 |
| Bifactor with CE added | 708.32 | 239 | .94 | .93 | .04 (.03-.04) | 1.29 |
Note. χ2=Chi square; df=degrees of freedom; CFI=Comparative Fit Index; TLI=Tucker-Lewis Index; RMSEA=Root Mean Square Error of Approximation; CI=Confidence Interval; WRMR=Weighted Root Mean Square Residual; CE=Correlated Errors (items 19-18, 2-10, 25-15, 16-15, 23-20).
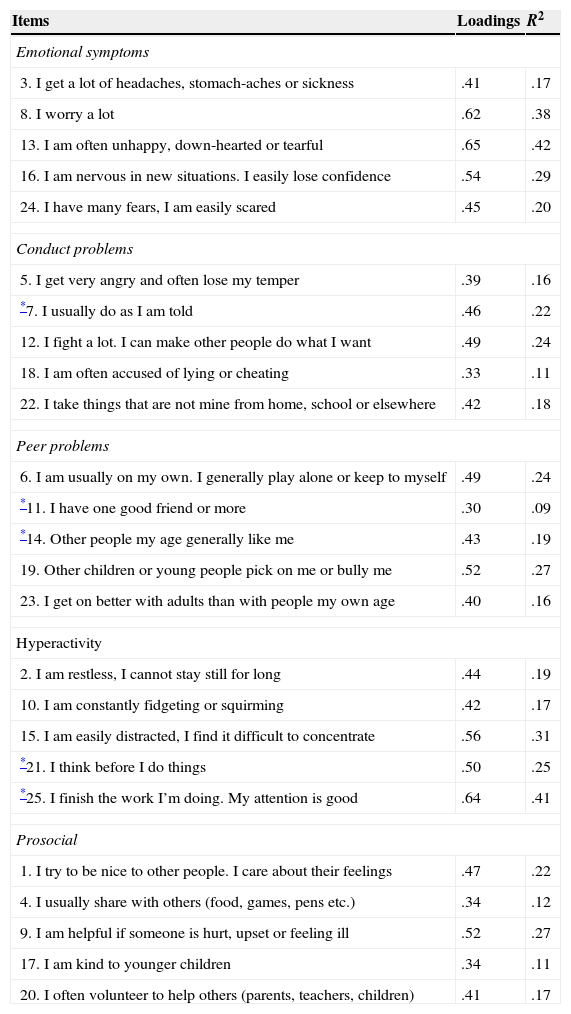
Standardized factor loadings for the five-factor model with modifications.
| Items | Loadings | R2 |
|---|---|---|
| Emotional symptoms | ||
| 3. I get a lot of headaches, stomach-aches or sickness | .41 | .17 |
| 8. I worry a lot | .62 | .38 |
| 13. I am often unhappy, down-hearted or tearful | .65 | .42 |
| 16. I am nervous in new situations. I easily lose confidence | .54 | .29 |
| 24. I have many fears, I am easily scared | .45 | .20 |
| Conduct problems | ||
| 5. I get very angry and often lose my temper | .39 | .16 |
| *7. I usually do as I am told | .46 | .22 |
| 12. I fight a lot. I can make other people do what I want | .49 | .24 |
| 18. I am often accused of lying or cheating | .33 | .11 |
| 22. I take things that are not mine from home, school or elsewhere | .42 | .18 |
| Peer problems | ||
| 6. I am usually on my own. I generally play alone or keep to myself | .49 | .24 |
| *11. I have one good friend or more | .30 | .09 |
| *14. Other people my age generally like me | .43 | .19 |
| 19. Other children or young people pick on me or bully me | .52 | .27 |
| 23. I get on better with adults than with people my own age | .40 | .16 |
| Hyperactivity | ||
| 2. I am restless, I cannot stay still for long | .44 | .19 |
| 10. I am constantly fidgeting or squirming | .42 | .17 |
| 15. I am easily distracted, I find it difficult to concentrate | .56 | .31 |
| *21. I think before I do things | .50 | .25 |
| *25. I finish the work I’m doing. My attention is good | .64 | .41 |
| Prosocial | ||
| 1. I try to be nice to other people. I care about their feelings | .47 | .22 |
| 4. I usually share with others (food, games, pens etc.) | .34 | .12 |
| 9. I am helpful if someone is hurt, upset or feeling ill | .52 | .27 |
| 17. I am kind to younger children | .34 | .11 |
| 20. I often volunteer to help others (parents, teachers, children) | .41 | .17 |
Note. All standardized factor loadings estimated were statistically significant (p<.01); R2=Proportion of explained variance.
As seen in Table 2, the inclusion of these CE produced an increase in the fit in all the models tested. In the case of the five-factor model, goodness-of-fit indices were adequate, whereas in the three-factor model were still poor. Meanwhile, the model with the inclusion of second-order factors revealed a lower fit than the five-factor model without and with the CE.
The bifactor model showed poor fit to the data, although the goodness-of-fit indices were higher than in the other models. The same CE were found for the bifactor model. The inclusion of CE displayed adequate goodness-of-fit indices for this model. We then studied the standardized factor loadings in the bifactor and the five-factor model with correlated errors. In this case, the bifactor model showed four non-significant factor loadings, and, in addition, sixteen standardized factor loading were lower than in the five-factor model. For this reason, we decided that the five-factor model with the inclusion of correlated errors was more appropriate to further study measurement invariance.
The standardized factor loadings for the five-factor model allowing correlated errors are shown in Table 3. The range of the factor loadings for the final five-factor model was .30, item 11 of the Peer problems subscale (I have one good friend or more) to .65, item 13 of Emotional symptoms (Often unhappy, down-hearted or tearful), all being statistically significant (p<.05) (see Table 3). The correlation between factors ranged from .19 (FII-FIII) and -.21 (FV-FIII).
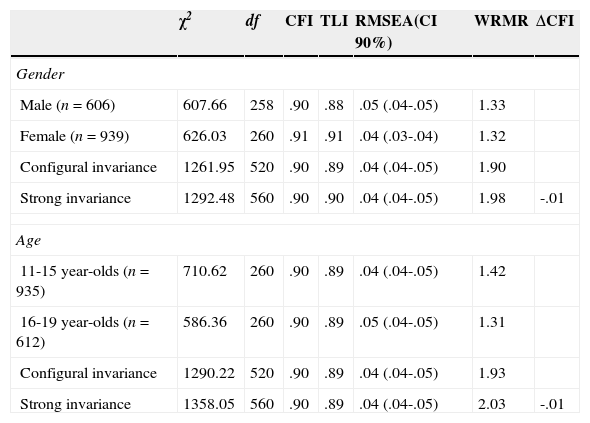
Measurement invariance of the SDQ scores across gender and ageGiven that the five-factor model with modifications evidenced appropriate model fit and, in addition, displayed more substantial factor loadings than the bifactor model, we therefore tested the measurement equivalence of the five-factor model with modifications across gender and age. To examine measurement invariance across age, the sample was divided into two subgroups: 11-15 year-olds (n=935), and 16-19 year-olds (n=612); according to the first stage of adolescence and the next stages. Prior to the analysis of measurement invariance across gender and age, we tested whether the five-factor model with modifications showed a reasonable good fit to the data in each group. Next, we examined configural and strong measurement invariance. The results are shown in Table 4. Differences in ΔCFI below .01 between the configural model and the strong model confirmed strong measurement invariance across gender and age of the five-factor model with modifications.
Goodness-of-fit indices for measurement invariance of the Strengths and Difficulties Questionnaire across gender and age.
| χ2 | df | CFI | TLI | RMSEA(CI 90%) | WRMR | ΔCFI | |
|---|---|---|---|---|---|---|---|
| Gender | |||||||
| Male (n=606) | 607.66 | 258 | .90 | .88 | .05 (.04-.05) | 1.33 | |
| Female (n=939) | 626.03 | 260 | .91 | .91 | .04 (.03-.04) | 1.32 | |
| Configural invariance | 1261.95 | 520 | .90 | .89 | .04 (.04-.05) | 1.90 | |
| Strong invariance | 1292.48 | 560 | .90 | .90 | .04 (.04-.05) | 1.98 | -.01 |
| Age | |||||||
| 11-15 year-olds (n=935) | 710.62 | 260 | .90 | .89 | .04 (.04-.05) | 1.42 | |
| 16-19 year-olds (n=612) | 586.36 | 260 | .90 | .89 | .05 (.04-.05) | 1.31 | |
| Configural invariance | 1290.22 | 520 | .90 | .89 | .04 (.04-.05) | 1.93 | |
| Strong invariance | 1358.05 | 560 | .90 | .89 | .04 (.04-.05) | 2.03 | -.01 |
Note. χ2=Chi square; df=degrees of freedom; CFI=Comparative Fit Index; TLI=Tucker-Lewis Index; RMSEA=Root Mean Square Error of Approximation; WRMR=Weighted Root Mean Square Residual; CI=Confidence Interval; ΔCFI=Change in Comparative Fit Index.
The internal consistency of the Total difficulties score estimated with ordinal alpha was .84. Internal consistency levels for the subscales were adequate: Emotional symptoms (.75), Conduct problems (.72), Peers problems (.74), Hyperactivity (.71), and Prosocial (.75) (see Table 1).
Discussion and conclusionsThis study assessed the internal structure and factorial equivalence of the Strengths and Difficulties Questionnaire (SDQ) (Goodman, 1997), in its self-reported form, in a large sample of non-clinical Spanish adolescents. To this end, we examined the internal structure through confirmatory factor analysis (CFA), studied the measurement invariance across gender and age, and estimated the reliability of the SDQ scores. The knowledge of the SDQ factorial structure is relevant in order to use it as a screening tool in an age group at-risk of developing emotional and behavioural symptoms and disorders (Blanco et al., 2015; Carli et al., 2014; Fonseca-Pedrero et al., 2013).
Results from the CFAs, in line with previous studies (He et al., 2013; Ruchkin et al., 2008; Ruchkin et al., 2007; Svedin & Priebe, 2008; Van Roy et al., 2008; Yao et al., 2009), yielded a five-factor structure as most adequate, rejecting the proposed three-factor model, supported as well in different research studies (Percy et al., 2008; Ruchkin et al., 2008). Nonetheless, optimal levels of goodness-of-fit indices were found after adding correlated errors (CE) between items, revealing, as it was the case in other studies, discrete levels in the five-factor baseline model (Percy et al., 2008). The study of the bifactor model showed discrete goodness-of-fit indices and the necessity of the inclusion of CE. After the correlated errors were added the bifactor solution displayed a good model fit. Nevertheless, the study of the factor loadings leaded to reject this model as some of them were inappropriate and lower than the five-factor solution with CE. Thus, our findings do not support the bifactor model contrary to Kóbor et al. (2013). It is worth noting that the present study focuses on the self-reported version of the SDQ whereas the study of Kóbor et al. (2013) studied the parent and the teacher form in children samples. Both aspects could be relevant in order to understand the differences found. In this regard, more studies are still needed to determine the adequacy of this dimensional model in order to understand the SDQ internal structure.
In addition, results support the hypothesis of strong measurement invariance of the SDQ five-factor model with modifications across gender and age. The review of the literature reveals that there are few studies of measurement invariance in the self-reported version of the SDQ (Ruchkin et al., 2008). Recently studies have found partial measurement invariance in the SDQ self-reported version in adolescents across different demographic variables, including gender and age (He et al., 2013; van de Looij-Jansen et al., 2011). For instance, van de Looij-Jansen et al. (2011) showed that the self-reported version of the SDQ was invariant by age, education level, and ethnicity, while the hypothesis of strong factorial invariance across gender was not clearly acceptable. Rønning et al. (2004) confirmed measurement invariance across gender for the SDQ scores, although the initial setting of the model in men and women was inappropriate. Adolescence is a crucial stage in which different biopsychosocial changes take place and show up differentially depending on the gender and the age (Salmera-Aro, 2011). Therefore, screening and psychological assessment of mental health at this stage should address the possibility that different theoretical constructs are understood similarly in response to at least these two variables, otherwise the results may not be valid.
The SDQ scores showed acceptable levels of reliability. The Ordinal alpha for the Total difficulties score was .84, ranging between .71 and .75 for the SDQ subscales. Previous studies yielded lower internal consistency in the Conduct and Peer problems subscales (Mellor & Stokes, 2007; Muris, Meesters, Eijkelenboom, & Vincken, 2004; Ruchkin et al., 2008; Ruchkin et al., 2007; Yao et al., 2009). In this regard, the fact that Ordinal alpha was used instead of Cronbach alpha might be a relevant variable explaining these differences. Ordinal alpha, which was introduced by Zumbo et al. (2007), has been found to estimate reliability more accurately than Cronbach's alpha for ordinal response scales. In addition, and despite being an added value, reverse-worded items could be affecting the internal consistency (Solís, 2015), so it might be a matter of future studies trying to determine if changes in these items improve the reliability of the SDQ. Moreover, the three-point Likert format is suppose to affect the reliability of the subscales (Zumbo et al., 2007), so another Likert format such as a five-point format could improve the reliability of the SDQ scores (Ortuño-Sierra et al., 2015).
This study has relevant strengths but also some limitations. One possible limitation of this study is that we focused on two particular Spanish regions located in the north. Given the peculiarities, diversity, and plurality of the nation, future studies could examine the psychometric properties of the instrument in other regions or geographic areas. In conclusion, the results support the psychometric properties of the SDQ, self-reported version, in Spanish adolescents. Also, the bifactor structure failed to explain the SDQ structure as some factor loadings were inadequate, and the traditional five-factor model with modifications better fit the data. Future studies could replicate the study of the psychometric properties of the SDQ. Moreover, future research on the measurement invariance across cultures would enable the comparison of results between different countries, regions or cultures.
