


One of the disorders that most affects school performance is Attention Deficit Hyperactivity Disorder (ADHD). The criteria established by DSM distinguish three subtypes: inattentive, hyperactive-impulsive and combined. However, the expression of this disorder can be altered by its association with other disorders such as anxiety. The main goals of this study were to determine whether different patterns of attention (selective and concentration) and anxiety (state and trait anxiety) emerge from ADHD subtypes, and analyze how anxiety predicts the performance of students with ADHD in a selective attention task. The sample was made up of 220 children (6-12 years) divided into four groups: control group (n=56), inattentive subtype (n=54), hyperactive-impulsive subtype (n=53), and combined subtype (n=57). The results indicated that the groups differed significantly in the attention variables, and in state and trait anxiety. Multiple group comparisons revealed that the combined subtype exhibited higher trait anxiety, whereas the inattentive subtype showed more state anxiety. Additionally, trait anxiety predicted the students’ performance in the concentration variable of the attention task. These results suggest a novel path of significant interest concerning objective and reliable diagnostic assessment of ADHD.
Uno de los trastornos que más afecta al rendimiento escolar es el Trastorno por Déficit de Atención con Hiperactividad (TDAH). El criterio establecido por el DSM diferencia tres subtipos: inatento, hiperactivo-impulsivo y combinado. Sin embargo, el perfil de este trastorno podría verse alterado por la asociación con otros como la ansiedad. El objetivo de esta investigación es determinar si hay diferentes patrones de atención (selectiva y sostenida) y ansiedad (estado y rasgo) en los tres subtipos de TDAH. Además, el objetivo es analizar cómo la ansiedad predice el rendimiento de los estudiantes con TDAH en una tarea de atención selectiva. La muestra estaba formada por 220 estudiantes (6-12 años): 56 en el grupo control, 54 con TDAH-Inatento, 53 con TDAH-Hiperactivo impulsivo y 56 con el subtipo combinado. Los resultados obtenidos mostraron que los cuatro grupos resultaban significativamente diferentes en las variables atencionales y en los niveles de ansiedad estado y rasgo. Al mismo tiempo, la ansiedad rasgo predijo el rendimiento en la variable de concentración analizada. Los resultados revelan un nuevo patrón de gran interés de cara a la evaluación diagnóstica objetiva y fiable en el TDAH.
Attention Deficit Hyperactivity Disorder (ADHD) is classified in the Diagnostic and Statistical Manual of Mental Disorders (American Psychiatric Association, APA, 2000) into three different subtypes: a subtype with predominance of attention deficit disorder (ADHD-I), the subtype with predominance of hyperactivity-impulsivity (ADHD-HI), and the combined subtype with both attention deficit and hyperactivity-impulsivity (ADHD-C). These classification guidelines have been the subject of recurring debate concerning diagnosis of the disorder (González-Castro, Rodríguez, López, Cueli, & Álvarez, 2013; Lemiere et al., 2010). Moreover, with the publication of the new DSM-5 classification manual (American Psychiatry Association, APA, 2013), ADHD is now categorized as neurodevelopmental disorder. While there were no significant changes in terms of the main symptoms of the disorder, with respect to classification there are now four types of presentations (instead of subtypes) of ADHD: predominantly hyperactive/impulsive; predominantly inattentive; inattentive restrictive; and combined presentation. However, regardless of the names used for classification, much research has investigated if ADHD subtypes or types of presentation differ in their development (Lahey & Willcutt, 2010), or in their epidemiology (Willcutt, 2012) and also whether different comorbidities generally associated with the disorders are dependent upon the subtype (Sciberras et al., 2014).
Some researchers note the importance of identifying comorbidity in ADHD cases, as it is an essential determining factor in the course of the disorder (Bloemsma et al., 2013; Elia et al., 2009; Humphreys, Aguirre, & Lee, 2012; Rodríguez, González-Castro, García, Núñez, & Álvarez, 2014). Comorbidity has been reported to be associated with different disorders, such as learning difficulties, depression, oppositional defiant disorder, behavior disorders, as well as anxiety and mood disorders (González-Castro, Rodríguez, Cueli, Cabeza, & Álvarez, 2014; Skirbekk, Hansen, Oerbeck, & Kristensen, 2011). Regarding anxiety, comorbidity with ADHD is estimated at 20-25% (Bloemsma et al., 2013). The diverse estimates of the studies may be due to the extensive overlap of symptoms in these syndromes (ADHD and anxiety), so it may be difficult to determine whether a child has developed hyperactivity and inattention because of anxiety, or whether low self-esteem derived from ADHD has caused the anxious behavior. Anxious children usually display a permanent state of worry or apprehension that is difficult to control (Bloemsma et al., 2013). This can be confused with some typical symptoms of ADHD, such as restlessness, fatigue, difficulty concentrating, irritability, muscle tension, and sleep disturbance.
The relationship between ADHD and anxiety is important because, while 5% to 15% of children may suffer from an anxiety disorder, between 15% and 35% of children with ADHD display significant anxiety (Pliszka, Carlson, & Swanson, 1999). According to these authors, ADHD with comorbid anxiety may be a distinguishing feature of the subtypes, as children with ADHD and comorbid anxiety are phenotypically different from children with a pure disorder (either ADHD, or anxiety). More recently, within the Multimodal Treatment Study (MTA) for Children with ADHD, Bloemsma et al. (2013) showed that, in the group of children with ADHD and anxiety symptoms, inattention seem to prevail over impulsivity symptoms.
Children with ADHD and anxiety showed better response inhibition than pure ADHD children (Manassis, Tannock, & Barbosa, 2000). In this sense, Power, Costigan, Eiraldi and Leff (2004) also found significant differences between ADHD-C, ADHD-I, and control groups in the Behavior Assessment System for Children - Parents’ Rating Scale (BASC-PRS). Specifically, parents reported higher levels of anxiety in children with ADHD-I compared with the control group. Group differences were also found in The Revised Children's Manifest Anxiety Scale (RCMAS), with children in the ADHD-C group showing significantly higher levels of anxiety than controls. However, Elia et al. (2009) and Mayes, Calhoun, Chase, Mink, and Stagg (2009) observed that comorbidity of ADHD with anxiety did not vary according to subtype.
The discrepancy found among different studies could, however, be related to the type of anxiety examined. In this sense, Spielberger, Gorsuch, Lushene, Vagg, and Jacobs (1983) differentiated between trait anxiety and state anxiety. Trait anxiety refers to a general level of stress that characterizes certain individuals that are often easily stressed and anxious, while state anxiety is characterized as a state of heightened emotions that appears in response to danger or fear of a particular situation. The presence of one or another type of anxiety may lead to different performance on attentional tasks (Ursache & Raver, 2013). This study showed that an increase in trait anxiety in children between 9 and 12 years was associated with lower performance in executive tasks, while an increase in state anxiety was associated with better performance. In this same direction, Sadeh and Bredemeier (2011) demonstrated that an increase in trait anxiety imposed a major distraction on selective attention tasks, an aspect of attentional control that involves the selection of the relevant stimulus stream, the suppression of the irrelevant streams, and the maintenance of attention on the relevant information (Lackner, Santesso, Dywan, Wade, & Segalowitz, 2013).
Taking into account the results of previous research, this study was aimed at verifying whether different profiles (attention and anxiety) emerge as function of ADHD subtypes. Specifically, it sought to determine whether ADHD different expressions relate to differences in selective attention and concentration (assessed using D-2 Attention task: Brickenkamp, 2001) and in the two main manifestations of anxiety (State and trait anxiety: Spielberger et al., 1983). Additionally, on the basis of the results provided by Sadeh and Bredemeier (2011) and Ursache and Raver (2013), it was also analyzed the degree to which anxiety affects ADHD students’ performance in a selective attention task.
HypothesisFirst, significant differences among groups will be found in attention measures. Regarding selective attention in D-2, it was expected that the inattentive subtype will score lower than the combined subtype, and that the combined subtype will score lower than hyperactive subtype. There will be no significant differences, however, in D-2 concentration between inattentive and combined subtypes, but these two groups will differ from hyperactive subtype.
Second, differences in state and trait anxiety levels will emerge as function of ADHD subtypes. Specifically, it is expected that the combined subtype will display higher levels of trait anxiety compared with controls, and inattentive and hyperactive-impulsive subtypes. Furthermore, children with inattentive ADHD will present significantly higher levels of state anxiety than children with combined ADHD, and both groups will show higher levels of anxiety than the hyperactive-impulsive subtype.
Finally, given that previous research suggests that trait anxiety implies worse performance on attention tasks, and that anxiety levels cause an increase in inattentive symptoms while reduce hyperactivity, it has been hypothesized that trait anxiety will mainly predict a worse performance in the inattentive subtype of ADHD.
MethodParticipantsIn this investigation, participants were comprised of 220 children, 122 males (55.50%) and 98 females (44.50%) aged between 6 and 12 years (M=9.84, SD=1.54), from seven schools. Participants were classified into four groups: control group (CG) children without attention deficit or hyperactivity (n=56; 33 males and 23 females; M=10.38, SD=1.57); group (ADHD-I) inattentive subtype (n=54; 25 males and 29 females; M=9.57, SD=1.46); group (ADHD-HI) hyperactive-impulsive subtype (n=53; 28 males and 25 females; M=9.60, SD=1.52); and group ADHD-C, with both attention deficit and hyperactivity-impulsivity (n=57; 36 males and 21 females; M=9.79, SD=1.49). Participants attended public and private schools in Asturias (Spain) and were not receiving any kind of pharmacological treatment.
Inclusion criteriaThe subjects in the ADHD groups were identified in the Child and Adolescent Psychiatric Service of the Central University Hospital of Asturias, according to the Diagnostic and Statistical Manual of Mental Disorders-IV, (DSM-IV-TR; APA, 2000). Diagnosis procedure included the assessment of ADHD symptoms by means of the Diagnostic Interview Schedule for Children (DISC-IV; Shaffer, Fisher, Lucas, Dulcan, & Schwab-Stone, 2000). Test-retest reliability reported for the Spanish version of the DISC-IV was “fair to moderate agreement” (kappas from .48 to .59) (Bravo et al., 2001).
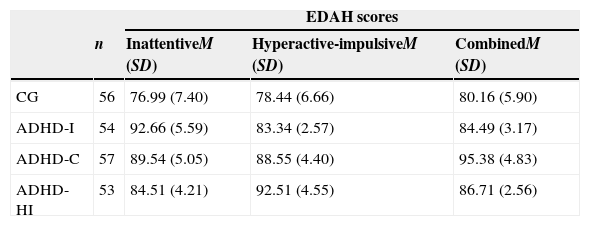
For assigning of the students to their respective groups, Farré and Narbona's Spanish scale (1998), (EDAH) “Assessment of attention deficit with hyperactivity” was administered to the students’ parents and teachers. This instrument has a history of good reliability and validity. Accordingly, if both the results of the student observations coincided (agreement for each subtype higher than percentile 90), the students were assigned to their corresponding reference group (see Table 1). In the next step, each student was formally assigned and confirmed to a specific ADHD group only if the pediatric and psychoeducational diagnoses coincided. Children who presented a cognitive deficit or other comorbidities were excluded from the study: cognitive deficit (n=14), comorbidity with behavior disorders (n=12), Asperger (n=3), Guilles de la Tourette (n=1), anxious/depressive disorders (n=4) and learning disorders (n=8). All included participants had an Intelligence Quotient (IQ) equal to or higher than 80 (M=101.29, SD=12.38), as assessed by the Weschler Intelligence Scale for Children-Revised (WISC-IV; Wechsler, 2005). All healthy controls underwent the same diagnostic assessment to rule out any psychiatric disorders.
EDAH scores of the four groups.
| EDAH scores | ||||
|---|---|---|---|---|
| n | InattentiveM (SD) | Hyperactive-impulsiveM (SD) | CombinedM (SD) | |
| CG | 56 | 76.99 (7.40) | 78.44 (6.66) | 80.16 (5.90) |
| ADHD-I | 54 | 92.66 (5.59) | 83.34 (2.57) | 84.49 (3.17) |
| ADHD-C | 57 | 89.54 (5.05) | 88.55 (4.40) | 95.38 (4.83) |
| ADHD-HI | 53 | 84.51 (4.21) | 92.51 (4.55) | 86.71 (2.56) |
Note. CG=Control Group; ADHD-I=Inattentive group; ADHD-HI=hyperactivity/impulsivity group; ADHD-C=combined group.
Results of analysis of variance (ANOVA) indicated that there were small differences between groups in the distribution of participants according to age, F(3, 216)=3383, p=.019, η2=.045 and large in EDAH scores F(3, 216)=66757, p=.000, η2=.463, but no statistically significant differences in IQ (p=.416).
InstrumentsState-Trait Anxiety Inventory for Children (STAI-C; Spielberger et al., 1983). This consists of two 20-item scales that measure state and trait anxiety in children between ages 8 and 14 years. The anxiety state scale examines short-term state anxiety, which is usually situation specific. It prompts the child to rate 20 statements on a 3-point scale ranging from ‘Hardly ever true’ to ‘Often true’. The anxiety trait scale measures long-term anxiety or how the child generally feels. Interpretation of the information provided by STAI-C is based upon higher scores corresponding to higher levels of anxiety. Variables taken into consideration included state anxiety (raw scores and percentiles) and strait anxiety (raw scores and percentiles). Spielberger et al. (1983) reported alpha coefficients of .90 to .93 for internal consistency and .73 to .86 for test-retest reliability. The scale has demonstrated convergent validity by having statistically significant correlations with other anxiety scales. Alpha coefficients in the present study were adequate, with values of .86 to .89 for trait and state anxiety scales, respectively.
D-2 Attention Test (Brickenkamp, 2001). This is a screening test of selective attention and concentration (8 to 10minutes) from age 8, measured with a task consisting of finding relevant stimuli (particularly, the letter d “with two stripes”). The test is composed of 14 rows (with 47 letters each row) in which the subject must detect the relevant stimuli for 20seconds for each row, recorded the total responses, the total correct responses and errors of omission and commission, to obtain a measure of selective attention (total responses minus the sum of errors of omission and commission) and sustained attention or concentration (total correct responses minus errors of commission). Percent rank scores are calculated on the basis of age norms using a scale wherein higher scores indicate better/more stable performance. In this study, the variables were: D2 total (raw score and percentile), and D2 concentration (raw score and percentile). Brickenkamp (2001) reported alpha coefficients of .80 to .98 for internal consistency. Regarding validity criteria, the scale has previously shown statistically significant correlations with other attention tests. For the present sample, alpha coefficients were .85 and .93.
The main reason as to why this study incorporated percentile measures is related to the current characterization of ADHD and its presentations, based on the DSM-5 (APA, 2013). As this updated system establishes age as an important variable in the appearance and evolution of the disorder, providing a standardized measure (i.e., percentile), as well as analyzing how it varies as function of the different manifestations of ADHD and its comorbidity with anxiety, gain special relevance in the current clinical scene for the scores interpretation.
ProcedureThis study was conducted in accordance with the Code of Ethics of the World Medical Association (Declaration of Helsinki) for experiments involving humans. All subjects and their parents gave written informed consent.
Participants’ identification was carried out according to the DSM-IV-TR criteria in the Pediatric Service (diagnosis is based on the criteria of this manual given that it was in force at the time of evaluation). Subsequently, the diagnosis was corroborated using the DISC-IV and the EDAH (parent-teacher agreement equal to or higher than 90%) administered in the reference educational centers. Then, students who formed a group without ADHD were selected. These students were recruited from the same primary schools as the ADHD students, they had not associated clinical diagnosis and they performed the same assessment protocol. Once configured the four groups, all the participants completed the STAI-C and the D-2 Attention Test.
Design and data analysisWe used an ex post facto design of four groups, three corresponding to the ADHD subtypes and a control group. The sample was obtained through a pre-planned process, using a sample based on convenience and accessibility.
Data were analyzed with multivariate analysis of covariance (MANCOVA). The dependent variables were several measures of attention including: raw scores and percentiles in selective attention (D2 total), concentration (D2 concentration), and anxiety (raw scores and percentiles in state and trait anxiety), while the independent variable was the group. Age, gender, and IQ were introduced as covariates. In cases where Wilks’ λ was significant (p<.05), results of the individual analysis of variance (ANCOVAs) were considered. Applying Cohen's (1988) classic work, a small association was defined as ηp2=.010 (equivalent to Cohen's d=.20), a medium association as ηp2=.059 (equivalent to Cohen's d=.50), and a large association as ηp2=.138 (equivalent to Cohen's d=.80). Scheffé’s multiple comparison test was utilized to evaluate between-group comparisons.
Finally, hierarchical linear regression was carried out in order to determine the predictive value of state and trait anxiety levels on attention measures (D2 total and D2 concentration) in each of the four groups studied. These analyses were based on the raw scores. A step by step approach was used in order to analyze the amount of variance explained by each of these variables. Age, IQ and gender were entered jointly in the first stage of the regression analysis to ensure they do not explain much of the variance of attention. Gender and grade level (as dichotomous variables) were coded as dummy variables. In the second stage, trait anxiety and state anxiety were included in the model. Separate regression analyses were conducted for each of the four analyzed groups. Differences were considered as statistically significant at the level of p ≤ .05. In the case of comparisons between pairs of groups, the p-value was adjusted in order not to increase type I errors, and was thus established at a level of p ≤ .01. All statistical analyses were conducted with statistical software package SPSS 18.0 (Arbuckle, 2009).
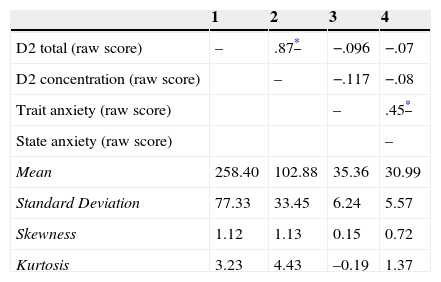
ResultsStudied variables follow a normal distribution. Relevant statistical criteria described by Finney and Di Stefano (2006) were used, in which ‘2’ and ‘7’ are the maximum allowable values for skewness and kurtosis (Table 2). This table also shows the existence of significant and positive correlations between anxiety and attention variables themselves, as these associations were higher for the later variables. Although they were non-significant, correlations also suggested the possible presence of a negative relationship between anxiety (trait, and state) and attention (selective attention, and concentration).
Descriptive analyses and inter-correlations among the variables in the study.
| 1 | 2 | 3 | 4 | |
|---|---|---|---|---|
| D2 total (raw score) | – | .87* | −.096 | −.07 |
| D2 concentration (raw score) | – | −.117 | −.08 | |
| Trait anxiety (raw score) | – | .45* | ||
| State anxiety (raw score) | – | |||
| Mean | 258.40 | 102.88 | 35.36 | 30.99 |
| Standard Deviation | 77.33 | 33.45 | 6.24 | 5.57 |
| Skewness | 1.12 | 1.13 | 0.15 | 0.72 |
| Kurtosis | 3.23 | 4.43 | –0.19 | 1.37 |
Note. 1=D2 total (raw score); 2=D2 concentration (raw score); 3=Trait anxiety (raw score); 4=State anxiety (raw score).
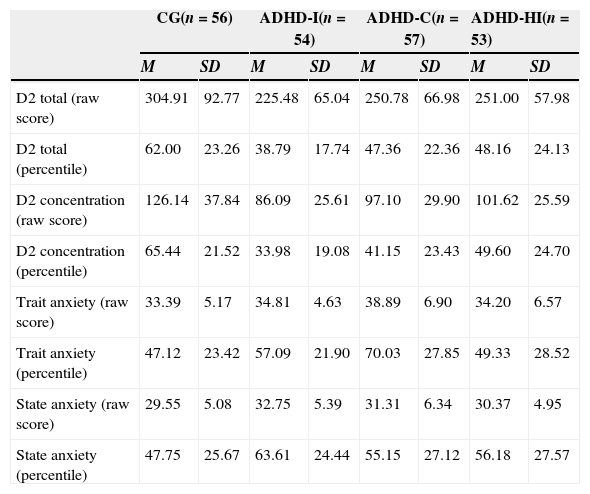
Table 3 presents descriptive statistics for each of the attention variables.
Group means and standard deviations of the D-2 Attention Test dependent variables and trait and state anxiety.
| CG(n=56) | ADHD-I(n=54) | ADHD-C(n=57) | ADHD-HI(n=53) | |||||
|---|---|---|---|---|---|---|---|---|
| M | SD | M | SD | M | SD | M | SD | |
| D2 total (raw score) | 304.91 | 92.77 | 225.48 | 65.04 | 250.78 | 66.98 | 251.00 | 57.98 |
| D2 total (percentile) | 62.00 | 23.26 | 38.79 | 17.74 | 47.36 | 22.36 | 48.16 | 24.13 |
| D2 concentration (raw score) | 126.14 | 37.84 | 86.09 | 25.61 | 97.10 | 29.90 | 101.62 | 25.59 |
| D2 concentration (percentile) | 65.44 | 21.52 | 33.98 | 19.08 | 41.15 | 23.43 | 49.60 | 24.70 |
| Trait anxiety (raw score) | 33.39 | 5.17 | 34.81 | 4.63 | 38.89 | 6.90 | 34.20 | 6.57 |
| Trait anxiety (percentile) | 47.12 | 23.42 | 57.09 | 21.90 | 70.03 | 27.85 | 49.33 | 28.52 |
| State anxiety (raw score) | 29.55 | 5.08 | 32.75 | 5.39 | 31.31 | 6.34 | 30.37 | 4.95 |
| State anxiety (percentile) | 47.75 | 25.67 | 63.61 | 24.44 | 55.15 | 27.12 | 56.18 | 27.57 |
Note. CG=Control Group; ADHD-I=Inattentive group; ADHD-C=combined group; ADHD-HI=hyperactivity/impulsivity group.
The MANCOVA shows that the main effects of the independent variables on the dependent variables were statistically significant (Wilks’ λ=.753, F(12, 555)=5.25, p ≤ .001, η2=.090). The size of this relationship is relevant, as 9% of the variability of the dependent variables can be attributed to group differences, after controlling for the effect of covariates. Gender did not show any effects (p=.261). However, IQ showed a low but statistically significant effect (Wilks’ λ=.949, F(4, 210)=2.80, p=.027 η2=.050), while age presented a statistically large difference (Wilks’ λ= .485, F(4, 210)=55.84, p<.001, η2=.515).
With regard to the analysis of the effect of the variable group on each of the four measures of attention, ANCOVA's showed the following statistically significant differences: D2 total (raw score), F(3, 213)=9.18, p<.000, η2=.115); D2 total (percentile), F(3, 213)=9.79, p<.000, η2=.121); D2 concentration (raw score), F(3, 213)=14.72, p<.000, η2=.172); D2 concentration (percentile), F(3, 213)=18.81, p<.000, η2=.209. Taking Cohen's (1988) criterion into consideration, effect sizes were medium for D2 total, and large for D2 concentration.
Scheffé’s multiple comparisons test indicated that, in the case of the variables D2 total (raw score), D2 total (percentile), and D2 concentration (raw score), the only statistically significant differences detected were between the control group itself, and each of the three ADHD subtypes. In contrast, for the variable D2 concentration (percentile) the data not only showed statistically significant differences among the control group and all three ADHD subtypes, but also revealed that the greatest differences were between the ADHD-I and ADHD-HI groups (p=.005).
Anxiety measuresTable 3 displays the means and standard deviations corresponding to the anxiety types assessed with STAI-C. MANCOVA revealed the existence of statistically significant differences among groups in anxiety measures (Wilks’ λ= .765, F(12, 555)=36.44, p<.000, η2=.086), with 8.6% of the variability of these measures being attributed to group differences. No statistically significant differences were found for gender and IQ, but they were observed for the covariate age (Wilks’ λ= .922, F(4, 210)=4.43, p<.002, η2=.078).
The ANCOVA's yielded statistically significant differences for the four STAI-C measures: trait anxiety (raw score) F(3, 213)=10.24, p<.000, η2=.126; trait anxiety (percentile), F(3, 213)=9.01, p<.000, η2=.113; state anxiety (raw score) F(3, 213)=3.90, p<.010, η2=.052; and state anxiety (percentile), F(3, 213)=3.07, p<.029, η2=.040. Considering Cohen's (1988) criterion, effect sizes were medium for state anxiety, and large for trait anxiety.
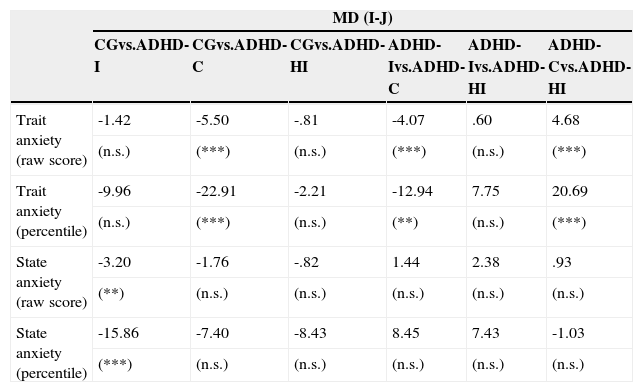
Scheffé’s post-hoc multiple comparisons test showed the following results: a) for raw scores and percentiles in trait anxiety, significant differences were found between the ADHD-C and 3 other groups; b) for raw scores and percentiles in state anxiety, significant differences were only found between the ADHD-I group and the control group.
Table 4 shows the direction of these differences. More specifically, the ADHD-C group had a significantly higher raw score and percentile in trait anxiety than the remaining groups. Smaller significant differences were found between ADHD-C and ADHD-I. The ADHD-I group reported a significantly lower level of state anxiety (raw score and percentile) than the control group. Anxiety measures as predictors of attention measures
Mean differences (I-J) and statistical differences in four different anxiety variables.
| MD (I-J) | ||||||
|---|---|---|---|---|---|---|
| CGvs.ADHD-I | CGvs.ADHD-C | CGvs.ADHD-HI | ADHD-Ivs.ADHD-C | ADHD-Ivs.ADHD-HI | ADHD-Cvs.ADHD-HI | |
| Trait anxiety (raw score) | -1.42 | -5.50 | -.81 | -4.07 | .60 | 4.68 |
| (n.s.) | (***) | (n.s.) | (***) | (n.s.) | (***) | |
| Trait anxiety (percentile) | -9.96 | -22.91 | -2.21 | -12.94 | 7.75 | 20.69 |
| (n.s.) | (***) | (n.s.) | (**) | (n.s.) | (***) | |
| State anxiety (raw score) | -3.20 | -1.76 | -.82 | 1.44 | 2.38 | .93 |
| (**) | (n.s.) | (n.s.) | (n.s.) | (n.s.) | (n.s.) | |
| State anxiety (percentile) | -15.86 | -7.40 | -8.43 | 8.45 | 7.43 | -1.03 |
| (***) | (n.s.) | (n.s.) | (n.s.) | (n.s.) | (n.s.) | |
Note. CG=Control Group; ADHD-I=inattentive group; ADHD-C=combined group; ADHD-HI=hyperactive-impulsive group; MD=Mean difference (I-J); n.s.=not significant.
** p<.05; *** p<.01.
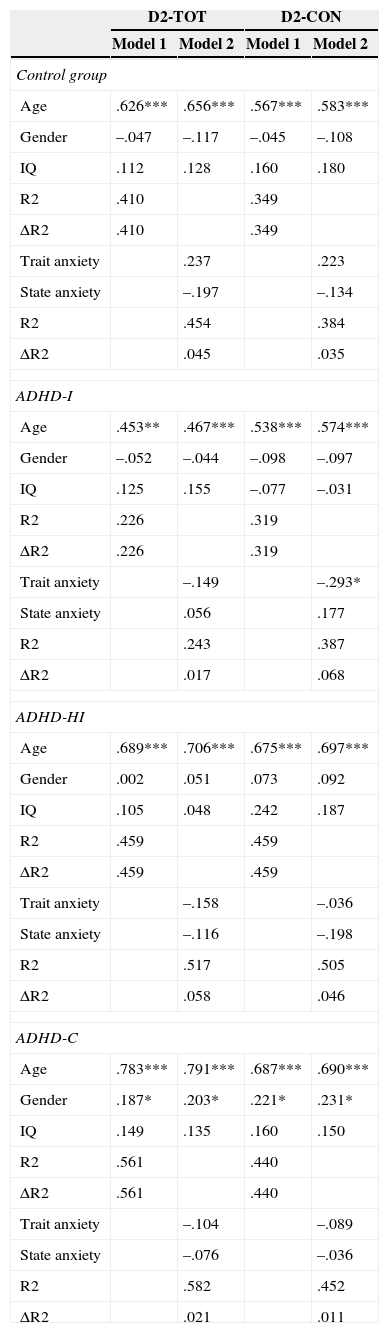
Table 5 shows results from hierarchical regression analyses, conducted for each of the four groups. Age were significant predictors of D2 total and D2 concentration in the first and second stages for the four groups. In the second stage, once the variables state and trait anxiety were entered, only trait anxiety was a significant predictor of concentration (D2-CON) for the ADHD-I, explaining 38.7% of the variance. This percentage was statistically significant F(5, 48)=6.05, p ≤ .05. The sign of the relationship was negative, indicating that the higher the trait anxiety the worse the performance on D2 concentration. Discussion/conclusions
Regression analysis results.
| D2-TOT | D2-CON | |||
|---|---|---|---|---|
| Model 1 | Model 2 | Model 1 | Model 2 | |
| Control group | ||||
| Age | .626*** | .656*** | .567*** | .583*** |
| Gender | –.047 | –.117 | –.045 | –.108 |
| IQ | .112 | .128 | .160 | .180 |
| R2 | .410 | .349 | ||
| ΔR2 | .410 | .349 | ||
| Trait anxiety | .237 | .223 | ||
| State anxiety | –.197 | –.134 | ||
| R2 | .454 | .384 | ||
| ΔR2 | .045 | .035 | ||
| ADHD-I | ||||
| Age | .453** | .467*** | .538*** | .574*** |
| Gender | –.052 | –.044 | –.098 | –.097 |
| IQ | .125 | .155 | –.077 | –.031 |
| R2 | .226 | .319 | ||
| ΔR2 | .226 | .319 | ||
| Trait anxiety | –.149 | –.293* | ||
| State anxiety | .056 | .177 | ||
| R2 | .243 | .387 | ||
| ΔR2 | .017 | .068 | ||
| ADHD-HI | ||||
| Age | .689*** | .706*** | .675*** | .697*** |
| Gender | .002 | .051 | .073 | .092 |
| IQ | .105 | .048 | .242 | .187 |
| R2 | .459 | .459 | ||
| ΔR2 | .459 | .459 | ||
| Trait anxiety | –.158 | –.036 | ||
| State anxiety | –.116 | –.198 | ||
| R2 | .517 | .505 | ||
| ΔR2 | .058 | .046 | ||
| ADHD-C | ||||
| Age | .783*** | .791*** | .687*** | .690*** |
| Gender | .187* | .203* | .221* | .231* |
| IQ | .149 | .135 | .160 | .150 |
| R2 | .561 | .440 | ||
| ΔR2 | .561 | .440 | ||
| Trait anxiety | –.104 | –.089 | ||
| State anxiety | –.076 | –.036 | ||
| R2 | .582 | .452 | ||
| ΔR2 | .021 | .011 | ||
Note. Explained variance (R2) and change (ΔR2), regression coefficients (β), and statistic and associated significance (t(p<)) of the dependent variables. D2-TOT=D2 total; D2-CON=D2 concentration; Model 1=age, gender and IQ as predictor variables in the first step; Model 2=model when trait and state anxiety entered as predictors in the second step.
*p≤.05; **p≤.01; ***p≤.001.
The present study was aimed at examining whether different patterns of attention and anxiety emerge as function of ADHD subtype, and how trait and state anxiety predict the performance of students with ADHD on an attentional task.
According to the results, the initial hypothesis was partially confirmed. Significant differences among groups in the attentional variables were found, with effect sizes indicating the presence of more important differences in D2 concentration. In this sense, participants with ADHD performed significantly worse on the attention task compared with the control group. Differences in concentration (D2 concentration) were also found between the inattentive and the hyperactive/impulsive subtypes. Additionally, although these differences were non-significant, the ADHD-I group obtained lower scores in the selective dimension of attention (D2 total). It was also noteworthy that no differences emerged between the inattentive and combined subtypes. This finding is coherent to previous studies, and would agree with the fact that inattentive symptomatology is common to both subtypes (Willcutt, 2012). These results also support the conceptualization of attention as awareness, filtering and discarding undesired information. In fact, it is an emergent process occurring in diverse neural mechanisms that manage the constant flow of sensory information, resolve stimuli competing for parallel processing, time adequate responses, and (ultimately) control behavior. These aspects are characteristic of the executive function deficits present in the ADHD subtypes (Van de Voorde, Roeyers, & Verté, 2010).
Concerning the second hypothesis, statistically significant differences in anxiety (trait, and state anxiety) among the groups were also observed, and the intensity of these differences was higher in the case of trait anxiety. The combined subtype presented significantly higher levels of trait anxiety than the other subtypes and the control group, while the inattentive subtype showed significantly higher levels of state anxiety than the control group. As in prior research (Pliszka et al., 1999), these results lead to the conclusion that children with ADHD would have higher vulnerability to suffering from anxiety disorders. These results also support findings from previous studies suggesting that different levels of anxiety can emerge as function of the subtype of this disorder (Power et al., 2004). Nevertheless, a differential pattern of results surfaced in the present study, with the combined subtype presenting higher trait anxiety, whereas the inattentive subtype reported higher levels of state anxiety. Nevertheless, these results would indicate that they are inattention symptoms which are more strongly related to anxiety, either trait or state (Bloemsma et al., 2013).
Moreover, results from regression analyses support the initial hypothesis that trait anxiety would predict a worse performance in the groups with ADHD, mainly in the inattentive subtype. Effectively, high levels of trait anxiety significantly predicted worse performance on D2 concentration, but only in the ADHD-I group. These results are consistent with previous findings support that anxiety is related to an increase in the inattentive symptoms but not in hyperactivity (Bloemsma et al., 2013; Manassis et al., 2000; Power et al., 2004; Ursache & Raver, 2013). It is necessary to notice, however, that state anxiety predicted better performance in the present study.
Overall, the results obtained in the present study highlight the importance of examining the impact that comorbid disorders have on ADHD expression. In this context, it would seem that there is an important relationship between anxiety symptoms and inattentive behavior in ADHD, and that this symptomatology tends to aggravate as anxiety levels increase (especifically trait anxiety), thus having an impact on task performance. In this sense, the present study provides an initial insight into the potential utility of trait anxiety measures in the diagnostic and differentiation of ADHD subtypes, revealing a new path of significant interest for clinical intervention and research. The findings are coherent with the perspective adopted in the new version of the DSM (APA, 2013), which establishes ADHD and its presentations as non-static entities. Our results indicated that the different manifestations of the disorder can vary as function of different factors, including the presence of anxiety as a comorbid disorder, as well as its typology in this case. However, in view of certain limitations in the present study, future research needs to be conducted in order to reach a better understanding of this relationship.
LimitationsFirst, comorbidity of ADHD with other frequent disorders, mainly oppositional defiant and conduct disorder needs to be more strongly controlled in future studies. The possible co-occurrence of those disorders could have acted as a confounding factor in the present study (Humphreys et al., 2012). Second, using an additional measure of performance, perhaps based on continuous performance tests, would be of great interest and would better delimitate how students who show different symptomatology also differ in their performance, as well as the specific impact that anxiety levels have on performance. Finally, utilizing these kinds of measures would also have better established the diagnosis of ADHD and the assignment of the participants to the different groups. Further research specifically aimed at addressing these issues needs to be carried out.
We thank Steve Loew for reviewing the English translation.
Available online 18 November 2014
