


Background/Objective: The State-Trait Anxiety Inventory (STAI) is one of the assessment instruments that are most widely used by psychologists around the world and is the seventh most broadly used by clinical psychologists in Spain. Although several short forms of the STAI have been developed since its creation, none are available for the Spanish general population. The aim of the present study was to develop and validate a short form of the STAI. Method: To achieve this, we administered the full STAI to 1,157 healthy adults, and 30 patients with generalized anxiety disorder. We conducted a discriminant analysis using such groups. Results: We obtained a selection of four items for state anxiety and four items for trait anxiety and compared it to other short forms through a confirmatory factor analysis. The short form obtained with the discriminant analysis showed the best fit for Spanish samples. Conclusions: these eight items can be used to facilitate the state and trait anxiety assessment.
Antecedentes/objetivos: El State-Trait Anxiety Inventory (STAI) es uno de los instrumentos de evaluación más empleados por psicólogos en todo el mundo y el séptimo más utilizado por psicólogos clínicos en España. Desde su creación, se han llevado a cabo varias versiones breves del mismo; pese a ello, no existe ninguna para población general con muestra española. El objetivo del presente artículo es establecer y validar una versión breve. Método: Para ello, se aplicó el STAI completo a 1.157 adultos y 30 pacientes con trastorno de ansiedad generalizada. Mediante dichos grupos, se realizó un análisis discriminante. Resultados: Para la ansiedad estado y rasgo, respectivamente, se obtuvieron reducciones de cuatro ítems y se compararon con otras versiones breves mediante análisis factorial confirmatorio. La versión establecida mediante análisis discriminante muestra el mejor ajuste en muestra española. Conclusiones: estos ocho ítems pueden ser usados para facilitar la evaluación de la ansiedad estado y rasgo.
The State-Trait Anxiety Inventory (STAI; Spielberger, Gorsuch, & Lushene, 1970) is a questionnaire aimed at assessing the level of anxiety of individuals. More specifically, the STAI measures individuals’ predisposition to perceive diverse stimuli as threatening (i.e. trait anxiety). Thus, an individual with high trait anxiety is more likely to produce an anxiety response. The STAI also assesses the existence of threat-related stimuli in the environment of the respondent around the time of the assessment (i.e. state anxiety). This is equivalent to a measure of negative affect (Vera-Villaroel & Celis-Atenas, 2014) or a stress measure, considering the amount of stressful stimulus, related with several psychological disorders (Keeley et al., 2016). Trait anxiety and state anxiety are theoretically independent constructs (Spielberger et al., 1970). Its two subscales include items that refer to behavioral, cognitive, emotional and physiological aspects.
Since its creation, “the STAI has been adapted to sixty different languages and dialects and has been cited in over 14,000 studies” (Spielberger & Reheiser, 2009, p. 280), which makes it one of the questionnaires most widely used. The fact that various systematic reviews and meta-analyses report that this instrument is used in a large number of articles provides further evidence of its popularity. In a meta-analysis on the effect of relaxation on anxiety levels, for example, Manzoni, Pagnini, Castelnuovo and Molinari (2008) mentioned that the STAI was used in 60% of the articles reviewed. This makes it one of the measures most used in this context. The STAI has also been used to study the psychological health of workers (Marine, Ruotsalainen, & Verbeek, 2009), showing differences in the level of anxiety experienced by various groups. Reviews have revealed that the STAI is not only used in general population samples but also in clinical groups. For example, Rosa-Alcázar, Sánchez-Meca, Gómez-Conesa and Marín-Martínez (2008) conducted a meta-analysis of obsessive-compulsive disorder. They found that the STAI was the questionnaire used in the largest number of studies analyzed. Finally, the STAI has a high sensitivity to difference between health population and anxious samples (Guillén-Riquelme & Buela-Casal, 2014) or even in anxiety levels in teenagers with attention deficit hyperactivity disorder in their children version (González-Castro, Rodríguez, Cueli, Garcia, & Álvarez, 2015).
Nevertheless, the STAI has been criticized for various reasons. First, it was pointed out that the trait anxiety subscale had more items reporting the presence of anxiety than its absence. It was also argued that its factor structure was not totally stable (Spielberger, 1983). This led to a new revised version (i.e. form Y) in which these shortcomings were corrected. Yet, the main criticism of the STAI is that it does not assess pure anxiety, since it includes items related to depression or negative affect (Endler, Cox, Parker, & Bagby, 1992). This statement is based on the fact that the STAI shows a high correlation with several measures of depression (Spielberger & Reheiser, 2009). The study of the possible relationships between the scores of the STAI and other constructs, particularly depression, has led to alternative analyses that include new factors. For example, Caci, Baylé, Dossios, Robert and Boyer (2003) have proposed several factor models for the structure of the trait anxiety subscale. They argue that several items of the STAI in fact assess “restlessness”, “worrying”, “self-confidence”, “unsuccessfulness” and “anhedonia”. For this reason, they use 10 items that assess three of these factors (items 2, 20, 9, 11, 17, 18, 7, 12, 14 and 15), considering that trait anxiety is a second-order factor. Bieling, Antony and Swinson (1998) proposed a factor structure of the trait subscale of the STAI that includes a factor of depression or general negative affect and showed good fit in the confirmatory factor analysis. These authors concluded that items 2, 8, 9, 11, 17, 18 and 20 measure trait anxiety in its pure form. However, in other studies, factorial structures are not different from the factorial forms in healthy samples (Guillén-Riquelme & Buela-Casal, 2015) or in teenager samples (Silva, Hernández Medina, Jiménez Cruz, & Alvarado, 2016). However, in several samples high correlations between anxiety, stress and depression are observed using other questionnaires (e.g. Schönfeld, Brailovskaia, Bieda, Zhang, & Margraf, 2016).
Several authors have focused on developing a short form of the STAI or of one of its subscales. Although several short forms had already been produced, the first study to do so following certain methodological guidelines was that of Van Knippenberg, Duivenvoorden, Bonke and Passchier (1990). These authors shortened the Dutch version of both subscales to a form with six items for each subscale. More specifically, they obtained three different item selections (depending on the sample used) and verified which of such structures was the most appropriate. They concluded that they were all valid. Two years later, Marteau and Bekker (1992) shortened the English version of state anxiety and concluded that the form including items 1, 3, 6, 15, 16 and 17 was the most appropriate. However, only a sample of pregnant women was used in that study. This structure was later tested using other samples. In fact, Van der Bij, de Weerd, Cikot, Steegers and Braspenning (2003) studied whether it was possible to use the short form proposed by Marteau and Bekker (1992) in a Dutch sample. Again, they used a sample of pregnant women but included their partners as well. They concluded that the item selection was valid. Davey, Barrant, Butow and Deeks (2007) also attempted to confirm this short form. They compared the short form proposed by Marteau and Bekker (1992) to one of the eight-item versions proposed by Van Knippenberg et al. (1990). According to the results obtained, Davey et al. (1992) concluded that both short forms have good properties and can therefore be used.
When the STAI is administered to certain populations, it is very difficult for respondents to complete 20 items. An example of this is the assessment of the anxiety levels of patients with respiratory problems. With this in mind, Chlan, Savik and Weinert (2003) developed a six-item form (5, 9, 10, 12, 17 and 20) of the state subscale of the STAI. This form showed adequate properties in such sample (Chen, 2006; Chlan et al., 2003).
All the short forms presented so far except for that developed by Van Knippenberg et al. (1990) were based on form Y of the STAI. By contrast, much fewer short versions are based on form X. The first was proposed by Van Knippenberg et al. (1990), who developed a short form of both subscales. There are also two short forms of the Brazilian adaptation of the STAI that include both subscales. Indeed, Fioravanti-Bastos, Cheniaux and Landeira-Fernandez (2011) developed a six-item form of each subscale. They added items of form Y to the original questionnaire and chose the best items to broaden this selection. In that case, it was possible to determine the items belonging to form X. In addition, Kaipper, Chachamovich, Hidalgo, Torres and Caumo (2010) proposed a form with 13 items for state anxiety and 12 items for trait anxiety.
In Spain, the STAI is one of the instruments most widely used by psychologists. In fact, it is the seventh most broadly used by clinical psychologists (Muñiz & Fernández-Hermida, 2010) and has shown adequate psychometric properties in a general population (Guillén-Riquelme & Buela-Casal, 2011). Yet, no short forms of this questionnaire have been validated in a general population in Spain, and the shorts forms used are not tested in this country. The version proposed by Chlan et al. (2003) has been validated in patients with respiratory intubation. This Spanish adaptation has shown good reliability and validity evidences (Perpiñá-Galvañ, Richart-Martínez, & Cabañero-Martínez, 2011) and evidence of content validity (Perpiñá-Galvañ, Richart-Martínez, Cabañero-Martínez, & Martínez-Durá, 2011). Several versions were validated in adolescents and college samples (Guillén-Riquelme & Buela-Casal, 2013), and in elderly (Fernández-Blázquez, Ávila-Villanueva, López-Pina, Zea-Sevilla, & Frades-Payo, 2015). Considering all this, the general objective of the present research was to establish a short form reliable in Spanish population and with validity evidences. The specific mains were (1) to develop a short form of both scales of the STAI for the Spanish general population; (2) to compare the short form obtained with those developed by other authors to determine which short version is fittest to the Spanish general population. The hypotheses are (1) the short form will be reliable; (2) all international short versions will have good fit; (3) the short form developed in this work will be fittest of all versions tested.
MethodParticipantsThe sample was composed of 1,157 adults. It included geographic representation from the north, center and south of Spain (i.e. regions of Galicia, Basque Country, Cataluña, Madrid, Valencia and Andalusia). The mean age of participants was 29.73 years (SD=10.55) and age ranged from 18 to 69 years. The sex distribution was 448 men and 693 women (17 participants did not provide this information). The mean age of men was 30.33 years (SD=11.56), with the same age range as the total sample. The mean age of women was 29.39 years (SD=9.85), with ages ranging from 18 to 63 years. To analyze the results we do two random groups: in the first one was 200 participants the age mean was 28.84 (SD=10.1); and in the second had 957 with and age mean=29.92 (SD=10.64). The women percentage was 64.6 in the first group and 65.2 in the second. In addition, we included 30 adults (8 men) diagnosed with generalized anxiety disorder. The mean age was 30.75 years (SD=11.46).
InstrumentTo achieve the objectives of the study, participants responded to socio-demographic questions on their age, sex and place of residence. In addition, we administered the Spanish adaptation of the STAI (Buela-Casal, Guillén-Riquelme, & Seisdedos Cubero, 2016). This version includes 40 items (i.e. 20 for each subscale). In the Spanish adaptation, the response scale ranges from 0 to 3 points, by contrast with the original STAI, in which it ranges from 1 to 4 points (Spielberger et al., 1970). In the state anxiety subscale, item scores range between 0=nada [not at all], 1=algo [somewhat], 2=bastante [moderately] and 3=mucho [very much]. In the trait anxiety subscale, response options range between 0=casi nunca [almost never], 1=a veces [sometimes], 2=a menudo [often] and 3=casi siempre [almost always]. Although each subscale has a theoretical range from 20 to 80, the scores can be compared to those of the original scale by adding 20 to the scores obtained.
DesignThe present research was an instrumental study, as we assessed the psychometric characteristics of a psychological questionnaire (i.e. the STAI). The study was drafted following the recommendations made by Hartley (2012).
ProcedureParticipants were selected through non-probabilistic sampling. The STAI was administered in public places visited by a large number of people and in various organizations that cooperated in the study. Prior to administering the STAI, the experimenters verified that participants were over 18 years old and informed participants of the purpose of the study, guaranteeing its confidentiality. Next, the STAI was handed to participants and the experimenter stayed close to them to respond to any questions.
For the clinical sample, we contacted with seven psychologists. When clinicians diagnosed a patient with a general anxiety disorder, explained her or him the study and that data would be treated confidentially. If the patient accepted to participate, the clinician administered the questionnaire. We applied the following inclusion criteria: being 18 years or older and being diagnosed with generalized anxiety disorder, and have no secondary diagnosis. The research was approved by University of Granada Research Ethics Committee.
Statistical analysesAnalyses were conducted in two stages, each with a different part of the sample. First, we performed a discriminant analysis separately for the trait anxiety and state anxiety subscales using a step by step procedure using F significations. Our aim was to obtain a shorter selection of items that enabled a correct classification of subjects with and without generalized anxiety disorder. After that, we calculated the internal consistency (i.e. ordinal alpha) using a polychoric correlation matrix. This was done using R software (R Core Team, 2016).
Second, we conducted a confirmatory factor analysis to assess the fit of the short form obtained with the discriminant analysis. We also verified the fit of the short forms proposed by other authors. This allowed us to determine which of the short versions demonstrated the best fit with the present sample. To do so, we selected the robust weighted least squares means and variance adjusted (WLSMV) method, calculated by using a diagonal weight matrix. This method is appropriate for categorical measures with a sample higher than 100 (Holtmann, Koch, Lochner, & Eid, 2016). We compared the different models using the Comparative Fit Index (CFI), the Tucker-Lewis Index (TLI) and the Root Mean Square Error of Approximation (RMSEA). Although both scales of the STAI were theoretically independent, we developed path diagrams showing relations between both, since many studies have found a correlation between them. This was done by using R software (R Core Team, 2016) with the lavaan package (Rosseel, 2012) and the ltm package (Rizopoulos, 2006).
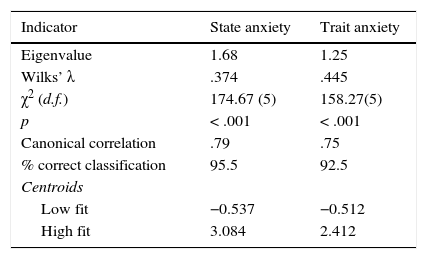
ResultsDiscriminant analysisWe randomly extracted a subsample of 200 participants from the total sample and conducted a separate discriminant analysis for state anxiety and trait anxiety. This sample was unified with clinical sample (n=30). We adjusted the respective discriminant functions for trait and state. Four items were retained in the discriminant function in both state and trait anxiety. Table 1 shows adequate fit indices, with significant results in both cases. In addition, the percentage of correct classification exceeded 92% in the two discriminant functions. This indicated that a selection of four items per scale was effective.
Summary of the discriminant analyses of the anxiety subscales.
| Indicator | State anxiety | Trait anxiety |
|---|---|---|
| Eigenvalue | 1.68 | 1.25 |
| Wilks’ λ | .374 | .445 |
| χ2 (d.f.) | 174.67 (5) | 158.27(5) |
| p | < .001 | < .001 |
| Canonical correlation | .79 | .75 |
| % correct classification | 95.5 | 92.5 |
| Centroids | ||
| Low fit | −0.537 | −0.512 |
| High fit | 3.084 | 2.412 |
Note. d.f.=degrees of freedom; p=probability
Finally, we calculated the reliability of the four items of each subscale. This was done using Cronbach's alpha, calculated from the polychoric correlation matrix. The state anxiety subscale yielded an alpha reliability value of .77. The trait anxiety scale yielded an alpha value of .64.
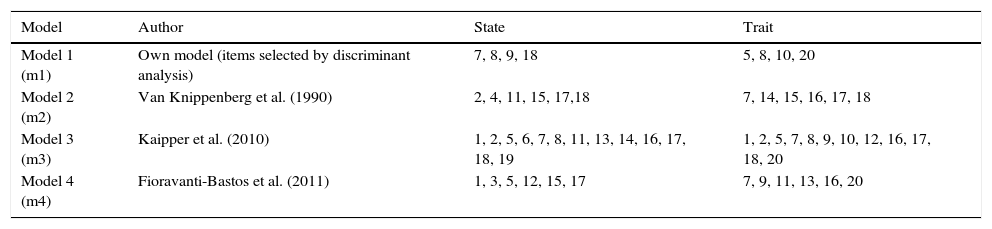
Sources of validity evidence of internal structure: Confirmatory Factor AnalysisAfter selecting the items that enabled making the best predictions of groups with high and low anxiety, we verified whether such structure was adequate with a different sample. We also compared the fit of the model with that of other theoretical structures. To do so, we used the part of the sample that had not been used in the discriminant analysis (n=957). Table 2 summarizes the theoretical models tested and the items they include.
Summary of items in each factor and model of the confirmatory factor analysis.
| Model | Author | State | Trait |
|---|---|---|---|
| Model 1 (m1) | Own model (items selected by discriminant analysis) | 7, 8, 9, 18 | 5, 8, 10, 20 |
| Model 2 (m2) | Van Knippenberg et al. (1990) | 2, 4, 11, 15, 17,18 | 7, 14, 15, 16, 17, 18 |
| Model 3 (m3) | Kaipper et al. (2010) | 1, 2, 5, 6, 7, 8, 11, 13, 14, 16, 17, 18, 19 | 1, 2, 5, 7, 8, 9, 10, 12, 16, 17, 18, 20 |
| Model 4 (m4) | Fioravanti-Bastos et al. (2011) | 1, 3, 5, 12, 15, 17 | 7, 9, 11, 13, 16, 20 |
Note. In m4 we eliminated 2 items that did not belong to form X of the STAI and replaced them with the following ones that would have been selected following the methodology of the article of reference.
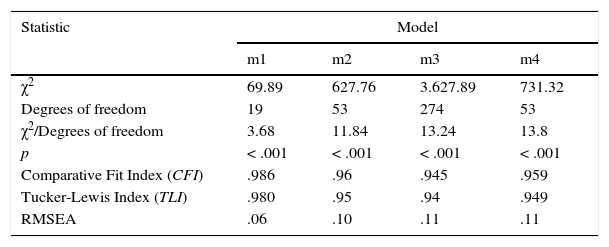
After establishing the models, we verified which of them demonstrated better fit. Table 3 shows the fit indices of the various theoretical models compared. It reveals that the structure obtained after reducing the number of items with the discriminant analysis showed adequate fit. Models 2, 3 and 4 showed good fit (model 2 had the best fit of this group), although our model showed the best fit for all models.
Fit of the models proposed in the confirmatory factor analysis.
| Statistic | Model | |||
|---|---|---|---|---|
| m1 | m2 | m3 | m4 | |
| χ2 | 69.89 | 627.76 | 3.627.89 | 731.32 |
| Degrees of freedom | 19 | 53 | 274 | 53 |
| χ2/Degrees of freedom | 3.68 | 11.84 | 13.24 | 13.8 |
| p | < .001 | < .001 | < .001 | < .001 |
| Comparative Fit Index (CFI) | .986 | .96 | .945 | .959 |
| Tucker-Lewis Index (TLI) | .980 | .95 | .94 | .949 |
| RMSEA | .06 | .10 | .11 | .11 |
Note. m1: data from this article; m2: proposed by Van Knippenberg et al. (1990); m3: proposed by Kaipper et al. (2010); m4: Fioravanti-Bastos et al. (2011), modified. p=probability; RMSEA=Root Mean Square Error of Approximation.
In the next step we analyzed the alpha ordinal with polychoric correlation for the three theoretical models. State scales yielded an alpha=.87 for m2, alpha=.91 for m3 and alpha=.89 for m4. In the Trait scale alpha was .74 for m2, .87 fir m3 and .76 for m4. Furthermore, we calculated the correlation between each model total scores and total scores for complete STAI. In the model 1 the correlation was .86 in state and .87 in trait; model 2: r=.94 in state and r=.91 in trait; model 3: r=.98 in state and r=.98 in trait; model 4: r=.94 in state and r=.88 in trait (all correlations were statistically significant p<.001). To complement these results we calculated the test information function for each short version. The state functions were represented in Figure 1, and the trait functions in Figure 2.
; model 3: proposed by Kaipper et al. (2010); model 4: Fioravanti-Bastos et al. (2011). Generalized partial credit models, Rasch approximation was used. X axis was rescaled to 0-1 range.")
Test information function for all short versions in state scale.
Note. Model 1: data from this article; model 2: proposed by Van Knippenberg et al. (1990); model 3: proposed by Kaipper et al. (2010); model 4: Fioravanti-Bastos et al. (2011). Generalized partial credit models, Rasch approximation was used. X axis was rescaled to 0-1 range.
; model 3: proposed by Kaipper et al. (2010); model 4: Fioravanti-Bastos et al. (2011). Generalized partial credit models, Rasch approximation was used. X axis was rescaled to 0-1 range.")
Test information function for all short versions in trait subscale.
Note. Model 1: data from this article; model 2: proposed by Van Knippenberg et al. (1990); model 3: proposed by Kaipper et al. (2010); model 4: Fioravanti-Bastos et al. (2011). Generalized partial credit models, Rasch approximation was used. X axis was rescaled to 0-1 range.
Finally, we analyzed the correlations between factors obtained from the covariances between trait and state anxiety. The model developed from the discriminant analysis showed a correlation of .59. The remaining models showed higher correlations between factors (i.e. .82 in Model 2, .83 in Model 3 and .72 in Model 4). In all cases the correlations are medium or high, for this reason we decided not to verify the fit of each factor separately.
DiscussionThe objective of the present study was to develop a short form of both subscales of the STAI. First, we defined a four-item version for each subscale that was able to discriminate between sample of general population and a clinical group with generalized anxiety disorder. The number of items selected is similar to that of other short versions of the STAI, since most short forms include six items. A comparison of the fit of the form obtained through discriminant analysis revealed that the four item selection had higher fit indices. However, the reliability was better in the others shorts versions with more items but the test information functions were very similar between all shorts versions. Despite this, the items selected through discriminant analysis were adequate.
The short form of four items per subscale was able to correctly classify over 80% of subjects for state and 74% of subjects in trait (obtained in the discriminant analysis classification). This is an interesting finding considering that most short forms include six items. This number of items is mainly set to replicate the form developed by Marteau and Bekker (1992) or the methodology followed by them. However, these authors selected six items without explaining why they had done so. In addition, as stated by several authors, other forms with a different number of items have been found to be adequate (Fioravanti-Bastos et al., 2011; Van Knippenberg et al., 1990). For this reason, it is interesting to test scales with a different number of items and to try to set a number of items using objective and theoretical criteria. In addition, it is adequate to propose short forms of both subscales because, although state anxiety and trait anxiety are theoretically independent (Spielberger et al., 1970), many studies have shown a relationship between both factors (e.g. Guillén-Riquelme & Buela-Casal, 2011; Ortuño-Sierra, García-Velasco, Inchausti, Debbané, & Fonseca-Pedrero, 2016). This is consistent with the high correlations observed in all the models tested in the confirmatory factor analysis.
As regards the comparison between models, we observed that the version of four items per factor had the best fit. Yet, other models analyzed had very good fit indices and better reliability too. The items that discriminate the best between high and low anxiety levels have the best factor structure throughout all levels of anxiety. However, no clinical score was available in the Spanish adaptation (Buela-Casal et al., 2016). The values of the original form (Spielberger et al., 1970) were considerably higher than those of the Spanish adaptation (Guillén-Riquelme & Buela-Casal, 2011), so it would not be appropriate to use this value either. In this short version the reliability in state was adequate and adequate with some deficiencies in trait (criterion in Hernández, Ponsoda, Muñiz, Prieto, & Elosua, 2016), but we must consider that the low number of items can influence this result. In the same way, the correlations between each model total scores and total scores for complete STAI, may be influenced by number of items; even so in all models the results are upper a .85 and statistically significative.
Among the various structures analyzed, the second one that showed better fit to the sample was that of Van Knippenberg et al. (1990). This version was composed of six items per scale. By contrast, the version of 12 and 13 items proposed by Kaipper et al. (2010) showed the lowest fit indices. Thus, it is not necessary to have a large number of items to obtain a consistent structure (Marteau & Bekker, 1992; Van Knippenberg et al., 1990). In fact, it is possible to develop an adequate short form with four or five items per scale, as we did in the present study. When comparing the form developed by Van Knippenberg et al. (1990) to that proposed after the discriminant analysis, we observed very small differences of fit between both. Therefore, both versions seem to be appropriate to assess anxiety in Spanish samples. Other item combinations may also be adequate, as there seem to be several possible combinations with good fit. This explains the fact that we found a valid form of the Spanish adaptation (Perpiñá-Galvañ, Richart-Martínez, & Cabañero-Martínez, 2011; Perpiñá-Galvañ, Richart-Martínez, Cabañero-Martínez et al., 2011) based on the items of the short form proposed by Chlan et al. (2003) even though the latter was developed from form Y and the Spanish version was developed from form X. Thus, although the items did show an exact match between versions, we found a good fit based on such structure.
Despite the results obtained, this work presents several limitations. First, in the general population sample, the clinical history was not controlled to avoid including people with anxiety disorders. Furthermore, include other test or other types of anxiety measures had been useful to contribute validity evidences, and include other anxiety disorders and a large clinical sample. However, it is increasingly common to develop short forms (e.g. Kruyen, Emons, & Sijtsma, 2013) and cultural adaptations (Muñiz, Elosua, & Hambleton, 2013) of psychological assessment questionnaires with adequate reliability and validity guarantees. It is essential to determine the factor structure of personality questionnaires (e.g. Ginting, Näring, Van der Veld, Srisayektu, & Becker, 2013). In this context, proposing a short version of the STAI for a Spanish sample is an important contribution. A short version is very useful for assessments involving a large number of questionnaires, particularly in situations in which respondents cannot or must not undergo long assessments.
