


Emerging adulthood (EA, age range between 18 to 29 years) is an important developmental stage that is characterized by marked social and psychological changes. Currently, its developmental features are quantified by the Inventory of the Dimensions of Emerging Adulthood (IDEA) but a validated Chinese version of this questionnaire (IDEA-C) is lacking. Thus, this research, which consists of two consecutive studies, aimed to investigate the psychometric properties of the translated IDEA in a Chinese sample of emerging adults.
MethodFirstly, a forward-backward translation of the IDEA-C scale was conducted. Item analysis and exploratory factor analysis were performed in Sample 1a (n = 2438), followed by structural validity test in Sample 1b (n = 2461). Concurrent validity and internal consistency were evaluated in Sample 1(n = 4899). Finally, test-retest reliability was tested in Sample 2 (n = 185). Then, the second study aimed to test the factor structure proposed by study 1 in the non-student sample (n = 2200) by confirmatory factor analysis. In addition, the second study also investigated whether the attainment of college education influenced the EA experience of non-student emerging adults in China. And the association was examined between the socioeconomic status of emerging adults and the subscales of IDEA.
ResultsIn the college sample, the IDEA-C scale presented a four-factor structure different from the original five-factor structure (χ2(190)=1116.84, p < 0.001; CFI = 0.97; TLI = 0.96; SRMR = 0.039; RMSEA = 0.050 [90%CI=0.047-0.052]). In addition, IDEA-C exhibited good internal consistency reliability (Cronbach's alpha >0.77), test-retest reliability (r>0.49, p < 0.01) and concurrent validity. And the CFA in non-student sample also showed an adequate fit indices (χ2(158) =710.10, p < 0.001, TLI=0.93, CFI=0.94, SRMR=0.038, RMSEA=0.04 [90%CI=0.037-0.040]) and an adequate internal consistency (Cronbach's alpha >0.64) and test-retest reliability (r>0.43, p < 0.01).
ConclusionThe results of the present study confirmed that the Chinese version of the IDEA is found to be valid for measuring psychological characteristics of EA in Chinese-speaking samples of emerging adults.
Traditionally in developmental psychology theories, adulthood was conceptualized as starting around 18 to 20 years old (Erikson, 1968; Havighurst, 1972). However, with economic and societal changes in the past 30 years, the majority of younger individuals in developed countries no longer feel like adolescents by their late teens and early twenties but have not yet taken on the roles of adults (Arnett et al., 2014). Compared to preceding generations, these young people have postponed the timing of completing education, getting married, having children and starting a full-time job. Consequently, the transition to adulthood has been increasingly accepted as an independent period of lifespan development (Arnett, 2007). To this end, Arnett (2000) has proposed a new concept of “emerging adulthood (EA)”, which refers to the developmental phase that spans from late adolescence to adulthood (age range between 18 and 29 years old). During this developmental period, facing multiple changes on cognition, affect and behaviors, emerging adults need to learn impulse control so that they can navigate into adulthood successfully (Arnett, 2000). However, emerging adults who adjust themselves poorly during this transitional period have greater likelihood of engaging in problematic health behaviours (e.g., drug use and alcohol abuse) (Nelson & Padilla-Walker, 2013). As EA is a critical developmental period, it has already attracted worldwide attention from scientists of different disciplines.
In this context, five feature characterizing the EA has been proposed (Arnett, 2000). First, identity explorations – EA is a period of life span that provides most opportunities for young people to make explorations in the areas of love, career and worldviews. Second, instability – when exploring their identity, their shifting choices in love and work make this life stage potentially unstable. These instabilities can bring negative impacts on emerging adults who live with an unstable and unpredictable life (Atwood & Scholtz, 2008). Third, self-focus – emerging adults have less restrictions from parents and teachers than adolescents do and have fewer commitments and obligations than adults do. Therefore, in this life stage, EA is a much more self-focused time (Arnett, 2015). By making decisions on their own, emerging adults learn to be self-sufficient (Twenge, 2006). Fourth, feeling in-between – the majority of emerging adults no longer feel like adolescents, as they are leaving home for college or work and gaining a sense of autonomy. However, they do not yet perceive themselves as having fully reached adulthood for various reasons. Thus, they perceive themselves as being in an in-between state (Arnett, 2004). Fifth, possibilities/optimism – emerging adults have not settled down to the fixed path of marriage, parenthood and career. Most of them believe there are a wide range of options waiting for them to be explored and the fulfillment of all their hopes seems possible (Arnett, 2015; Arnett, 2007). However, it is worth noting that these five features are more commonly reported among emerging adults rather being proposed as universal features in relative to other age groups (Arnett, 2007). Furthermore, Arnett (2000, 2014) recognized from the initial proposal of the concept of emerging adulthood that its features may vary across cultures and societies. As described in more details in the next section, the Inventory of Dimensions of Emerging Adulthood (IDEA) has been introduced to quantify Arnett's five features of EA.
EA-related instrumentSince the five features of EA were proposed (Arnett,2000), Reifman et al (2007) developed an instrument called the Inventory of the Dimensions of Emerging Adulthood (IDEA), to measure individual's perceptions of EA (Arnett, 2000). In the process of developing the original IDEA-31, an additional dimension named “other-focus” was added, ultimately generating six sub-scales: identity exploration, experimentation/possibilities, negativity/instability, feeling in-between, self-focused, and other-focused. Since then, more and more studies were conducted in different countries (see Supplementary table 1), and IDEA was translated into various languages and revised to new models, which manifested cultural differences across countries. Additionally, IDEA was examined for its relations with psychological variables, such as happiness (Reifman, et al., 2007), risk behaviors (Lisha et al., 2014), self-esteem (Galambos et al., 2006), depressive symptom (Luyckx et al., 2011) and social anxiety (Lanctot & Poulin, 2018). However, at the time of writing this article, a validated Chinese version of IDEA is lacking. This translation is essential not only to have a validated scale to use in Chinese-speaking individuals, but also to examine if we can observe differences in the scale structure due to the unique cultural context in China.
China, as the most populous developing country in the world, presents a very complex picture of social and cultural structures, where modern and traditional lifestyles coexist simultaneously within the society. Since the profound reforms and opening up in the last years, China has undergone an intensive process of urbanization and modernization (Chan et al, 2008). Huge changes happened in the lifestyles, views and values of the younger Chinese individuals. The phenomenon of EA (e. g. later ages of marriage and parenthood, the rise of years spent in education and prolonged job instability) is also manifested in the younger generation of people living in China. Of note, the individualism is socially desirable in America, while the Chinese culture has a greater emphasis on family- and community-oriented collectivism (e.g., Triandis, 1995). Family obligations are also emphasized in the role of an adult in China (Nelson et al. 2004; Zhong & Arnett, 2014). Moreover, Confucianism that has existed in China for more than 2000 years has a substantial influence on Chinese values even today, such as the emphasis of a sense of duty and responsibility and filial piety (Zhang et al, 1999). Considering those differences and similarities between China and western countries in personal and cultural beliefs, it seems crucial to investigate whether EA theory is applicable to Chinese culture and, in turn, to expand the current knowledge on EA.
The influence of socioeconomic status on EA experienceThe influence of socioeconomic status (SES) on EA experience has long been discussed in EA research across countries. However, EA theory has been criticized as not applying across socioeconomic status. But most studies have confirmed that there were consistencies across socioeconomic class in the five features of EA (Arnett, 2016; du Bois-Reymond, 2015; Silva, 2016). Of note, several studies pointed out that compared to the middle class, this developmental period is shorter for lower socioeconomic classes (Arnett et al., 2011; Galambos & Martínez, 2007; Swartz, 2008). Arnett (2016) suggested mother's educational attainment as a good representation of emerging adults’ socioeconomic status, for the reason that many of them are still pursuing for their education and have unstable or little income. However, provided that there has already been a wide range of research concerned with socioeconomic status in China, this study decided to apply the common measurement of socioeconomic status used in Chinese research. Ren (2010) proposed that the most common measurement of students’ socioeconomic status is to put the level of parental educational, parental occupation and income into account. However, parents’ income is not a good choice to indicate the family's socioeconomic status for the reasons as follows. Firstly, the information of parents’ income is hard to collect (Sun, 1999), as emerging adults may not know the real income of their family. Second, parents’ income may be unstable when their emerging adults were growing up. Third, if using parental income in the study, there comes another question of whether to include the income of noncustodial parent who may not contribute to the support of the family (Cherlin, 2009). Therefore, in this study, the SES criterion was based on the parental educational attainment and work status of emerging adults in China.
The importance of validation of IDEA-CPrevious EA research on Chinese emerging adults has several limitations. First, researchers (Nelson et al., 2004; Nelson & Chen, 2007; Badger et al., 2006; Cheung et al., 2019) did not account for Hukou, a system of household registration in mainland China, which consists of agricultural and non-agricultural residency status (often referred to as rural and urban) (Yin, 2015). Second, most findings on EA in Chinese populations are based on studies with relatively limited sample size. For example, Nelson et al. (2004) investigated perspectives of 207 Chinese college students towards EA; To & Sung (2017) explored the subjective well-being of emerging adults based on the sample of 251 Chinese community college students in Hong Kong. Thus, the results would be less convincing to be generalized to the whole population. Furthermore, only a few studies on EA were conducted in Chinese samples and most of them were conducted relatively far from the present (Nelson & Chen, 2007). Therefore, their evidence might not reflect the current state of Chinese emerging adults since the development of China in economy and society in recent years is extremely fast. Finally, limited research has been conducted to develop or revise instruments that could be used to measure EA in China. In this context, no attempt has been made to validate the IDEA, being the most established tool to measure the features of EA. Based on previous studies and their limitations, it was noticed that the phenomenon of EA varied across cultures, and that a validated Chinese version of an established measurement tool of EA such as the IDEA is still lacking. Hence, the present study aims to develop and validate a Chinese version of IDEA with a factor structure that fits in Chinese sample.
Study 1The aim of Study 1 was to validate the IDEA among Chinese college samples.
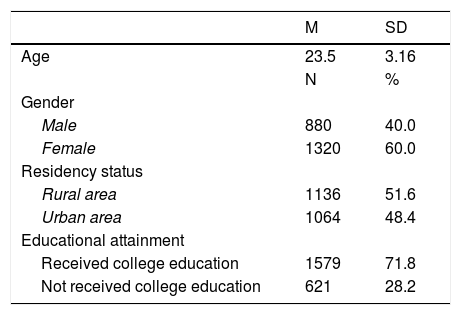
MethodParticipants and proceduresParticipants were recruited from universities across China. The study was conducted from October to November in 2021. A total of 6244 undergraduates volunteered to participate in our study by completing the packet of self-report questionnaires (IDEA-C, DASS-21, SWLS and RSES) via an online survey tool (Questionnaire Star). Each packet contained the measures in a pre-determined random order. Among those 6244 responses, 1160 responses were deleted due to the invalid answers (e.g., invalid demographic information, same response across items of all scales, or age beyond 30 years old). A total of 5084 respondents provided complete, yielding a valid response rate of 81.42%.
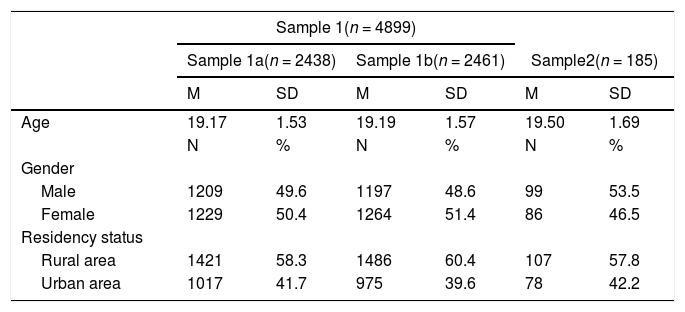
Data were analyzed in several stages. First, sample 1 (n = 4899) was randomly divided into two parts: sample 1a (n = 2438) and sample 1b (n = 2461). Second, a retest of IDEA-C was conducted on randomly selected of 185 undergraduates (of the total sample size) to determine the test-retest reliability. All demographic variables of each sample are displayed in Table 1.
Descriptive statistics of participants for each sample.
The questionnaires included demographic information (e.g., age, sex, residency status [rural vs urban], parents’ educational level and occupation), the Chinese version of the IDEA (as described above), and a battery of scales as follows. The scales were chosen to validate the IDEA in relation to various aspects of psychological functioning.
Translation of the IDEA into mandarin ChineseThe adaptation of the IDEA was authorized by the author of the original scale. Of note, translation in this study (Appendix 1) followed the recommended procedures for cross-cultural adaption of self-report questionnaires (Beaton et al., 2000). Step 1 involved initial translation: The original IDEA was independently translated (by two researchers in psychology who are fluent in English) into Chinese. Step 2 focused on verification of translations in which a third psychologist was invited to evaluate whether any discrepancies between the two emerged (if so, a group discussion among three experts was held till a consensus was reached). Step 3 was the process of back translation: To confirm the meaning of translation that remains same, the initially translated Chinese version was back translated by one professor who was bilingual. Notably, the back translator had never seen the original version of the IDEA. In Step 4, the well-translated version in Chinese was sent to four experts (one developmental psychologists, one psychometric psychologist, and two health psychologists) for their review, which led to a prefinal Chinese version with conceptual equivalence to the original version. The prefinal version was used in Step 5 to carry out a preliminary test among a relatively small sample (n = 20 undergraduates) to determine the comprehensiveness of the Chinese version. In the following step, all suggestions and modifications proposed by the participants of the preliminary test were discussed by the researchers and a group of experts. Efforts were made to minimize differences between the translated version and the original scale as best as possible.
The depression, anxiety, and stress scale-21(DASS-21)The Depression, Anxiety and Stress Scale-21 Items (DASS-21) was used to measure the emotional states of depression, anxiety and stress with each subscale containing 7 items. Participants were asked to respond on a 4-point scale (0 to 3 points) (Antony et al., 1998). The DASS-21 was validated among Chinese college students, with Cronbach's alpha of 0.89 (depression), 0.86 (anxiety), and 0.90 (stress), respectively (Gong et al., 2010). In the current study, the internal reliability of the DASS-21 was 0.878, 0.877, 0.738 for depression, anxiety, and stress subscales, respectively (Cronbach's alpha).
The satisfaction with life scale (SWLS)The Satisfaction with Life Scale (SWLS) developed by Diener et al (1985) was used to assess satisfaction with one's life as a whole. The SWLS with five items has been culturally adapted since 1985, for example, its psychometric properties were also validated among Chinese population with the internal consistency of 0.92 (Bai et al., 2011). Response options were made from “strongly disagree” (1) to “strongly agree” (7). Higher scores indicate high satisfaction. In the current study, the internal reliability of the SWLS was 0.901 (Cronbach's alpha).
Statistical analysisDescriptive data were analyzed via SPSS (Statistical Package for Social Science, Version 26). In this study, three individual samples were separated for their respective analyses. Given the fact that this is the first Chinese validation study on IDEA, Sample 1a (n = 2438) was initially tested with item analysis and exploratory factor analysis (EFA) using SPSS (Version 26). Based on that, Sample 1b (n = 2461) was used for confirmatory factor analysis (CFA) to confirm the factor structure of the IDEA-C identified in Sample 1a. Internal consistency and concurrent validity were tested on Sample 1 (n = 4899). Finally, Sample 2 (n = 185) was used to examine test-retest reliability.
Firstly, to determine the factor structure of the IDEA, EFA with the principal components factorial analysis and oblique rotation (Promax) was applied in sample 1a, as we anticipated that factors were correlated (Costello & Osborne, 2005). Parallel analysis was applied to indicate the number of factors to retain (O'Connor, 2000). Factor loadings were then examined to achieve the best fitting model; Items were eliminated with loadings below 0.45 (Tabachnick & Fidell, 2013), cross-loading above 0.32 and communalities below 0.40 (Costello & Osborne, 2005) . And factors loaded by at least three items were retained (Costello & Osborne, 2005).
Third, given the normally distributed data, CFA with ML (Maximum Likelihood Estimation) was performed to determine whether the proposed factor structure of the IDEA-C based on Sample 1a could achieve the goodness of fit, using Mplus (Version 8) (Muthén & Muthén, 2011). Model fit was estimated with the recommended indices (Hu & Bentler, 1999): (1) The normed χ2, the chi-square value divided by the degrees of freedom; (2) the comparative fit index (CFI) and the Tucker‐Lewis Index (TLI); generally, values of the CFI and TLI exceeding .95 indicate a good fit, and those ranging from 0.90 to 0.95 indicate reasonable fit ; (3) the root-mean-square error of approximation (RMSEA), in which the criterion for a reasonable fit is < .06; (4) the standardized root mean squared residual (SRMR) below .08 indicates a relatively good model fit.
Finally, concurrent validity and internal consistency were analyzed in sample 1 (n = 4899); and test-retest reliability was calculated in sample 2 (n = 185). Concurrent validity was tested using the Pearson correlations between IDEA-31 and DASS-21, SWLS and RSES. Internal consistency was tested with alpha coefficients, whose value is bigger than .70 indicating good internal consistency (Hair et al., 2010). Test-retest reliability (reflecting degree of consistency during different periods of time) with .7 and greater is acceptable (Weir, 2005).
ResultsFactor structureExploratory factor analysisTo determine sampling adequacy, the Kaiser-Meyer-Olkin (KMO) test and the Barlett's test of sphericity were conducted in Sample 1a. In the present study, the KMO measure with 0.949 was greater than the cutoff point of 0.5. the Barlett's test of sphericity has reached a significant level (χ2=43324.965, df=465, p < 0.001), suggesting that exploratory factor analysis was applicable to the data (Hair et al., 1998).
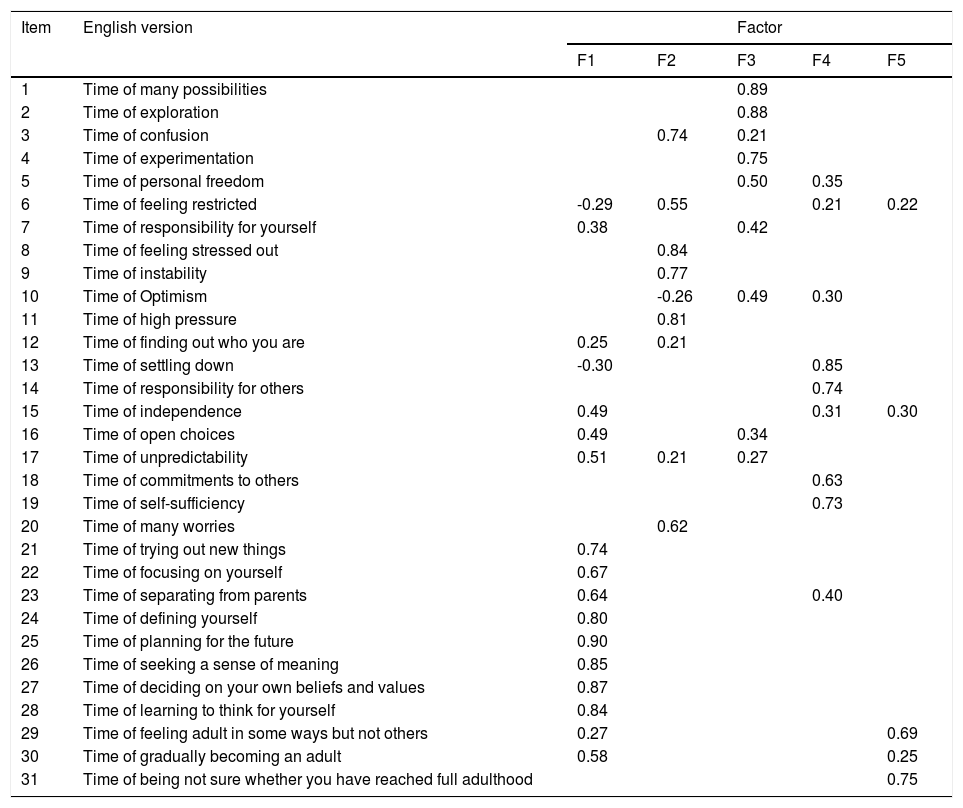
The scree plot (Fig. 1) presents 5 components with eigenvalue of > 1, generating a five-factor structure. Which was also suggested by the results of parallel analysis. The five factors accounted for 59.87% of variance. And Table 2 presents the factor loading of each item after oblique rotation. As it shown, all items had distinctively high loadings in the respective five factors, except that item 12 exhibited factor loadings of <0.40 and item 5, 6, 7, 10, 15, 16, 17 and 23 exhibited cross-loadings (> 0.32 on the other factor). With respect to the low factor loading (lower than 0.40) and high cross-loading (higher than 0.32), we decided to remove item 5, 6, 7, 10, 12, 15, 16, 17 and 23. Moreover, considering that the fifth factor was loaded by only two items, we decided to not retain this factor, hence eliminating also items 29 and 31.

Factors & factor loadings over 0.2 on the corresponding factor (five-factor model, n = 2438, pattern matrix).
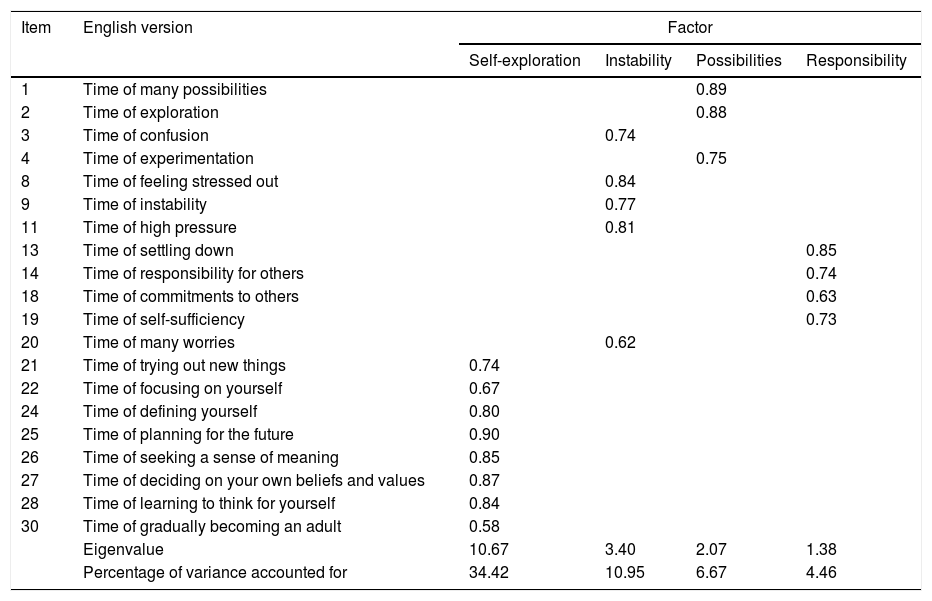
Then, there were 20 items left in the four remaining factors (results shown in Table 3). Factor 1(items 21, 22, 24, 25, 26, 27, 28 and 30) was named as self-exploration. The second factor includes items 3, 8, 9, 11 and 20), which was labeled as instability. The third factor contained three items (items 1, 2 and 4) was labeled as possibilities. Factor 4 (items 13, 14, 18 and 19) was called responsibility.
Final Results of Exploratory Factor Analysis (pattern matrix).
In the present study, using the data from Sample 1b, the CFA (Fig. 2) suggested moderately good model fit for the final four-factor model with 20 items (χ2 (190) = 1116.84., p < .001; CFI = 0.97; TLI = 0.96; SRMR = 0.039; RMSEA = 0.050 [90% CI = 0.047–0.052]).
Concurrent validity.")
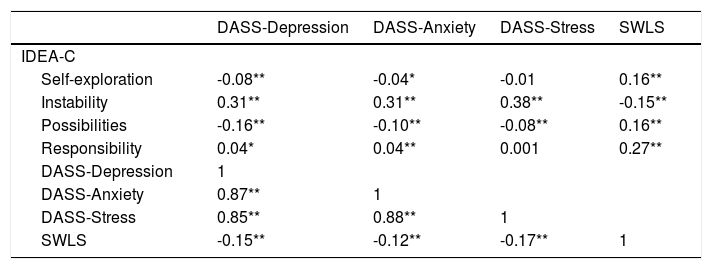
The Pearson correlations (r) between total score of the IDEA-C (and its associated subscales), DASS-21, SWLS and RSES scale were used to determine the concurrent validity of the IDEA-C. Correlations between IDEA-C and validation scales are shown in Table 4. Significant correlations in the expected directions were observed between the IDEA-C and other validated scales.
correlations between IDEA-C and validation scale(n = 4899).
Note: **Statistically significant at p <0.01, * Statistically significant at p < 0.05; IDEA-C Chinese version of the inventory of the dimensions of emerging adulthood, DASS-21 The Depression, Anxiety, and Stress Scale-21, SWLS The Satisfaction with Life Scale.
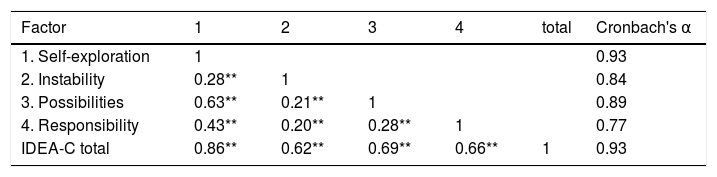
The Cronbach alpha coefficients for internal consistency of each subscale and of the total scale for undergraduate sample 1 (n = 4899) was high (see Table 5).
Correlations of all the factors of IDEA-C and internal consistencies.
Note: ** Statistically significant at p < 0.01.
Test-retest coefficient was used to determine the stability of IDEA-C. The values of Pearson correlation are as follows: total score (r = 0.572, p < 0.01), F1 (r = 0.589, p < 0.01), F2 (r = 0.597, p < 0.01), F3 (r = 0.490, p < 0.01), F4 (r = 0.588, p < 0.01). The mean score of the IDEA-C slightly (only descriptively) increased from pre-test (M = 61.86, SD = 6.41) to post-test (M = 62.23, SD = 5.98). There was no statistically significant difference between the two measurements of each subscale of the IDEA at a two-week interval.
Study 2The first aim of the second study was to confirm the psychometric properties of IDEA-C proposed in Study 1 in non-student sample. The second aim was to identify the influence of demographic differences (e.g., the socioeconomic status, educational attainment, gender and residency status) on EA experience.
Participants and proceduresThe non-student sample was recruited on Credamo, an online survey platform. At first, we published this survey on the data market of this platform. Then the participants who were not college students at the age range of 18 to 30 years old were received this survey and participated in this study voluntarily. There were a total of 2200 non-student participants in the study 2. To investigate the test-retest reliability, the IDEA was sent to each participant who has attended the pretest after two-weeks interval. Among those who completed the retest of IDEA, we randomly selected 500 participants and employed their responses. Each participant was compensated with 11 RMB once the researcher accepted his or her responses. The demographic information of non-student sample (n = 2200) is shown in Table 6.
The total sample (n = 7099) is composed of the college sample (n = 4899) and non-student sample (n = 2200). The demographic information including socioeconomic status of the total sample was collected when study 1 and 2 were conducted.
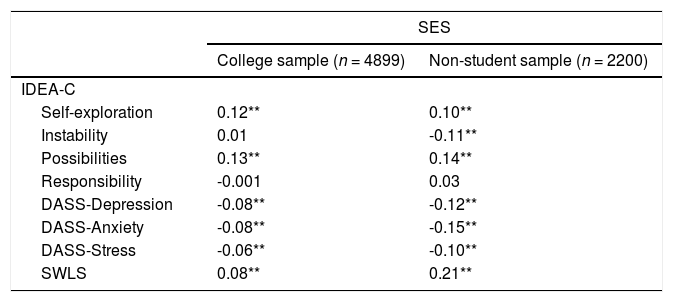
In this study, the socioeconomic status (SES) of participants is measured with their parents’ educational level and occupation. The measurement of parent's educational attainment consisted of 6 categories as follows: (1) no schooling; (2) elementary school; (3) middle school; (4) high school; (5) undergraduate; and (6) postgraduate or doctorate (Lin & Bian, 1991). The occupation was measured with the following 5 categories: (1) Temporary workers, unemployed, workers waiting for employment, non-technical and agricultural workers, such as farmers; (2) Manual labor workers and self-employed workers, such as construction workers; (3) General managers and technical personnel, clerical staff, such as salespersons, drivers, etc.; (4) Middle management personnel, middle professional and technical personnel and assistant professional personnel, such as teachers, doctors, technicians, etc. (5) professional senior management personnel and senior professional and technical personnel, professional executives, such as civil servants, manager, etc.(Shi & Shen, 2007). The participants were required to choose each category of the two questions according their realistic situations. The rank order of these categories was coded as the scores of each question. The sum total of scores of the four questions was used as a measure of socioeconomic status of the participant. The higher the scores, the higher the socioeconomic status. Correlation analyses were conducted to examine the association between SES with the five features of EA and the influence of college education on EA experience.
ResultsThe validity and reliability of IDEA-C in non-student sampleA CFA with ML was performed to determine the factorial structure of the IDEA in non-student sample. Results indicate an adequate fit ((χ2(158) =710.10, p < 0.001; TLI=0.93; CFI=0.94; RMSEA=0.04 [90%CI=0.037- 0.040]; SRMR=0.038)) of the four-factor model. Factor loadings of the final model was also acceptable, ranging from 0.47 to 0.80 (Fig. 3).
.")
Moreover, reliability tests were conducted on the final factor solution, indicating an adequate internal consistency for all the subscales: Self-Exploration (Cronbach's α=0.75); Instability (Cronbach's α=0.80); Possibilities (Cronbach's α = 0.64), Responsibility (Cronbach's α = 0.73) and the total scale (Cronbach's α = 0.74).
Finally, Test-retest coefficient was examined using Pearson correlation to determine the stability of IDEA-C in non-student sample. The values of Pearson correlation are as follows: total score (r = 0.65, p < 0.01), F1 (r = 0.62, p < 0.01), F2 (r = 0.66, p < 0.01), F3 (r = 0.43, p < 0.01), F4 (r = 0.67, p < 0.01). The mean score of the IDEA-C slightly (only descriptively) increased from pre-test (M = 62.43, SD = 5.46) to post-test (M = 62.71, SD = 4.98). No significant difference was observed between the two measurements of each subscale of the IDEA at a two-week interval.
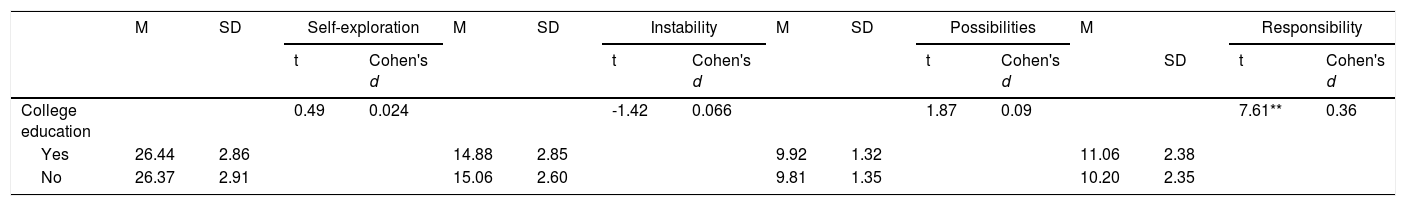
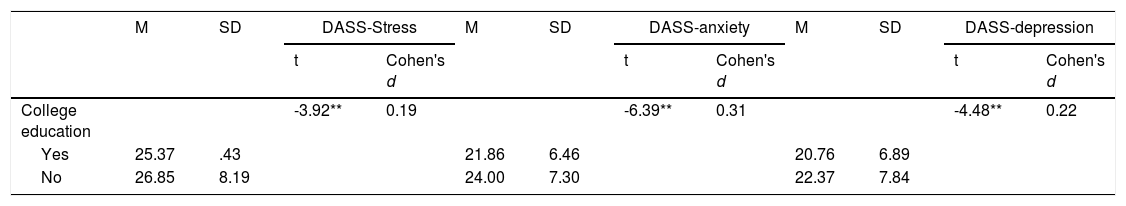
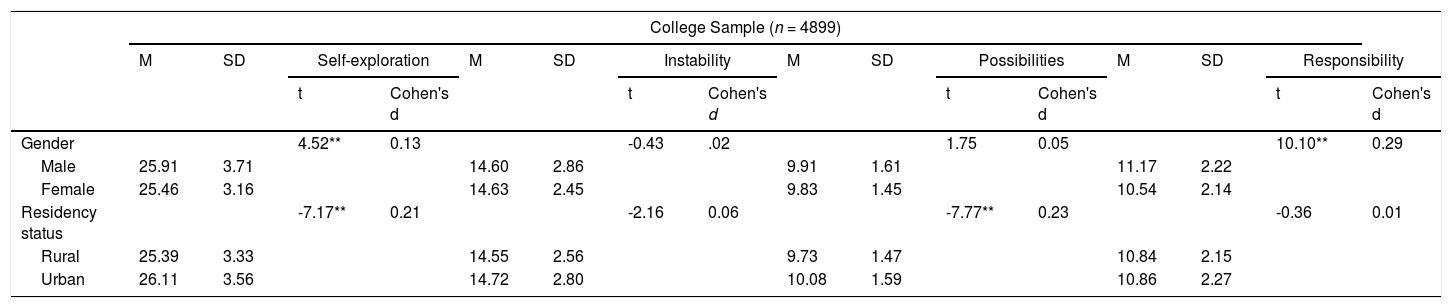
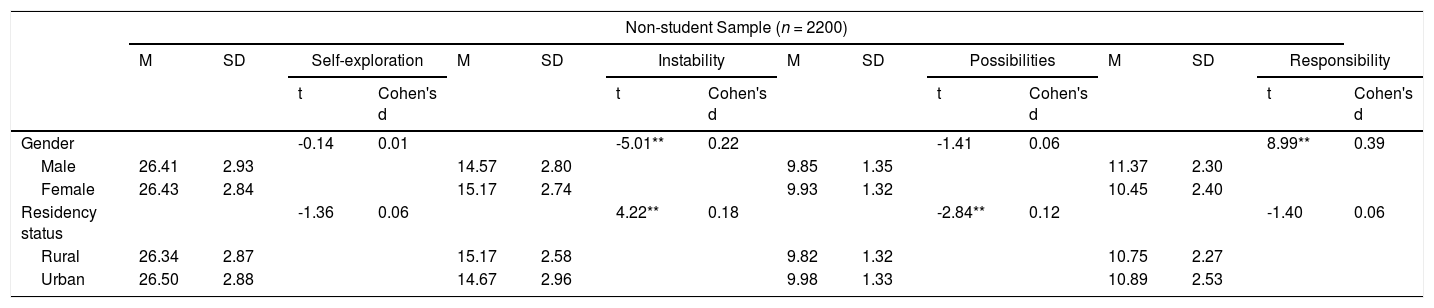
The influence of demographic difference on EA experienceHow college education influenced EA experience was analyzed in non-student sample (n = 2200).Results were shown in Table 7-9. The Pearson correlations (r) between the SES and the subscales of the IDEA-C and the DASS-21, SWLS and RSES scale were examined (Table 10). The Independent Samples t Test was applied to test how emerging adults of different gender and residency status perceived the four factors of IDEA-C (Table 11& 12).
correlations between SES and IDEA-C and other validation scales.
Note: **Statistically significant at p < 0.01.
Demographic differences of the Chinese version of IDEA-23.
Note: **Statistically significant at p < 0.01.
Demographic differences of the Chinese version of IDEA-23.
Note: **Statistically significant at p < 0.01.
In the present study, the psychometric properties of IDEA-C were examined among Chinese student and non-student sample. In the first study, results of the EFA indicated the four-factor model with highly loaded items, which is further confirmed by results of the CFA. Therefore, the IDEA-C has good structural validity among college sample (n = 4899). Moreover, the IDEA-C was significantly correlated with negative emotions (e.g., depression, stress and anxiety), and life satisfaction, suggesting that the Chinese version of the IDEA had good concurrent validity. In the second study, the psychometric properties were further confirmed in non-student sample (n = 2200). Moreover, the association between socioeconomic status and the subscales of IDEA-C was explored. In sum, the IDEA-C is a valid instrument to evaluate the dimensions of Chinese Emerging Adulthood.
Distinctive dimensions of the IDEA-CDimensions of emerging adulthood seem to be different in China as compared to Western societies. By EFA, there were four factors identified in our study (i.e., self-exploration, instability, possibilities and responsibility). Compared to the original version by Reifman et al (2007), instability remained the stable factors in the structure of IDEA for the Chinese college students. Meanwhile, some differences of the factor structure emerged in the present study. First, factor “self-exploration” (items 21, 22, 24, 25, 26, 27, 28 and 30) was made from the original factor “possibilities (item 21), factor “identity exploration” (item 24, 25, 26, 27, 28), factor “feeling in-between” (item 30) and factor “self-focused” (item 22). The reason why it was labeled as “self-exploration” are as follows. First, emerging adults perceived this developmental transition as an opportunity to autonomously engage in new things and pursue self-improvement (Arnett, 2004, 2005), which is also indicated by item 21 and 22. Second, in this time of gradually becoming an adult, emerging adults will try a bunch of options to explore their identity, as these are expressed by item 24, 25, 26, 27 and 28 (Reifman et al., 2007).
Comparable to other countries (Reifman et al., 2007; Atak & Çok 2008; Lisha et al., 2014;Pérez et al., 2008), Chinese emerging adults also show the feature of instability. Emerging adulthood is thought to be the most unstable period of the lifespan (Arnett, 2014). For many, this transitional stage of life is marked by pronounced transitions in both personal life (e.g., relationships) and professional life (e.g., education, work) (Reifman et al., 2007). Similar to Western societies, Chinese adults between 18- to 29- year-olds often struggle to adapt themselves into the adult roles, especially college students leaving their home for the first time in their lives.
Concerning the factor “possibilities”, there is a little difference between the current subscale and the original one, with original items 16 and 21 were left out and item 21 was loaded on “self-exploration” subscale, which possibly resulted from the interpretation of the Chinese version of these items. When translated into mandarin Chinese, item 21‘time of trying out new things” indicate a positive feeling of future that encourages emerging adults to make self-exploration, while item 1 ‘time of many possibilities’, item 2 ‘time of exploration’ and item 4 ‘item of experimentation’ express more neutral feelings that there are many possibilities negative or positive in the future.
The factor “responsibility” consisted of three original “other-focused” items (item 13, 14 and 18) and one original “self-focused” item (item 19). The reasons why this factor was named as “responsibility” are attributed to the Chinese cultural contexts. First, for a long time, China and other Asian countries were considered as collectivistic: high on concern for the community and group and low for the individual, which put much emphasis on individuals’ responsibility for others and the group. The “other-focused” items 14 and 18 were a manifestation of Chinese collectivistic values. Second, the sense of responsibility is emphasized in Confucianism, which has influenced and shaped Chinese traditional culture for thousands of years, especially Chinese family values (Park & Chesla, 2007). In the value of Confucianism, grown-ups are required to bear the responsibilities for family, society and country . In Asian culture, one key responsibility of a younger adult is to avoid that the family worries about them and their life situation. Moreover, settling down and being self-sufficient, being two of the significant features of being an adult, were considered as the individuals’ responsibility to meet their parents’ expectations. The collectivistic and Confucian thoughts can explain why the original self- and other-focused subscales were integrated in one dimension of responsibility in Chinese version of the IDEA, which shows the uniqueness of Chinese culture.
Comparable to other studies that examined the IDEA (Atak & Çok, 2008; Lisha et al, 2014; Pérez et al., 2008), the “feeling in-between” subscale was not distinguished during validation of the scale in Chinese sample, with two of three “feeling in-between” items removed and one included in the scale “self-exploration”, which indicates that the feeling of being in-between is not a typical dimension of Chinese emerging adulthood. The possible reason for the deleted items (item 29 ‘time of feeling adult in some ways but not others and item 31 ‘time of being not sure whether you have reached full adulthood’) is that these characteristics were not unique in EA but also appeared on other life stages. Being in the transitional period between adolescent and adulthood, there is no doubt that emerging adults feel themselves on the way into adulthood, which is why the item 30 belonging to the original “feel in-between” was preserved.
IDEA items deleted from the IDEA-CThe Chinese version of IDEA was reduced from the original 31 items to 20 items. Items 5 (“time of personal freedom?”),6 (“time of feeling restricted”), 7 (“time of responsibility for yourself?”), 10 (“time of optimism?”), 12 (“time of finding out who you are?”), 15 (“time of independence?”),16 (“time of open choices”), 17 (“time of unpredictability”), 23 (“time of separating from parents?”), 29 (“time of feeling adult in some ways but not others?”) and 31 (“time of being not sure whether you have reached full adulthood?”) were eliminated due to the low factor loading or high cross-loading. A possible explanation for the low factor loading or high cross-loading of the deleted items could be, firstly, Chinese people have a greater possibility of making a sacrifice for the benefits of society and are less likely to pursue personal needs and rights such as freedom (Hsu, 1985). Previous studies indicate the collective spirits in Confucian ideology have been taught in Chinese culture (Bond & Hwang, 1986). In this cultural context, personal freedom is a phrase that does not appear frequently in daily conversations, especially when it is translated into Mandarin Chinese. This could be the reason for the high cross-loading of item 5 that, in turn, necessitates its removal from the Chinese version of the IDEA. In addition, item 7 was deleted because the ambiguity of the definition of “responsibility for yourself”, which can, for instance, indicate “the responsibility for your financial income” or “the responsibility for your actions”. Item 6 (“time of feeling restricted”) and Item 10 (“a time of optimism”) was removed given that it is not a unique feature of EA. Moreover, item 12 (“finding out who you are”) was deleted due to the low factor loading during the process of scale validation, which possibly resulted from the Chinese translation of item 12. Just as reflected by some participants, the Chinese expression of “finding out who you are” is a bit of unfamiliar to Chinese individuals and thus may resulted in incomprehension of its meaning.
As proposed by Arnett (2000), EA is characterized by relative independence from social roles and form normative expectations. The push for independence includes financial independence, which is also a key feature of adulthood (Butterbaugh et al, 2020). However, most college students in China have not achieved the goal of financial independence and mainly get financial support from their parents (Huang, 2014). This is because most of college students’ sense of financial independence is not strong as a result of school and family educational focus on the improvement of students’ academic achievements rather than the development of students’ sense of independence. On the one hand, Chinese parents find it hard to let go of their grown-up children for the family obligations. On the other hand, since economic growth has slowed down and the employment pressure has been rising, many college students depend on their parents to relieve their financial stress (Tang, 2001). Taken the above-mentioned evidence into account, the most colleges students’ dependence on their parents both financially and emotionally, and thus items 15 and 23 were deleted during the process of validation of IDEA.
The IDEA-C in relation to other aspects of psychological functioningBesides, the current study examined the links between other scales frequently applied in EA research and the EA-related features captured by the IDEA. As Arnett (2004) proposed, emerging adults seem to have a greater possibility of experiencing negative emotions, discomfort, and chronic anxiety, which may originate from the poor ability to manage the EA-related external stressors. The abundance of possibilities can also be accompanied with the source of uncertainty and anxiety. In the current study, the factor “instability" was positively correlated with three subscales of DASS-21 (the subscale of Depression, Anxiety and Stress, distinctively); the factors “self-exploration” and “possibilities” was negatively correlated with the three subscales, which echoes the theory. Although EA is often a time of struggle and mixed emotions, most emerging adults hold a positive view of their future (Arnett, 2014). In accordance with previous studies, the factor “self-exploration” was positively associated with life satisfaction (Negru, 2012). In a comparable manner, the factor “instability” was negatively associated with life satisfaction (Reifman et al., 2007).
The influence of demographic difference on EA experienceMoreover, differences concerning gender and residency status (rural area vs. urban area) on the IDEA-C were observed. In both samples, as compared to women, men scored higher on the subscale “responsibility”, which was in accord with the traditional gender role that men are responsible for “matters outside the home”, whereas women are responsible for matters “inside the home”. This fits to the evidence that men are encouraged to go outside to make self-explorations and take more responsibilities (Eccles, 1990). Besides, higher scores of the subscale “possibilities” were found in individuals with urban residency status than their peers with rural residency status, which is might be driven by the fact that towns and cities provide more opportunities for them to try new things and explore themselves. Moreover, for college students, emerging adults with urban residency status are more likely to make self-explorations; for nonstudents, emerging adults with rural residency status are more possible to feel instable. The latter is perhaps related to the fact that urban citizens get more access to a series of social security and welfare, such as health care and retirement pension (Yin, 2015).
Besides, as the results shown in the second study, emerging adults who have not received college education scored higher on the subscale of “responsibility” and three subscales of DASS, scored lower on the scale of life satisfaction and also had a lower socioeconomic status compared to their peers who had entered the college. Because low educational attainment is usually linked with relatively insecure and poorly paid jobs and a heightened risk of unemployment (Chen & Wu, 2007; Lin & Chan, 2021). Thus, those emerging adults without college credentials may experience more negative emotions and less life satisfaction when exploring their lives. Concerning emerging adults from affluent background are more possible to complete college education (Sassler & Miller, 2011), those who have lower educational attainment tend to have a less affluent family. The absence of post-secondary education makes them enter the job market and take the responsibility of supporting themselves or their families earlier than their peers who have entered the college, which also may make their EA shorter.
Of note, the associations between the socioeconomic status and validation scales were examined. The factor “self-exploration” and the factor “possibilities” are positively associated with higher socioeconomic status in both samples, while the factor “instability” is positively related to lower socioeconomic status in non-student sample; The three subscales of DASS were negatively related to higher socioeconomic status, while the life satisfaction was positively associated to higher socioeconomic status in both samples. These results are consistent with previous literature that “emerging adults from lower socioeconomic classes experience their emotional lives less positively and more negatively that their higher socioeconomic peers” (Arnett, 2016). Besides, emerging adults from higher socioeconomic classes experience a stronger sense of exploring themselves and feel more possibilities in their lives as compared to their lower socioeconomic peers, who see their lives as having more instability.
Limitations and future researchThe present study has some limitations that needs to be acknowledged and considered. First, the use of self-reports can be influenced by social desirability bias affecting subject's response to specific items of the questionnaire. Second, the data was collected through anonymous online survey and did not include the open-ended questions, which limits an in-depth investigation of personal experience of EA. Therefore, future research can execute from the following aspects. Firstly, future studies should investigate the influence of additional demographic variables (e.g., cohabitation, material status) on EA experience. Second, researchers of various disciplines are encouraged to conduct more qualitative and empirical research on the phenomenon of EA to gain a more comprehensive understanding of this critical developmental stage. Third, considering scale development is an ongoing process, future studies should aim to refine and further develop the IDEA-C based on local cultural differences (e.g., with respect to different Chinese cultural communities).
ConclusionIn summary, this study translated and validated the Chinese version of the IDEA. We observed significant demographic differences in the subscales of IDEA-C as compared to the original version of the IDEA necessitating a cultural adoption of the questionnaire. Based on the good psychometric properties of the IDEA-C, this study paves the way for the further application of the IDEA-C to study the phenomenon of EA in Chinese-speaking samples.
Acknowledgements: This study is supported by Start-up Research Grant of Shenzhen University (20200807163056003) and Start-Up Research Grant (Peacock Plan: 20191105534C).
Ethics statementThis study was approved by the Ethics Committee of Shenzhen University in China (NO.PN-2021-048). Written informed consent was obtained from all participants before they took part in any study procedure. Participants were assured that personal identities would not be disclosed in subsequent research reports.
articles
