


This study aims to identify objective biomarkers of fibromyalgia (FM) by applying artificial intelligence algorithms to structural data on the neuroretina obtained using swept-source optical coherence tomography (SS-OCT).
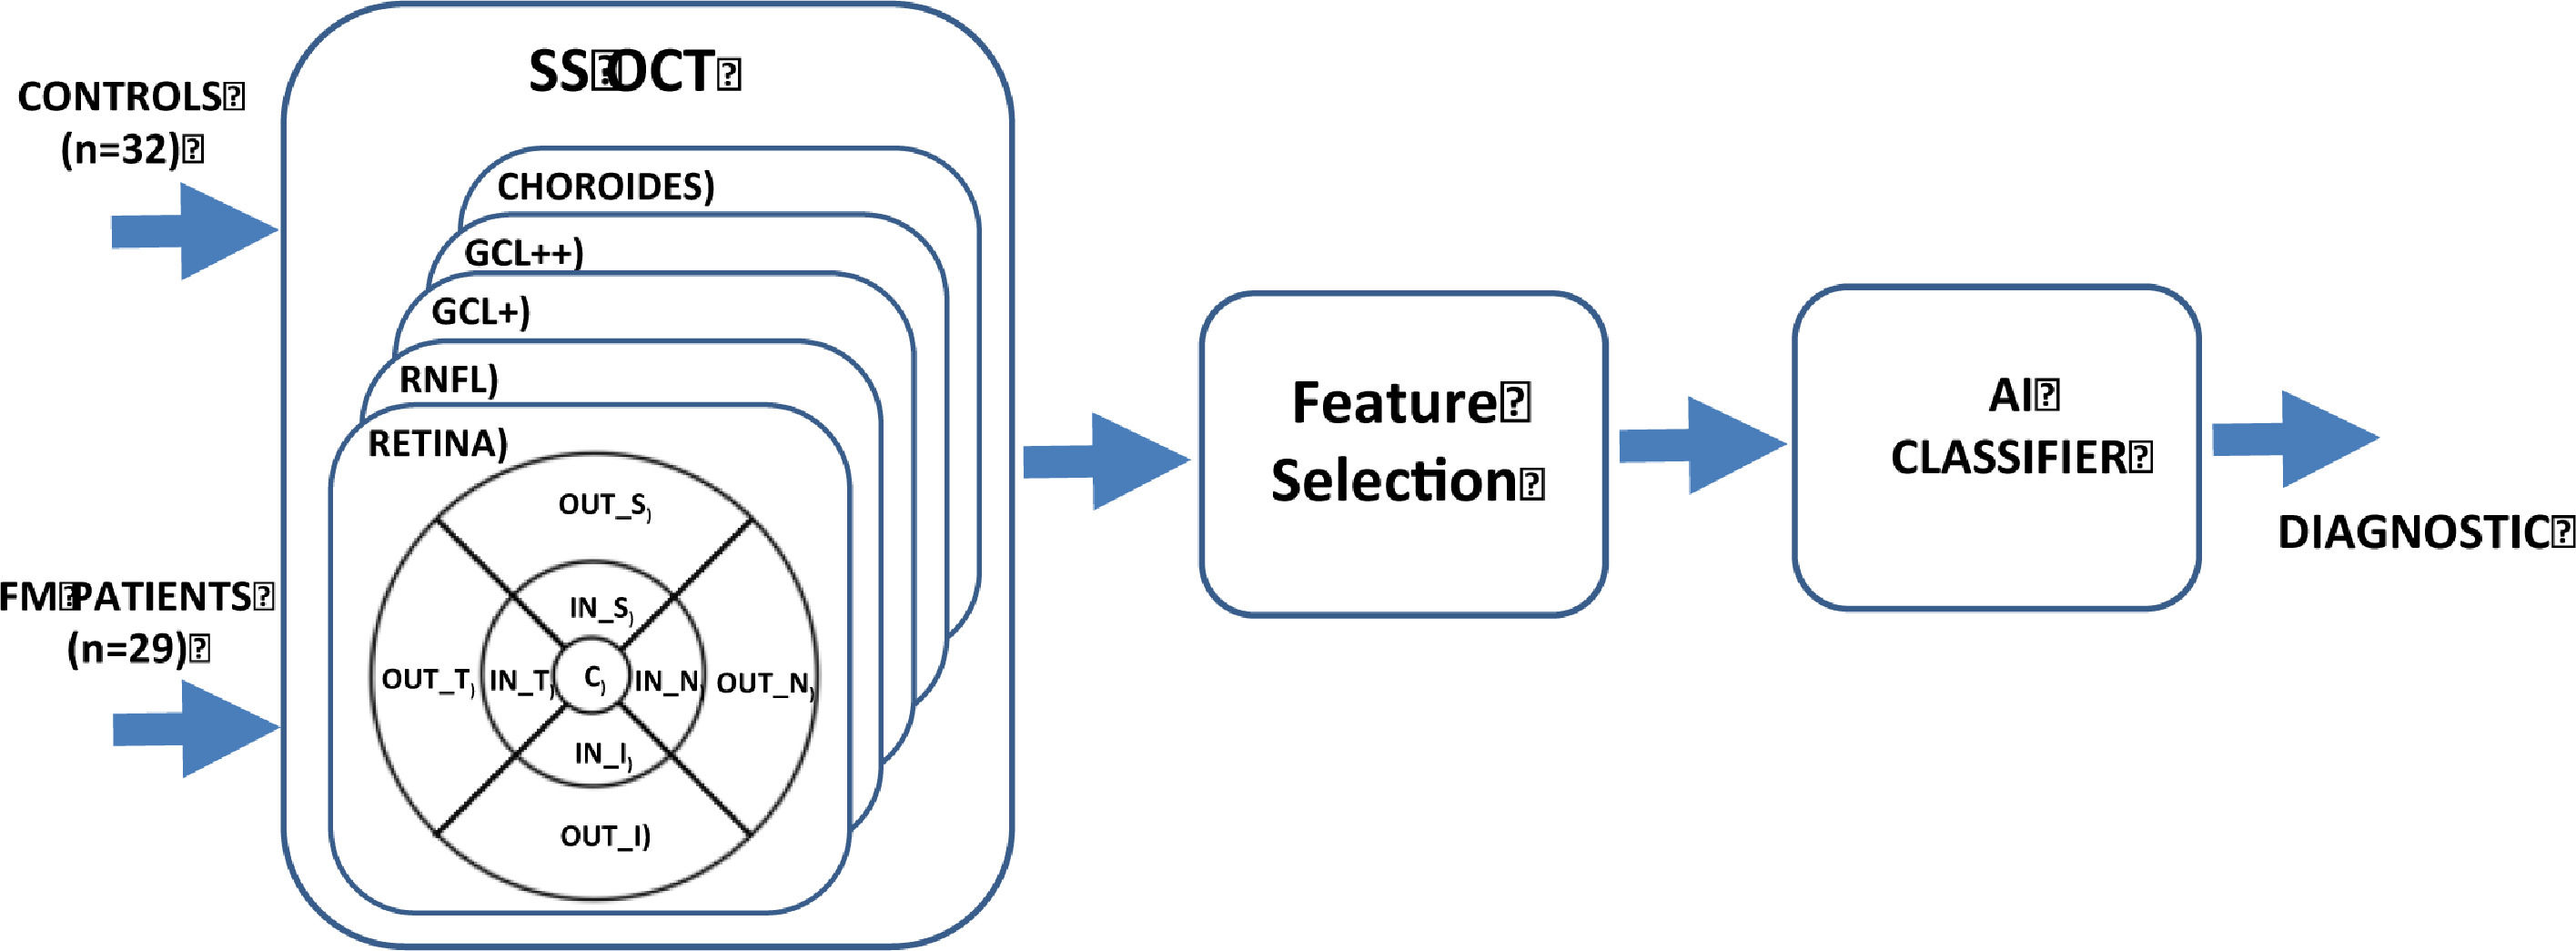
MethodThe study cohort comprised 29 FM patients and 32 control subjects. The thicknesses of complete retina, 3 retinal layers [ganglion cell layer (GCL+), GCL++ (between the inner limiting membrane and the inner nuclear layer boundaries) and retinal nerve fiber layer (RNFL)] and choroid in 9 areas around the macula were obtained using SS-OCT. Discriminant capacity was evaluated using the area under the curve (AUC) and the Relief algorithm. A diagnostic aid system with an automatic classifier was implemented.
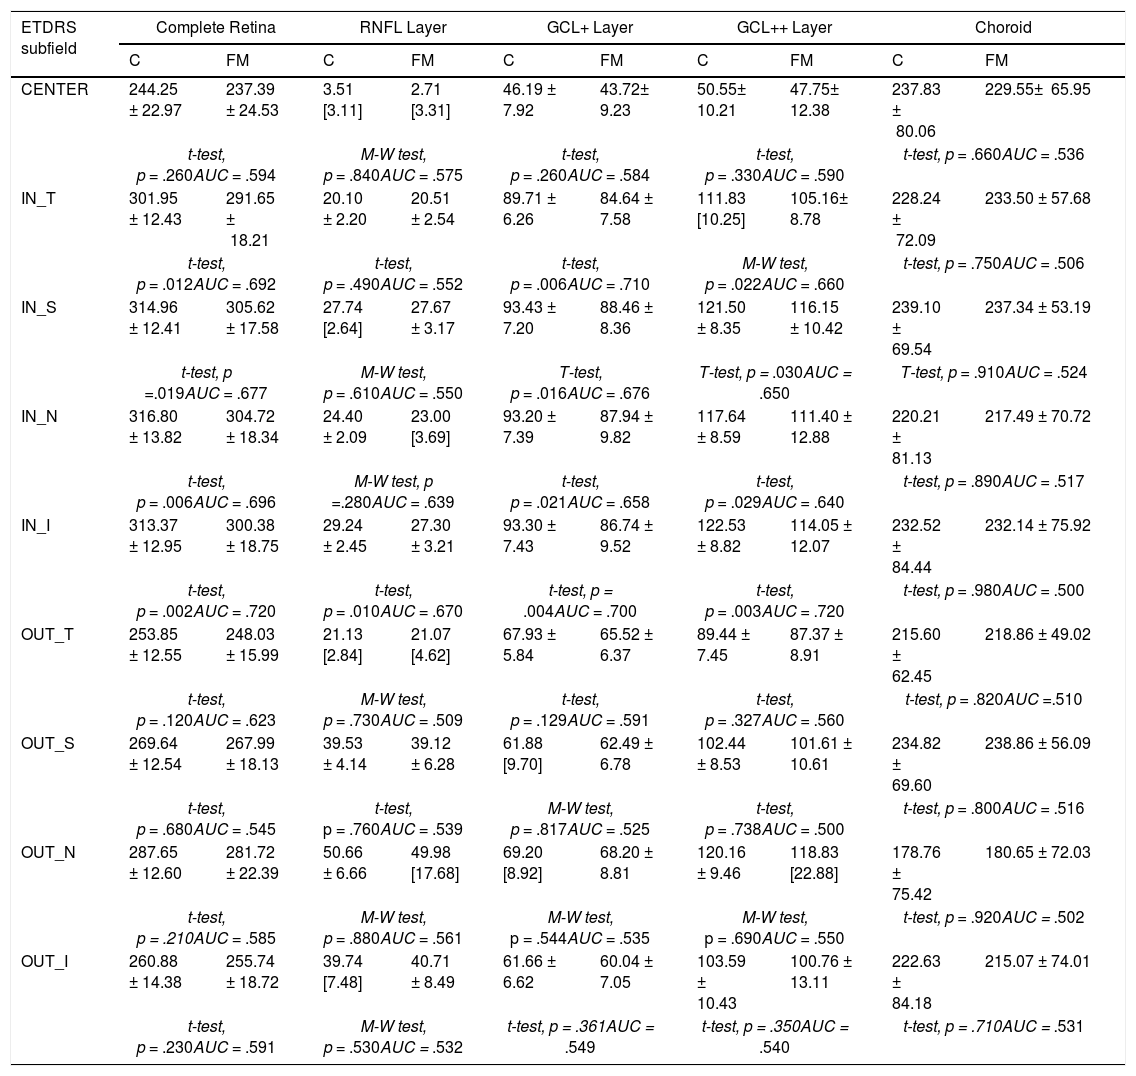
ResultsNo significant difference (p ≥ .660) was found anywhere in the choroid. In the RNFL, a significant difference was found in the inner inferior region (p = .010). In the GCL+, GCL++ layers and complete retina, a significant difference was found in the 4 regions defining the inner ring: temporal, superior, nasal and inferior. Applying an ensemble RUSBoosted tree classifier to the features with greatest discriminant capacity achieved accuracy = .82 and AUC = .82.
ConclusionsThis study identifies a potential novel objective and non-invasive biomarker of FM based on retina analysis using SS-OCT.
Identificar biomarcadores objetivos de fibromialgia (FM) aplicando inteligencia artificial a datos estructurales de retina obtenidos mediante tomografía de coherencia óptica Swept Source (TCO-SS).
MétodoSe evaluó una cohorte de 29 pacientes con FM y otra de 32 sujetos control, registrando los espesores de la retina completa, de varias capas de la retina [capa de células ganglionares (CCG+), CCG ampliada (CCG++, entre la membrana limitante interna y los límites de la capa nuclear interna) y capa de fibras nerviosas (CFNR)] y de la coroides, mediante TCO-SS. La capacidad discriminante se evaluó mediante el área bajo la curva ROC (AROC) y el algoritmo Relief. Se implementó un sistema de ayuda al diagnóstico con clasificador automático.
ResultadosNo se observó diferencia significativa (p ≥ .660) en la coroides, pero sí en el sector inferior del anillo interno de la CFNR (p = .010) y en los cuatro sectores del anillo interno en las capas CCG+, CCG++ y retina completa. Utilizando un árbol de decisión ensemble RUSBoosted como clasificador de las características con mayor capacidad discriminante, se obtuvo una predicción alta (AROC=.820).
ConclusionesSe identifica un potencial biomarcador objetivo y no invasivo para el diagnóstico de FM basado en el análisis de la neurorretina mediante TCO-SS.
Fibromyalgia (FM) is characterized by widespread pain and hyperalgesia. It affects about 2% of the world's population —with approximately 90% prevalence in females (Gendelman et al., 2018) — and mildly to severely impairs quality of life (Clauw, 2014; Wolfe et al., 2010). Although its pathophysiology is not well known, the involvement of a possible imbalance in inflammatory biomarkers has been suggested (Montero-Marin et al., 2019), and changes in cerebral perfusion, structure and functional responses to pain have been reported (Gracely et al., 2002; Jensen et al., 2013).
No confirmatory blood tests (biomarkers), imaging or histological analysis are available for FM (Häuser et al., 2019). There is not therefore any objective evidence on which to make a reliable diagnosis of the disease, which is why it is such a difficult pathology to evaluate and why there is speculation that some subjects feign it in order to obtain leave from work or to access benefits. As diagnosis of FM is a long clinical procedure without objective tests, doctors have difficulty with issues such as type I and II errors, malingering, and confusion with other chronic pain disorders or autoimmune pathologies. In addition, diagnosed patients need individualized treatment due to the moderate average efficacy of the treatments available (such as mindfulness-based interventions and cognitive-behavioral therapy, e.g., Häuser et al., 2018; Pardos-Gascón et al., 2021; Prados et al., 2020). Having an objective and moderately reliable diagnostic biomarker would represent a major step forward in the diagnosis of this pathology.
Recent research has identified several possible FM biomarkers, such as diversity of bacteria, which is reduced in FM patients (Clos-Garcia et al., 2019). Another line of research analyzes patients’ EEG signals while they sleep, achieving an accuracy of 96.15% in discriminating between FM patients and control subjects (Paul et al., 2019). Proposals have also been made in relation to 3 proteins (ENOA, PGAM1 and TRFE) present in patients’ saliva and which, together, achieve an area under the receiver operating characteristic curve (AUC) value of .79 when discriminating between control subjects and FM patients (Ciregia et al., 2019). In their study of the immune-inflammatory pathway (Minerbi et al., 2019), analyze microbiome composition and obtain an AUC = .87 in diagnosis. Finally, Andrés-Rodríguez, Borràs, Feliu-Soler, Pérez-Aranda, Rozadilla-Sacanell, Arranz et al. (2019), analyzed blood markers [serum interleukins (IL-6 and 10), high-sensitivity C-reactive protein (hs-CRP) and chemokine CXCL-8] and obtained an AUC of .91 between control subjects and FM patients.
The existence of retinal neurodegeneration has been demonstrated in mental disorders (such as schizophrenia and bipolar disorder), providing new understanding of the pathophysiology of psychiatric diseases (Demmin et al., 2020; Garcia-Martin et al., 2019; Gavín et al., 2021). In recent years, one of the retinal layers —the ganglion cell layer (GCL)— has been identified as a valuable biomarker for diagnosing and monitoring neurodegenerative processes such as multiple sclerosis, Parkinson's disease or Alzheimer's disease (Garcia-Martin et al., 2013; Polo et al., 2014; Ratchford et al., 2009; Satue et al., 2014). This particular layer appears more suited to analysis of neurodegenerative pathologies since it eliminates the “noise” and “variability” generated by the other retinal layers (Garcia-Martin et al., 2013; Petzold et al., 2017).
It was recently discovered that FM causes retinal changes observable using optical coherence tomography (OCT) (Garcia-Martin et al., 2016), suggesting that this disease is a neurological syndrome in which neurodegenerative processes may occur and suggesting also that retinal thicknesses may be a useful and objective tool to detect this pathology, similarly than with other pathologies: Alzheimer (Czakó et al, 2020), Multiple sclerosis (Petzold et al., 2017), Parkinson (Zhang et al., 2021), Bipolar syndrome (Sánchez-Morla et al., 2021), Schizophrenia (Yilmaz et al., 2016), etc. The retinal thicknesses had demonstrated to be accuracy and sensible to discriminate eyes from subjects suffering neurodegenerative disease, even as neuroimage test such as magnetic resonance imaging. Although retinal evaluation seems to have more sensitivity than specificity to detect neurodegenerative diseases, but the ability of this non-invasive tool to diagnose several diseases has been demonstrated (Satue et al., 2016).
Study of neuroretinal changes allows clinicians to comprehend the annual rate of neurodegeneration, provides them with a biomarker that can be used in diagnosis, in assessment of progression and even in prognosis, and allows them to measure the effectiveness of the various treatments (Garcia-Martin et al., 2017; Satue et al., 2017).
Few studies have assessed the structural changes in the retina, as measured using OCT, associated with FM; Onuora (2016) detected axonal damage in the optic nerve in patients with fibromyalgia, suggesting that neurodegeneration contributes to the pathology of the disease. Likewise Garcia-Martin et al. (2016), observed that thinning of the retinal nerve fiber layer (RNFL) in the temporal sectors is greater in patients with biological fibromyalgia, suggesting the presence of neurodegenerative processes in this subgroup of fibromyalgia patients. Lastly, a more recent study (Ulusoy et al., 2018) demonstrated that choroidal thickness decreases in patients with FM and correlates with disease activity.
Artificial intelligence (AI) is a domain of computer science that employs mathematical and statistical algorithms to make machine-based inferences that would otherwise be performed by human cognition (Tran et al., 2019). Use of AI algorithms in medical decision-making processes has increased in recent years. The different techniques (e.g., Bayes classifiers, neural networks, deep learning) have proved their utility in interpreting images, electrophysiological signals, analytical data, genomic data, etc., and in some cases have made the leap from research to clinical practice in specialties such as ophthalmology (Ting et al., 2019).
AI techniques (least absolute shrinkage and selection operator, support vector machines) have been used to optimize diagnosis of FM (Minerbi et al., 2019), who employed microbiome composition features, and Andrés-Rodríguez, Borràs, Feliu-Soler, Pérez-Aranda, Rozadilla-Sacanell, Arranz et al. (2019), who employed information about immune-inflammatory pathways as inputs for the classifier (multilayer perceptron artificial neural network).
In this context, our objective is to research how FM affects the thickness of various retinal structures, and to evaluate the effectiveness of an automatic classifier, in order to advance the process of obtaining an objective biomarker of this disease. Figure 1 shows the general block diagram for the method implemented.

A cohort comprising 29 patients diagnosed with FM (29 females) and 32 control subjects (male/female: 7/25) was studied. FM diagnosis was based on the 1990 American College of Rheumatology criteria for FM (Wolfe et al., 1990). The ophthalmological evaluation consisted of anterior segment assessment, best-corrected visual acuity (BCVA), intraocular pressure measurement, and OCT evaluation. The exclusion criteria comprised patients with BCVA lower than .4 (decimal, measured with the Snellen chart), significant refractive errors (> 5 diopters of spherical equivalent refraction or 3 diopters of astigmatism), intraocular pressure ≥ 21 mmHg, media opacification, concomitant ocular diseases (including a history of glaucoma or retinal pathology), and systemic conditions (especially neurodegenerative processes) that could affect the visual system. Controls were selected from hospital staff, family and friends. The healthy control subjects presented no history or evidence of ocular or neurological disease of any nature nor of presence of pain, depressive symptoms, or neurological symptoms. Their BCVA was > .4.
In addition, all subjects underwent physical exploration, including cranial pares exploration, and psychophysical evaluation (producing a Mini-Mental State Examination [MMSE] score) to rule out incidental or subclinical neurodegenerative processes that could interfere with the study. Subjects with MMSE < 27 were excluded from the study.
Based on a preliminary study, we calculated the sample size needed to detect differences of at least 2.5 μ in GCL+ thickness —measured using Triton OCT— in order to build an effective diagnostic tool, applying a bilateral test with α 5% risk and β 10% risk (i.e., with a power of 90%). In order to obtain a sufficient sample of FM patients to allow in-depth study of the natural history of the disease, the unexposed/exposed ratio was determined to be 0.5. From these data it was concluded that at least 29 eyes would be necessary in each group (Garcia-Martin et al., 2016).
InstrumentsDisease duration and age at diagnosis were recorded. A specialized psychiatrist from the Fibromyalgia Unit evaluated all patients and classified them by FM subgroup based on the pressure–pain thresholds and psychological factors described by Giesecke et al. (2003): Atypical (low tenderness, moderate depression/anxiety, moderate catastrophizing, and moderate control over pain), Depressive (high depression/anxiety, tenderness and catastrophizing, and low control over pain) and Biological (with low depression/anxiety and catastrophizing, and high control over pain).
The Spanish version of the Fibromyalgia Impact Questionnaire (FIQ) was used to measure the degree of FM, assigning a score from 0–100 (the higher the score, the greater the disease impact), as described in Rivera and González (2004). This instrument assesses the health status of FM patients, including patient reports, functional status instruments, and clinical observations. The FIQ measures physical functioning, work status (missed days of work and job difficulty), depression, anxiety, morning tiredness, pain, stiffness, fatigue, and well-being over the past week. The internal consistency of the Spanish version of the questionnaire is acceptable, with a Cronbach's alpha value of .80. (Dominguez et al., 2020).
The EuroQol 5-Dimension (EQ-5D) questionnaire (Spanish version) comprises five questions (with three response categories) addressing the following dimensions: Mobility, Self-care, Usual activities, Pain, and Anxiety/depression. EQ-5D results are expressed as the percentage of subjects with moderate or major problems (Kind et al., 1998), with 100 being the best health status possible and 0 the worst health status possible. The EQ-5D questionnaire shows an acceptable unidimensional model fit, with scale-level indices within predefined thresholds (LoMartire et al., 2019).
Retinal structures thicknesses were assessed from images acquired using the Wide protocol (including both macula and optic disc regions, with a field of view of 12 × 9 mm) on the Deep Range Imaging (DRI) Triton device (Topcon, Tokyo, Japan), which is a multi-modal swept-source OCT device with a non-mydriatic color fundus camera and obtains an 8 μm axial resolution in tissue.
Measurements were taken of the complete retina, of three retinal layers (these three retinal layers were selected as they provide the most information as regards axonal damage at this level) and the choroid. The complete retina was measured from the inner limiting membrane (ILM) to the retinal pigment epithelium boundaries. The three retinal layers evaluated were the retinal nerve fiber layer (RNFL) (between the inner limiting membrane and the ganglion cell boundaries), ganglion cell layer (GCL+) (between the RNFL and the inner nuclear layer boundaries, including ganglion cell bodies and retinal astrocytes), and GCL++ (between the ILM and the inner nuclear layer boundaries, including the cell bodies of the horizontal, bipolar and amacrine cells). We also obtained the thicknesses of the posterior vascular structure: the choroid (from the Bruch membrane to the choroidal–scleral interface).
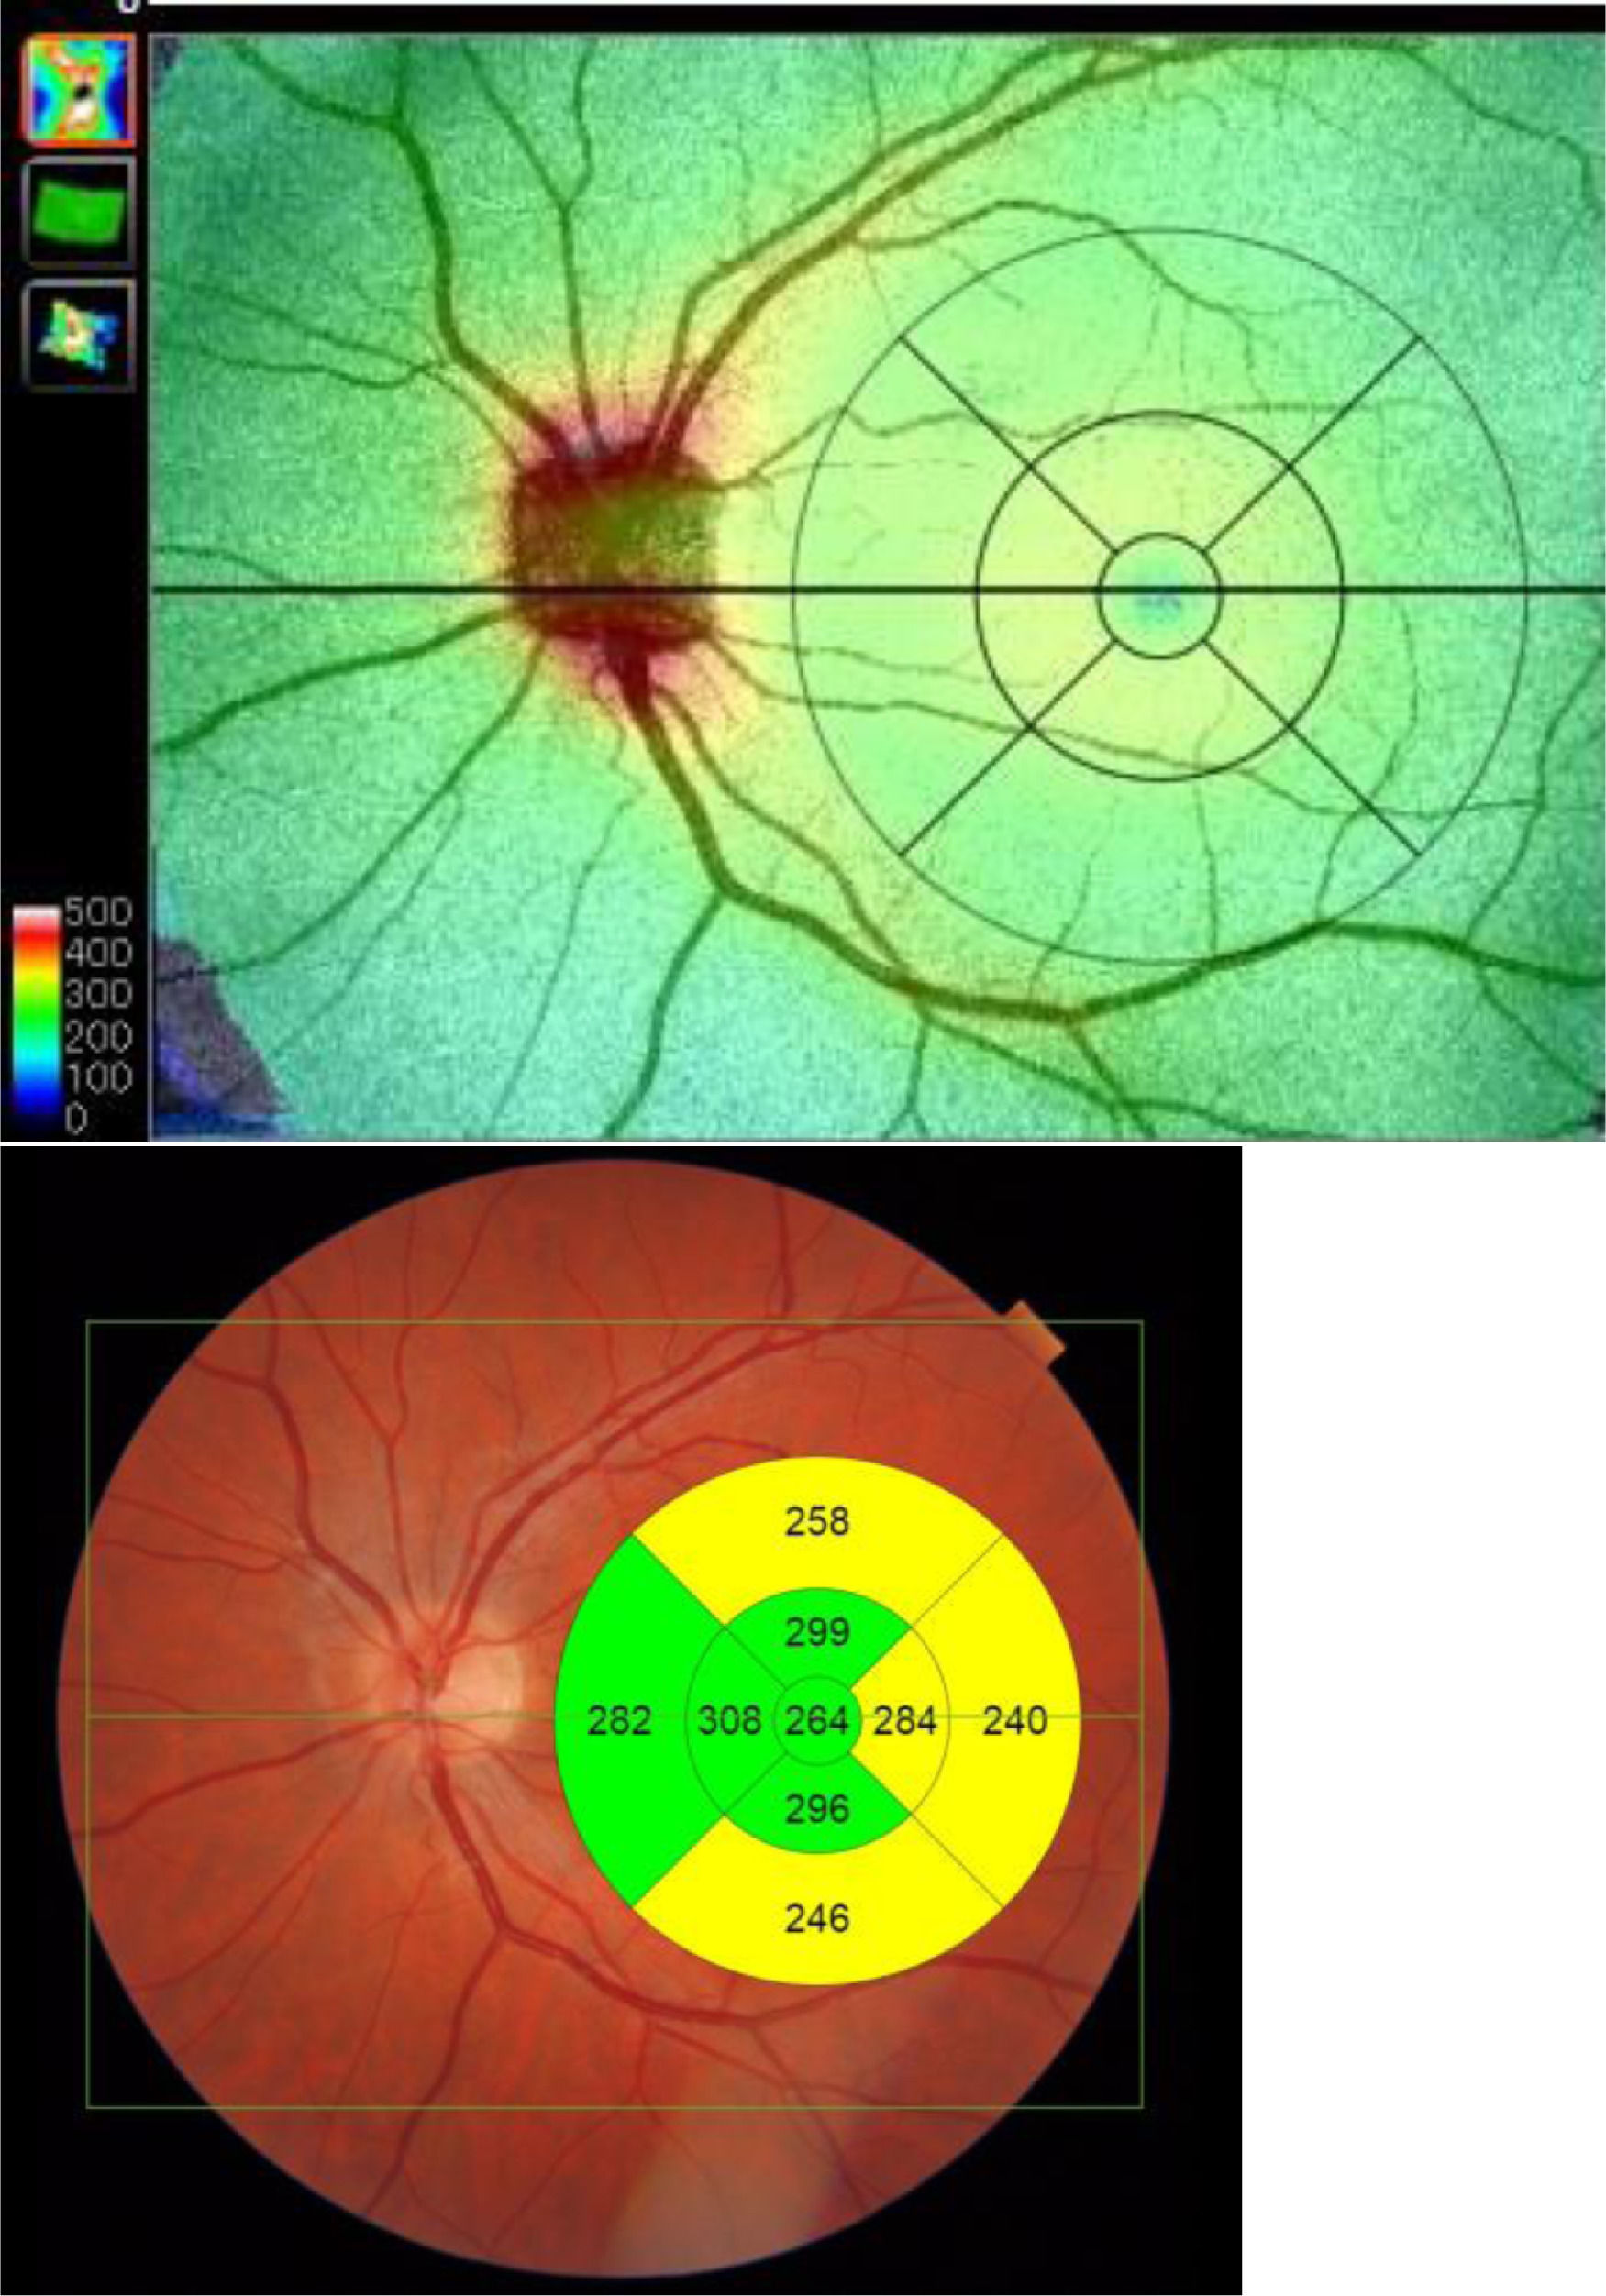
Built-in DRI-OCT software (v 10.1.3.43469) was used to segment the structures and construct topographic maps. For each of the segmented structures, the mean thickness value was obtained in the 9 regions defined by the Early Treatment Diabetic Retinopathy Study (ETDRS) chart: the central foveal circle (diameter = 1 mm), the parafoveal circle (diameter = 3 mm), and the perifoveal circle (diameter = 6 mm). The parafoveal region and the perifoveal regions (inner and outer circles, respectively) were subdivided into superior, inferior, temporal, and nasal subfields (Figure 2).
. The figure shows the 9 regions defined by the Early Treatment Diabetic Retinopathy Study (ETDRS) chart.")
All scans were performed by the same experienced operator, who was blinded for presence/absence of FM in each subject. When analyzing the OCT data, one eye from each participant was chosen at random.
ProcedureThe study protocol was approved by the Ethics Committee of the Miguel Servet Hospital at the University of Zaragoza and adhered to the tenets of the Declaration of Helsinki. All participants provided written informed consent. The procedure included two visits: (1) The psychiatric evaluation with physical exploration, including cranial pares exploration, and psychophysical evaluation (producing a Mini-Mental State Examination [MMSE] score), FIQ and EQ-5D. (2) The ophthalmological evaluation with best-corrected visual acuity (BCVA), intraocular pressure measurement, and OCT evaluation.
Data analysisStatistical analyses were performed using IBM SPSS Statistics 25 software (SPSS Inc. Chicago, Illinois, USA). The normality of distribution of continuous variables was tested using the Shapiro–Wilk test. Values were expressed as mean values ± standard deviation (± SD) for normally distributed variables and as median and quartiles (median [quartile]) for non-normally distributed variables.
The difference between variables was evaluated using Student's t test (normally distributed variables) or the Mann–Whitney test for groups of non-normally distributed variables. For the analysis of qualitative variables, a chi squared test was used. All tests were 2-tailed and p values < .05 were considered statistically significant. To establish the correlation between variables, Pearson's correlation coefficient was used.
The AUC was employed to assess the discriminant capacity of each of the features proposed in this study. The classification process was summarized in a confusion matrix with sensitivity, specificity and ROC (receiver operating characteristic) analysis parameters.
Non-informative features substantially increase classification error in classification algorithms. One approach to overcome this limitation is to combine multiple classifiers into an ensemble that often performs better than the individual learners, especially in the presence of poor discriminative features (Barandela et al., 2003).
Among the options available in the Classification Learner app from Matlab® (ver. R2020a), we obtained the best results with an ensemble of weak decision trees built using the RUSBoost algorithm. RUSBoost combines random data undersampling with a boosting algorithm (Seiffert et al., 2010). Data undersampling balances the input class distribution while boosting builds the ensemble classifier with a linear combination of weak classifiers. Decision tree algorithms are a non-parametric supervised learning method with a flowchart-like tree structure that attempts to find the relationship between the target class and the input features.
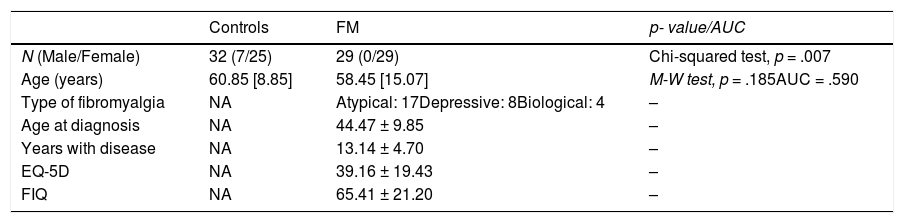
ResultsTable 1 shows the main demographic and clinical data for the control (n = 32) and FM (n = 29) groups. The control group includes 7 males, while the FM group consists exclusively of females (χ2(1) = 7.17, p = .007). Although the age of the control group (median: 60.85[8.85] years; range: 32.1–84.86) is slightly higher than the age of the FM group (median: 58.45[15.07] years; range: 31.87–73.57), there is no significant difference (Mann–Whitney test, p = .185, AUC = .590).
Demographic and clinical characteristics
Note. Values expressed as mean values ± standard deviation (± SD) for normally distributed variables and as median and quartiles (median [quartile]) for non-normally distributed variables.
M-W test = Mann–Whitney test.
The mean age of diagnosis was 44.47 ± 9.85 years, the average duration of the disease was 13.14 ± 4.70 years and the respective results of the EQ-5D and FIQ scales were 39.16 ± 19.43 and 65.41 ± 21.20 in the FM group.
According to the Giesecke classification, 17 patients belong to the atypical FM subgroup, 8 to the depressive subgroup and 4 to the biological subgroup. We performed an ANOVA analysis to check that no statistical differences in disease duration, FIQ and EQ-5D (p > .05) exist between the 3 subgroups.
Considering the FM patients as a whole (including the 3 subgroups), there is an inverse correlation between the results of the EQ-5D and FIQ questionnaires (r = -.67; p =. 001). There are no significant correlations between the EQ-5D and FIQ values, patient age and duration of disease. Absolute patient age correlates positively with the EQ-5D scale in the depressive (r =.73, p = .040) and biological (r = .96, p = .038) subgroups.
Table 2 shows the thickness values in the 5 structures analyzed and in the 9 regions of the ETDRS chart. The AUC value is also indicated so as to assess in each structure and region the degree of affectation by the disease of the variables analyzed.
Thicknesses (μm) in control subjects and FM patients. AUC values.
Note. t-test = Student's t test; M-W test = Mann–Whitney test; AUC = Area Under the Curve.
Thickness values were expressed as mean values ± standard deviation (± SD) for normally distributed variables and as median and quartiles (median [quartile]) for non-normally distributed variables.
Our results do not show any significant difference (p ≥ .66) in any region of the choroid. In the RNFL layer, a significant difference was only found in the IN_I region (p = .01). In the complete retina and GCL+ and GCL++ layers, a significant difference (controls vs FM) was found in the 4 regions that define the inner ring: IN_T, IN_S, IN_N and IN_I.
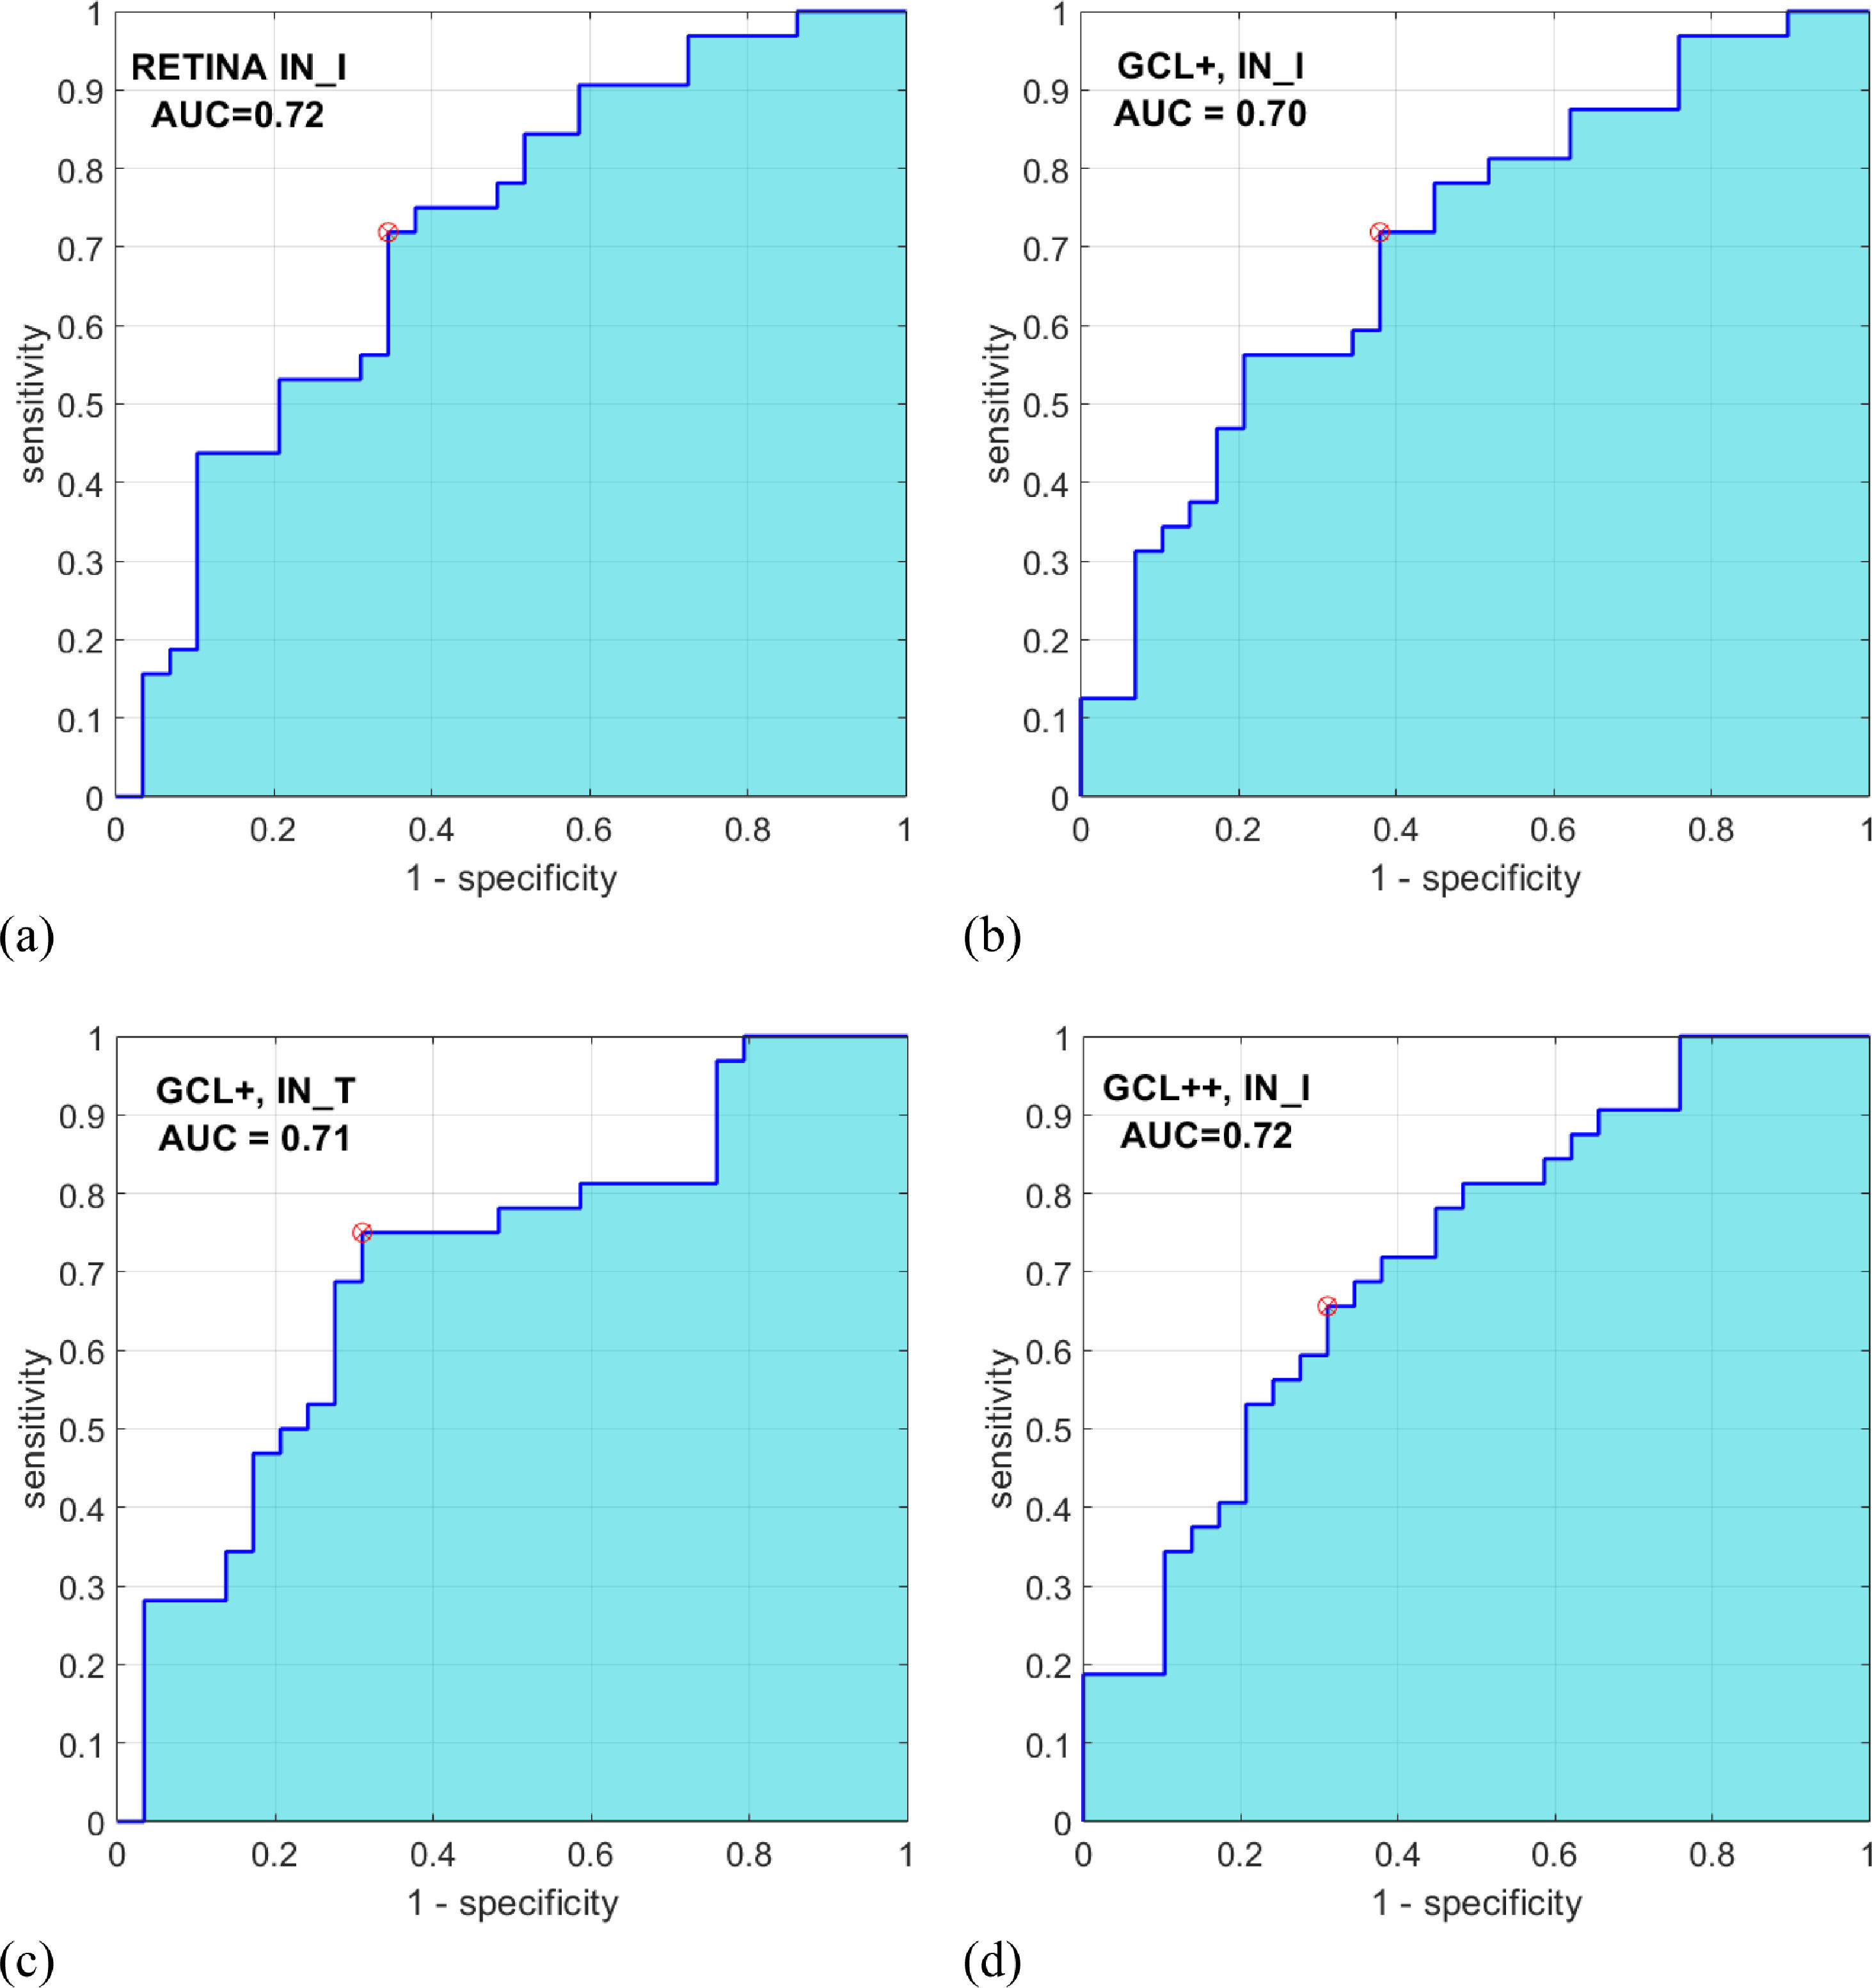
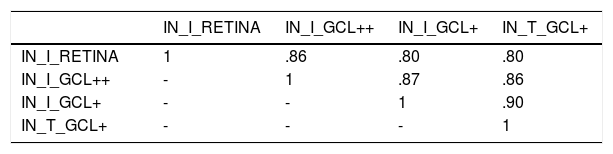
Automatic classificationAs inputs to the automatic classifier, we tested the 4 variables with the greatest discriminant capacity, as evaluated using the AUC parameter: IN_I_RETINA (AUC = .72), IN_I_GCL++ (AUC = .72), IN_I_GCL+ (AUC = .70), and IN_T_GCL+ (AUC = .71). Figure 3 shows the ROC curve for these 4 variables. Since the AUC values of these variables are similar, this criterion is not decisive for selecting the input feature vector of the classifier. Additionally, a strong correlation between these 4 variables (r > .80; p < .001) (Table 3) is verified, which implies they contain redundant information; a good feature vector must contain variables uncorrelated with each other.
. (a) IN_I_RETINA, (b) IN_I_GCL+; (c) IN_T_GCL+; (d) IN_I_GCL++.")
Relief (Kira & Rendell, 1992) is a multivariable feature selection algorithm that determines the importance of features according to their ability to identify instances that are near to each other. This algorithm gives a weight (W) value in the rank (-1, +1) to each variable, where a higher weight value indicates stronger discriminant capacity. Using the relief Matlab function (MathWorks, Natick, MA, USA), the weights of the four variables are WIN_I_RETINA = 0.0131, WIN_I_GCL++ = 0.0128, WIN_I_GCL+ = 0.0065, and WIN_T_GCL+ = 0.0065.
Based on all the above results, IN_I in the GCL++ and IN_I in the complete retina were selected as inputs to the classifier.
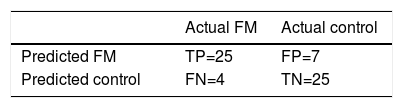
The RUSBoosted trees classifier was implemented in the Matlab® Classification Learner with the following model parameters: maximum number of splits = 20, number of learners = 30 and learning rate = .1. The results of classification using this system on our database are shown in Table 4, achieving accuracy = .82, sensitivity = .86, specificity = .78 and AUC = .82.
DiscussionAs part of the process of identifying objective biomarkers, this study provides insight into the structural affectation that fibromyalgia causes in retinal structures. Retinal thicknesses were measured using a state-of-the-art OCT system (SS-OCT) and the results were analyzed using artificial intelligence algorithms in order to advance the implementation of a diagnostic aid system. This study conducts a multidisciplinary evaluation of fibromyalgia, combining biomedicine and engineering to perform an easy, innocuous, non-invasive test (OCT) with which to detect a hard-to-diagnose systemic pathology.
Literature on retinal degeneration in FM patients is scarce. Ulusoy et al. (2018) provided new insights into the pathophysiology of this syndrome by detecting choroidal thinning in the macular area of FM patients. This decrease in blood perfusion was suggested to be related to alterations in autonomic nervous system functioning.
Current views on the etiology of FM suggest an involvement of central phenomena, with the central nervous system (CNS) playing a leading role (Sawaddiruk et al., 2017). However, there are not many hypotheses to explain retinal thinning in FM. Previous studies described neurobiological and structural brain abnormalities in these patients (Clauw, 2014; Jensen et al., 2013).
In our study, in examining 5 retinal structures we observed that in all of them, and in most regions of the ETDRS chart, the mean thickness value in the control subjects exceeded that of the FM patients, although in the RNFL layer (except IN_I region) and in choroid there was no significant difference. In the complete retina, and GCL+ and GCL++ layers we found a significant difference between the thicknesses in the control subjects and that in FM patients; the region in which thinning manifested most consistently comprises the 4 regions that define the inner ring: IN_T, IN_S, IN_N and IN_I.
These findings suggest the presence of neurodegeneration as a pathophysiological mechanism of FM, as already demonstrated in (Garcia-Martin et al., 2016). This degeneration appears mainly to affect ganglion cells (hence the greater affectation of the GCL) and suggests that there is an axonal loss at CNS level that causes anterograde degeneration with thinning or loss of ganglion cell axons until thinning of this layer presents in the parafoveal area (where parvocellular cells are concentrated).
Two types of ganglion cells intermingle in the retina: large magnocellular ganglion cells (which carry information about movement, location and perception of depth) and smaller parvocellular ganglion cells (which transmit information about color, shape and texture) and are mostly concentrated in the foveal region. Although both types of pathway reach the thalamus, they carry different information. In the thalamus they innervate the different layers of the lateral geniculate nucleus of that structure, doing so in order but separately. In the geniculate nucleus of the thalamus, where the fibers of the visual pathway are concentrated, there are two types of layer that receive visual pathways, one that solely receives M-ganglion cell axons (magnocellular layers) and another that receives P-cells (parvocellular layers). It appears that the area comprising the parvocellular layers is the one most affected in FM and, therefore, a reduction in their number causes anterograde degeneration, the result being that it is the parafoveal area that shows thinning.
Although studies by Bambo et al. (2015), and Wolfe et al. (2010), suggested alterations in ocular perfusion in FM patients, in our study we did not find any differences in the choroidal layer between healthy control subjects and FM patients. As Bambo et al used a new device to detect colorimetric changes in the peripapillary area without employing OCT technology, their results are not comparable with our findings. Wolfe et al. (2010) used an SD-OCT system with manual, non-automated choroidal layer measurements that relied strongly on the observer and his/her experience. They only took 7 manual measurements, while in our study using SS-OCT we took 64 measurements on a grid covering the optic nerve and the posterior pole of the eyeball. The device obtains these recordings automatically from the region spanning the Bruch membrane to the choroidal–scleral interface. For this reason, the results of any study performed using SD-OCT are less accurate, reproducible and reliable than those performed using SS-OCT, which does incorporate software capable of automatically measuring choroid thickness over a large area, taking multiple measurements not influenced by the observer.
Compared with SD-OCT, SS-OCT offers greater acquisition speed (approximately 100,000 A-scans/s vs. 40,000 in SD-OCT) as it does not require a spectroscope to obtain different wavelengths. SS-OCT employs a short-cavity swept laser with a tunable wavelength of operation and a wavelength centered on 1050 nm (sweep range of approximately 100 nm) (Kishi, 2016). Another noteworthy advantage of SS-OCT is that its wavelength is greater than the 850 nm generally used in SD-OCT, which gives it greater capacity to penetrate retinal tissue. For these reasons, we consider the results of this study to be more reliable as regards assessment of choroid thicknesses in FM patients.
According to Desideri et al. (2019), when analyzing choroid thicknesses, OCT should be performed at the same time of day, a series of ophthalmological data relating to the choroid (axial length, among others) should be obtained, and note should be taken if the patients’ medication (e.g., antihypertensive drugs) alters choroid perfusion. These data were taken into account in our study and all assessments of both control subjects and FM patients were performed between 10:00 and 13:00 hours.
To evaluate the behavior of a diagnostic aid system, an automatic classifier has been used, testing as inputs the variables in Table 2 with the greatest discriminant capacity. We observed that the greatest accuracy is obtained with two input variables (GCL++: IN_I and complete retina: IN_I).
One of the limitations of this study is that it only included females as patients. This is not the only study in which this occurs, since the prevalence of fibromyalgia is much higher in females (about 90% of patients are women) (Andrés-Rodríguez, Borràs, Feliu-Soler, Pérez-Aranda, Rozadilla-Sacanell, Montero-Marin et al., 2019; Gendelman et al., 2018; Groven et al., 2020). Another limitation is the small size of our population: studies with larger sample sizes, and validations of our findings in other populations presenting different genetic and geographic characteristics, will be important to validating the external accuracy of our conclusions.
In conclusion, FM causes progressive GCL thinning detectable by SS-OCT, which may be an objective and non-invasive marker with which to detect this disease. We believe that more studies, with larger samples, would be of great value, especially in assessing treatment effectiveness and studying the pathophysiology of this disease.
FundingThis work was supported by the Carlos III Health Institute [grant numbers PI17/01726 and PI20/00437, to EGM]; Secretary of State for Research, Development and Innovation [grant number DPI2017-88438-R (AEI/FEDER, UE), to LB] and RETICS Oftared, RD16/0008/020 to LB and RD16/0008/029 to EGM. They played no role in the study design, data analysis, reporting results or the decision to submit the manuscript for publication.
