


Though most children with Attention Deficit Hyperactivity Disorder (ADHD) show difficulties in behavioral measures of executive functions (EF), few studies have examined interrater agreement in these measures.Objective: To analyze the agreement between parents, teachers and self-reports of behavioral EF in adolescents with ADHD and controls. Method: A sample of 118 adolescents (75 with ADHD and 43 controls) was rated by parents, teachers and the adolescents themselves using the Comprehensive Executive Function Inventory. The intraclass correlation coefficient (ICC) and Bland and Altman methods were used to evaluate agreement. Results: The ICC between parents, teachers and self-report was poor or moderate in the group with ADHD; in the control group the agreement was fair to good. The Bland and Altman graphs show that, in the control group, most of the scores are below to the clinical cut-off point, while in the group with ADHD they are above. Conclusions: Agreement between all raters was low. Parents, teachers and adolescents agreed on the absence of deficits in behavioral EF in the control group, and on the presence of deficits in the group with ADHD, although they did not agree on the frequency of these deficits.
Aunque muchos adolescentes con Trastorno por Déficit de Atención con Hiperactividad (TDAH) muestran dificultades en las funciones ejecutivas (FE) conductuales, pocos estudios han analizado el acuerdo entre informantes en estas medidas. Objetivo: Analizar el acuerdo entre informantes en la valoración de FE conductuales en adolescentes con TDAH y controles. Método: Ciento dieciocho adolescentes (75 con TDAH y 43 controles) fueron evaluados con el Comprehensive Executive Function Inventory por padres, maestros y autoinforme. Se utilizó el coeficiente de correlación intraclase (ICC), y el método de Bland y Altman para evaluar el acuerdo entre informantes. Resultados: El ICC varía entre bajo y moderado en el grupo con TDAH, y entre moderado y bueno en el grupo control. Los gráficos de Bland y Altman muestran que, en el grupo control, la mayoría de las puntuaciones se sitúan por debajo del punto de corte clínico, mientras que en el grupo con TDAH están por encima del punto de corte. Conclusiones: El acuerdo entre informantes es bajo. Padres, maestros y adolescentes coinciden en la ausencia de déficits en las FE conductuales en el grupo control y en la presencia de déficits en el grupo con TDAH, aunque no coinciden en la frecuencia de estos déficits.
Attention Deficit Hyperactivity Disorder (ADHD) has been characterized as a neurodevelopmental disorder involving a persistent pattern of inattention and/or hyperactivity-impulsivity behavior that interferes with daily functioning and development (American Psychiatric Association, 2013). Among the sources of impairment associated with ADHD, deficits in executive functions (EF) stand out (Antonini, Becker, Tamm, & Epstein, 2015; Denckla & Mahone, 2018; González-Castro, Rodríguez, López, Cueli, & Álvarez, 2013; Rodríguez, Areces, García, Cueli, & González-Castro, 2018). Executive functions have been defined as “a collection of processes that are responsible for guiding, directing, and managing cognitive, emotional, and behavioral functions, particularly during active, novel problem solving” (Gioia, Isquith, Guy, & Kenworthy, 2000, p. 1). Two main types of measure have been used to assess EF: performance-based tests and rating scales. These two types of measure assess different aspects of behavioral and cognitive functioning, provide complementary information that contributes to the clinical characterization of executive deficits of people with ADHD, and are not interchangeable (Silver, 2014; Toplak, West, & Stanovich, 2017). Rating scales of EF provide information on competences related to functioning in complex and novel situations of everyday life (Naglieri & Goldstein, 2014). In particular, they assess observable behaviors that are closely related to executive processes evaluated with performance-based tests and provide more information than these latter tests on achievement in rational goal pursuit (Toplak et al., 2017). Difficulties in behavioral EF measures are associated with higher levels of ADHD symptoms (Toplak et al., 2017). There are few rating scales for evaluating behavioral EF. The most commonly used in the assessment process of ADHD are Behavioral Rating Inventory of Executive Function (BRIEF; Gioia et al., 2000), Childhood Executive Functioning Inventory (CHEXI; Thorell & Nyberg, 2008) and Comprehensive Executive Function Inventory (CEFI; Naglieri & Goldstein, 2014).
Rating scales are based on information from parents, teachers and self-reports. They provide an essential source of information related to specific settings and allow the identification of a unique profile of an adolescent's strengths and weaknesses in global executive functioning across several daily activities (Toplak et al., 2017; Wilmshurst, 2017). However, the use of information from various informants is not without problems, such as different expectations for child's behavior, different frames of reference, and their possibly subjective responses when answering the questions (e.g., Emser et al., 2018). These may be some of the reasons for the low agreement between informants in both community and clinical samples shown in various studies, which constitutes one of the most important problems with the use of rating scales (e.g., Dekker, Ziermans, Spruijt, & Swaab, 2017; McCandless and O’Laughlin, 2007). The few studies that have examined the agreement between parents, teachers and self for behavioral EF ratings in samples of adolescent with typical development and with ADHD, and have reported mixed results. For instance, in non-clinical samples using parent and teacher forms of BRIEF, Dekker et al. (2017) reported low agreement and Gioia et al. (2000) reported moderate agreement (r between .15 and .50). Naglieri and Goldstein (2014), in an ADHD sample of children and adolescents and a mixed clinical sample, reported good agreement on Full-scale scores of the CEFI between parents and teachers (r = .79), parents and self-reports (r = .71), and teachers and self-reports (r = .68). In children and adolescents with ADHD, McCandless and O’Laughlin (2007) found minimal agreement between parents and teachers in the BRIEF global composite score (r = .13). In these studies, the degree of agreement was obtained from Pearson's linear correlation coefficient. However, the ability of this indicator to assess agreement is limited, since it shows the degree of covariation between two scores, but not the agreement in the scores.
With this in mind, the aims of this study were to investigate the extent of agreement between parents’, teachers’ and adolescents’ reports of behavioral EF in ADHD and control groups using the intraclass correlation coefficient, which analyzes the agreement in score between raters. We also used the Bland and Altman approach (1995) as a complementary method to visually represent the agreement between informants, although it has only rarely been used in psychology (e.g., Bennetts, Mensah, Westrupp, Hackworth, & Reilly, 2016). In this approach, scores of the difference between two quantitative measures (i.e., rating scales) are plotted graphically against their mean, thus allowing the clinician to examine the extent of the disagreement visually. To our knowledge, there are no studies about the degree of agreement between informants using the Bland and Altman approach, also known as the Tukey mean-differences plot (Kozak & Wnuk, 2014).
MethodParticipantsThe sample included 118 adolescents with ages ranging between 12 and 16 years. The ADHD group consisted of 75 participants (48 predominantly inattentive and 27 combined presentation; age: M = 13.60, SD = 1.31; 68% males), and the control group consisted of 43 participants (age: M = 13.42, SD = 1.38; 55.8% males). Participants with ADHD were recruited from two child and adolescent mental health centers (85.3%) and a university psychological care clinic (14.7%). Most families were individually referred by pediatricians, psychiatrists and psychologists. Non-clinical adolescents were recruited from a secondary school. The majority of adolescents (90.5%) lived in two-parent families. All participants lived in major urban areas in which the mental health centers, the psychological care clinics and the schools are located.
In terms of clinical diagnoses, the participants in the ADHD group were required to meet DSM-5 cut-off criteria for core symptoms of ADHD, age of onset, chronicity, impairment and cross-situational manifestations (American Psychiatric Association, 2013). Diagnostic assignment for ADHD and control group was determined using data from the Clinical Interview-Parent Report Form (Barkley & Murphy, 2006) and the revised Conners-3 parent and teacher rating scales (Conners, 2008), as assessed by parents and teachers. Participants of the control group had no previous or current diagnosis of psychiatric disorders. Exclusion criteria were: Full-scale intelligence quotient (FSIQ) < 85 on the Wechsler Intelligence Scale for Children Fourth Edition (WISC-IV; Wechsler, 2005); history of tics, neurological disorders, or sensory impairment (seizures or brain injury); or the presence of psychiatric disorders (autism spectrum disorder, motor or communication disorders, Tourette's syndrome, psychosis or bipolar disorder).
Unanimous agreement by an ADHD expert panel (two psychologists and one psychiatrist certified in clinical child and adolescent psychology) was required for the assignment of participants to ADHD or control groups.
Participation of all families was voluntary and no financial compensation was offered. After receiving information about the aims of the study, the parents of the participants gave written consent for their children to join the study, and all children gave oral consent. The study complied with the principles of the 1975 Declaration of Helsinki (revised in Tokyo in 2014).
InstrumentsComprehensive Executive Function Inventory (CEFI; Naglieri & Goldstein, 2013). This inventory evaluates behaviors related to executive functioning and consists of three forms, parent (5–18 years), teacher (5–18 years) and self-rating (12–18 years). The CEFI includes 100 items on a Likert-type scale, 90 of which provide a Full-Scale Score and are distributed in nine scales: Attention (12 items), Emotional Regulation (9 items), Flexibility (7 items), Inhibitory Control (10 items), Initiation (10 items), Organization (10 items), Planning (11 items), Self-Monitoring (10 items), and Working Memory (11 items). The remaining 10 items correspond to the Positive and Negative Impression Scale. The CEFI provides standard scores (M = 100; SD = 15), and high scores are associated with good executive functioning. The clinical cut-off point is a standard score below 90. The reliability (Cronbach's alpha) of the full-scale score in parent, teacher and self-report is very good: α = .99 (parent and teacher reports) and α = .97 (self-report). The Cronbach's alphas of the nine scales are: parents [between α = .85 (Flexibility) and α = .93 (Attention)], teachers [between α = .90 (Flexibility) and α = .96 (Planning)] and self-report [between α = .78 (Self-Monitoring) and α = .86 (Attention)] (Naglieri & Goldstein, 2013). Standard scores of the nine scales and the Full-Scale score were used.
ProcedureThe study was reviewed and approved by the director and coordinators of the ethics committee of the child and adolescent mental health centers and the secondary school. A trained master's level clinical psychologist collected all the data under the supervision of a doctoral level clinical psychologist. After recruitment a clinical interview with parents and caregivers covered the developmental and medical information about the adolescent, chronicity and pervasiveness of ADHD symptoms, and associated functional impairment (Clinical Interview-Parent Report Form; Barkley & Murphy, 2006). Parents and teachers in the ADHD and control groups also completed the Conners-3 (Conners, 2008) and CEFI rating scales. Both parents completed the Conners-3 and CEFI by agreeing on each item, in a single session with the clinician. Nine single-parent families from the ADHD group (12%) and six (14%) from the control group completed the CEFI. Since students at high school have more than one teacher, only one teacher was selected as informant. The criteria for this selection were: (1) the informant was an expert teacher; (2) s/he had been a teacher of the participant for a minimum of one school year; and (3) s/he was the teacher with whom the participant spent most of the school day.
Participants also completed the CEFI with the clinical psychologist. The tests were organized in accordance with the standard tenets proposed by Semrud-Clikeman and Swaiman (2017) and the considerations for the evaluation of EF using CEFI rating scales proposed by Naglieri and Goldstein (2014). The items of rating scales were read out to all participants.
Data analysisThis study used an ex post facto-comparative and correlational design, with two groups (ADHD and control), and three informants (parents, teachers and self) by group. Differences between groups in terms of age and gender were examined using the t-test and the chi-square test, respectively. Standard scores on the CEFI scales for parents, teachers and self-report were used for the analysis. In order to study the overall agreement between parents, teachers and adolescents in behavioral EF, the intraclass correlation coefficient (ICC) for each CEFI scale was obtained using an ANOVA of one-way random effects analysis. Applying Fleiss, Levin, and Paik's criteria, the interpretation of ICC values is: < .40 poor, .40-.75 fair to good, and > .75 excellent agreement (Fleiss, Levin, & Paik, 2003). The ICC and their 95% confidence intervals were calculated for the Full- Scale score and the nine scales of CEFI. To control type I error, a nominal α of 5% was considered in the analysis, and the Bonferroni post hoc adjustment for multiple comparisons was applied. The cutoff point for each contrast was .0008 (the nominal α level divided by the number of contrasts done: .05/60).
The graphical approach of Bland and Altman (1995) was used to represent each difference between two raters in CEFI Full-Scale scores (parents vs teachers, parents vs self-report and teachers vs self-report). The Full-Scale score was chosen based on the findings of Naglieri and Goldstein (2014), who suggested that the CEFI Full-Scale score is the most reliable and valid measure of adolescents’ executive functioning. The resulting graph (see Figure 1) is a scatter plot, in which the Y axis shows the difference between the two paired measurements (e.g., parent ratings – teacher ratings) and the X axis represents the average of these rating [(e.g., parent rating + teachers rating)/2]. The statistical limits of agreement between CEFI raters were estimated by calculating the mean difference (d̄) and the standard deviation of the differences (s). The maximum acceptable limits of difference between two CEFI Full-Scale scores were expected to lie between ± 2s (d̄ - 2s and d̄ + 2s), more specifically, 95% of differences will lie d̄ - 1.96s and d̄ + 1.96s if the differences are normally distributed (Bland & Altman, 1995). A formal agreement is only possible when two scores (e.g., parent ratings – teacher ratings) are perfectly correlated (scatter is zero) and the bias (elevation and spread) between them is zero (Beckstead, 2011). All the analyses were performed with SPSS version 24.
; Parents vs Self-report (A2, B2); and Teachers vs Self-report (A3, B3). Differences between pairwise agreement vs. the mean of the two rating scales. The bias units are represented by the gap between the X-axis corresponding to zero differences, and the parallel line to the X-axis at units.")
ADHD and Control groups. Scatter plots of pairwise agreements between the three CEFI raters: Parents vs Teachers (A1, B1); Parents vs Self-report (A2, B2); and Teachers vs Self-report (A3, B3). Differences between pairwise agreement vs. the mean of the two rating scales. The bias units are represented by the gap between the X-axis corresponding to zero differences, and the parallel line to the X-axis at units.
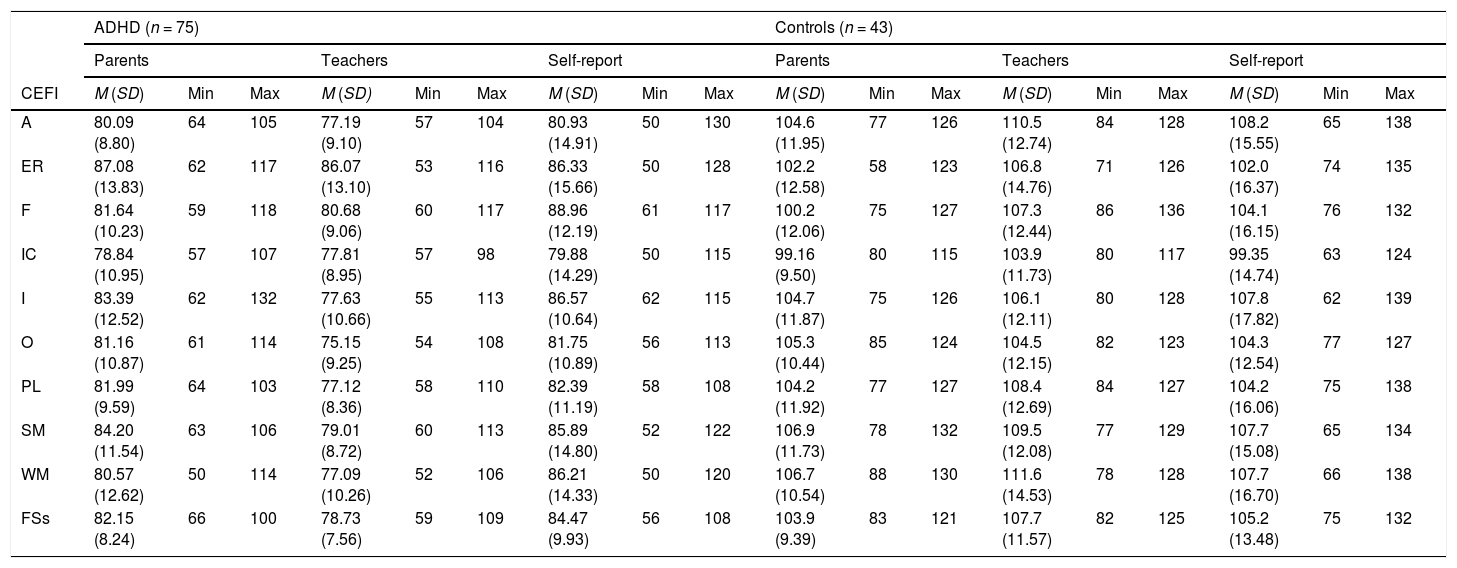
The groups were equivalent in age [control: M = 13.42, SD = 1.38; ADHD: M = 13.60, SD = 1.32; t(116) = .71, p = .49] and gender, χ2 (1, N = 118) = 1.75, p = .18. Table 1 summarizes the descriptive statistics for the ADHD and control groups on the CEFI scales.
Means and standard deviation of ADHD and control groups on measures of behavioral EF rating scales reported by parents, teachers and self-report.
| ADHD (n = 75) | Controls (n = 43) | |||||||||||||||||
|---|---|---|---|---|---|---|---|---|---|---|---|---|---|---|---|---|---|---|
| Parents | Teachers | Self-report | Parents | Teachers | Self-report | |||||||||||||
| CEFI | M (SD) | Min | Max | M (SD) | Min | Max | M (SD) | Min | Max | M (SD) | Min | Max | M (SD) | Min | Max | M (SD) | Min | Max |
| A | 80.09 (8.80) | 64 | 105 | 77.19 (9.10) | 57 | 104 | 80.93 (14.91) | 50 | 130 | 104.6 (11.95) | 77 | 126 | 110.5 (12.74) | 84 | 128 | 108.2 (15.55) | 65 | 138 |
| ER | 87.08 (13.83) | 62 | 117 | 86.07 (13.10) | 53 | 116 | 86.33 (15.66) | 50 | 128 | 102.2 (12.58) | 58 | 123 | 106.8 (14.76) | 71 | 126 | 102.0 (16.37) | 74 | 135 |
| F | 81.64 (10.23) | 59 | 118 | 80.68 (9.06) | 60 | 117 | 88.96 (12.19) | 61 | 117 | 100.2 (12.06) | 75 | 127 | 107.3 (12.44) | 86 | 136 | 104.1 (16.15) | 76 | 132 |
| IC | 78.84 (10.95) | 57 | 107 | 77.81 (8.95) | 57 | 98 | 79.88 (14.29) | 50 | 115 | 99.16 (9.50) | 80 | 115 | 103.9 (11.73) | 80 | 117 | 99.35 (14.74) | 63 | 124 |
| I | 83.39 (12.52) | 62 | 132 | 77.63 (10.66) | 55 | 113 | 86.57 (10.64) | 62 | 115 | 104.7 (11.87) | 75 | 126 | 106.1 (12.11) | 80 | 128 | 107.8 (17.82) | 62 | 139 |
| O | 81.16 (10.87) | 61 | 114 | 75.15 (9.25) | 54 | 108 | 81.75 (10.89) | 56 | 113 | 105.3 (10.44) | 85 | 124 | 104.5 (12.15) | 82 | 123 | 104.3 (12.54) | 77 | 127 |
| PL | 81.99 (9.59) | 64 | 103 | 77.12 (8.36) | 58 | 110 | 82.39 (11.19) | 58 | 108 | 104.2 (11.92) | 77 | 127 | 108.4 (12.69) | 84 | 127 | 104.2 (16.06) | 75 | 138 |
| SM | 84.20 (11.54) | 63 | 106 | 79.01 (8.72) | 60 | 113 | 85.89 (14.80) | 52 | 122 | 106.9 (11.73) | 78 | 132 | 109.5 (12.08) | 77 | 129 | 107.7 (15.08) | 65 | 134 |
| WM | 80.57 (12.62) | 50 | 114 | 77.09 (10.26) | 52 | 106 | 86.21 (14.33) | 50 | 120 | 106.7 (10.54) | 88 | 130 | 111.6 (14.53) | 78 | 128 | 107.7 (16.70) | 66 | 138 |
| FSs | 82.15 (8.24) | 66 | 100 | 78.73 (7.56) | 59 | 109 | 84.47 (9.93) | 56 | 108 | 103.9 (9.39) | 83 | 121 | 107.7 (11.57) | 82 | 125 | 105.2 (13.48) | 75 | 132 |
Note. A = attention; ER =emotion regulation; F = flexibility; IC = inhibitory control; I =initiation; O = organization; PL = planning; SM = self-monitoring; WM = working memory; FSs = full-scale score.
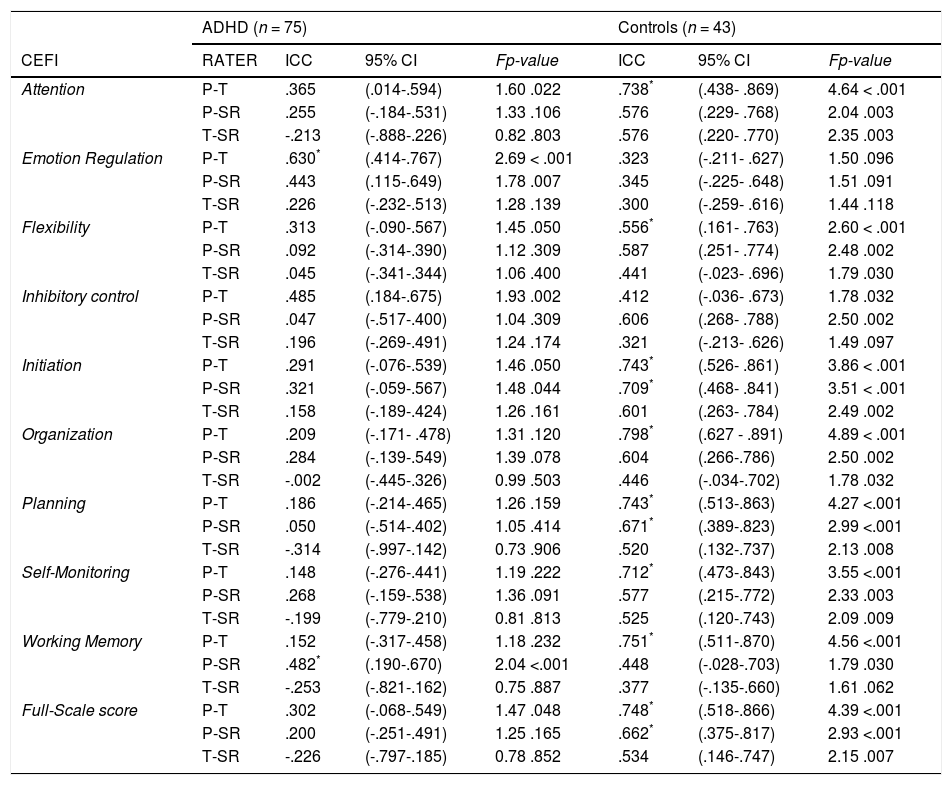
Table 2 shows the ICC statistics for the ADHD and control groups. For the ADHD group, after Bonferroni post hoc adjustment, the ICC between parents and teachers showed good and significant agreement for Emotion Regulation, but no significant agreement for all other CEFI scales. The ICC between parents and adolescents showed significant agreement only for Working Memory. The ICC between teachers and adolescents showed no significant agreement on any of the CEFI scales.
ICC estimates, absolute-agreement, ANOVA one-way random-effects model of ADHD and control groups.
| ADHD (n = 75) | Controls (n = 43) | ||||||
|---|---|---|---|---|---|---|---|
| CEFI | RATER | ICC | 95% CI | Fp-value | ICC | 95% CI | Fp-value |
| Attention | P-T | .365 | (.014-.594) | 1.60 .022 | .738* | (.438- .869) | 4.64 < .001 |
| P-SR | .255 | (-.184-.531) | 1.33 .106 | .576 | (.229- .768) | 2.04 .003 | |
| T-SR | -.213 | (-.888-.226) | 0.82 .803 | .576 | (.220- .770) | 2.35 .003 | |
| Emotion Regulation | P-T | .630* | (.414-.767) | 2.69 < .001 | .323 | (-.211- .627) | 1.50 .096 |
| P-SR | .443 | (.115-.649) | 1.78 .007 | .345 | (-.225- .648) | 1.51 .091 | |
| T-SR | .226 | (-.232-.513) | 1.28 .139 | .300 | (-.259- .616) | 1.44 .118 | |
| Flexibility | P-T | .313 | (-.090-.567) | 1.45 .050 | .556* | (.161- .763) | 2.60 < .001 |
| P-SR | .092 | (-.314-.390) | 1.12 .309 | .587 | (.251- .774) | 2.48 .002 | |
| T-SR | .045 | (-.341-.344) | 1.06 .400 | .441 | (-.023- .696) | 1.79 .030 | |
| Inhibitory control | P-T | .485 | (.184-.675) | 1.93 .002 | .412 | (-.036- .673) | 1.78 .032 |
| P-SR | .047 | (-.517-.400) | 1.04 .309 | .606 | (.268- .788) | 2.50 .002 | |
| T-SR | .196 | (-.269-.491) | 1.24 .174 | .321 | (-.213- .626) | 1.49 .097 | |
| Initiation | P-T | .291 | (-.076-.539) | 1.46 .050 | .743* | (.526- .861) | 3.86 < .001 |
| P-SR | .321 | (-.059-.567) | 1.48 .044 | .709* | (.468- .841) | 3.51 < .001 | |
| T-SR | .158 | (-.189-.424) | 1.26 .161 | .601 | (.263- .784) | 2.49 .002 | |
| Organization | P-T | .209 | (-.171- .478) | 1.31 .120 | .798* | (.627 - .891) | 4.89 < .001 |
| P-SR | .284 | (-.139-.549) | 1.39 .078 | .604 | (.266-.786) | 2.50 .002 | |
| T-SR | -.002 | (-.445-.326) | 0.99 .503 | .446 | (-.034-.702) | 1.78 .032 | |
| Planning | P-T | .186 | (-.214-.465) | 1.26 .159 | .743* | (.513-.863) | 4.27 <.001 |
| P-SR | .050 | (-.514-.402) | 1.05 .414 | .671* | (.389-.823) | 2.99 <.001 | |
| T-SR | -.314 | (-.997-.142) | 0.73 .906 | .520 | (.132-.737) | 2.13 .008 | |
| Self-Monitoring | P-T | .148 | (-.276-.441) | 1.19 .222 | .712* | (.473-.843) | 3.55 <.001 |
| P-SR | .268 | (-.159-.538) | 1.36 .091 | .577 | (.215-.772) | 2.33 .003 | |
| T-SR | -.199 | (-.779-.210) | 0.81 .813 | .525 | (.120-.743) | 2.09 .009 | |
| Working Memory | P-T | .152 | (-.317-.458) | 1.18 .232 | .751* | (.511-.870) | 4.56 <.001 |
| P-SR | .482* | (.190-.670) | 2.04 <.001 | .448 | (-.028-.703) | 1.79 .030 | |
| T-SR | -.253 | (-.821-.162) | 0.75 .887 | .377 | (-.135-.660) | 1.61 .062 | |
| Full-Scale score | P-T | .302 | (-.068-.549) | 1.47 .048 | .748* | (.518-.866) | 4.39 <.001 |
| P-SR | .200 | (-.251-.491) | 1.25 .165 | .662* | (.375-.817) | 2.93 <.001 | |
| T-SR | -.226 | (-.797-.185) | 0.78 .852 | .534 | (.146-.747) | 2.15 .007 | |
Note. ADHD = Attention deficit hyperactivity disorder; P = parent report; T = teacher report; SR = self-report; ICC = interclass correlation coefficients; CI = confidence interval; * = significant after Bonferroni correction.
In the control group, the ICC between parents and teachers showed fair to good and significant agreement for Attention, Flexibility, Initiation, Organization, Planning, Self-Monitoring, Working Memory and Full-Scale. The ICC between parents and adolescents showed fair to good agreement for Initiation, Planning and Full-Scale. No significant agreement was found between teachers and adolescents in any CEFI scales.
For the ADHD group, the Bland and Altman plots (Figure 1) showed that the mean differences for all pairwise agreements of the CEFI Full-Scale scores differed from zero, and most data points were grouped on the positive side of the Y-axis, suggesting a positive bias. Although there was low agreement between raters, the 95% limits of agreement were not very wide, with mean differences as follows: between parents and teachers 1.05 (95% CI= 0.80–1.31, Figure 1 A1); between parents and self-report 0.98 (95% CI = 0.70–1.26, Figure 1 A2); and between teachers and self-report 0.94 (95% CI = 0.65–1.22, Figure 1 A3). In addition, the Bland-Altman plots showed that most of the parent, teacher and adolescent ratings were located below the clinical cut-off point (X-axis = 90) which indicates behavioral EF difficulties.
For the control group, the Bland and Altman plots (Figure 1) showed that the mean differences for all pairwise agreements of the CEFI Full-Scale scores differed from zero, and most data points were grouped on the positive side of the Y-axis, suggesting a positive bias. Although there was low agreement, the 95% limits of agreement were not very wide, with mean differences as follows: between parents and teachers 0.97 (95% CI= 0.80–1.13, Figure 1 B1); between parents and self-report 0.99 (95% CI = 0.77–1.21, Figure 1 B2); and between teachers and self-report 1.03 (95% CI = 0.74–1.32, Figure 1 B3). Additionally, the Bland-Altman plots showed that most of the parent, teacher and adolescent ratings were located above the clinical cut-off point (X-axis = 90) which indicates absence of deficits in behavioral EF.
DiscussionThe aim of this work was to examine the degree of agreement between parents’, teachers’ and adolescents’ reports of behavioral EF in ADHD and control groups. Our findings show that, in the ADHD group, the agreement between parents and teachers was poor or moderate and non-significant for all CEFI scales except for Emotion Regulation, which presented good and significant agreement. In the control group, the agreement on this scale was very low and not significant. It is possible that the difficulties in emotional regulation shown by adolescents with ADHD appear both at home and at school, and will be more easily observable by parents and teachers, which may have helped to increase the degree of agreement between raters. This agreement highlights the significant difficulties observed in some samples of adolescents with ADHD (e.g., Krieger & Amador-Campos, 2017). Emotion dysregulation is increasingly recognized as a core feature of ADHD, and a larger proportion of children with ADHD (46.92%) show problems of emotional lability, which may be closely related to deficits in several executive processes (van Stralen, 2016).
In the control group, agreement was moderate or excellent and significant for Attention, Flexibility, Inhibition, Organization, Planning, Self-Monitoring, Working Memory and Full-Scale scores. Our findings are consistent with those of Naglieri and Goldstein (2014) that reported good agreement between parents and teachers on CEFI scales in a community sample.
In general, our findings are consistent with data indicating a low or moderate agreement between parents and teachers on rating scales of EF such as the BRIEF, in samples of children and adolescents with ADHD (Mares, McLuckie, Schwartz, & Saini, 2007; McCandless & O’Laughlin, 2007). We also found weak and non-significant agreements between parents’/ teachers’ and adolescents’ reports in the ADHD group. Nevertheless, relatively high and significant agreement between parents and self-reports was observed in the control group for Initiation, Planning, and the Full scale. Together, these results are partially consistent with those of Steward, Tan, Delgaty, Gonzales, and Bunner (2017) who found a large discrepancy between parents’ and adolescents’ reports of behavioral EF measured by the BRIEF scales (e.g., Working Memory, Emotional Control and Shifting) in a sample of adolescents with ADHD. Several studies including parent, teacher, and self-reports of ADHD symptom scales found that adolescents with ADHD tend to underestimate their difficulties, in relation to the parents’ and teachers’ reports (e.g., Sibley et al., 2012). These results are probably related to response bias in adolescent with ADHD, which can lead to subjectivity in answering questions or to a desire to fit in with social norms (Whitcomb, 2018). Indeed, compared with controls, adolescents with ADHD appear to have a higher positive bias or a tendency to rate themselves as having higher functioning in multiple settings and situations than other informants (teachers or parents; Hoza, Murray-Close, Arnold, Hinshaw, & Hechtman, 2010). The response bias of parents’ and teachers’ reports (e.g., halo bias) combined with over-estimation of the adolescents of their own competences in behavioral EF may be related to the wide disagreement between raters observed in our results.
Bland and Altman plots of all pairwise inter-rater agreements for the CEFI Full-Scale score showed very low agreement between raters (parents vs teachers, parents vs self-report and teachers vs self-report) for both ADHD and control groups. Indeed, the differences between each of the two paired comparisons against the mean of scores did not lie between the limits of agreement (d̄ - 2s and d̄ + 2s) and were always above and far from zero, in both ADHD and control groups. This indicates that the information provided by these three informants is not equivalent or interchangeable in the assessment of behavioral EF. The lack of agreement between raters in both ADHD and control groups may be related to the fact that each setting (i.e., school and home) in adolescent's everyday lives has specific and different situational requirements in behavioral terms. Indeed, teachers would know more about EF impairments at school, parents would know more about behaviors related to EF in home-specific situations (e.g., Toplak et al., 2017) and adolescents would more accurately report EF problems related to cognitive resources (Lantrip, Isquith, Koven, Welsh, & Roth, 2016). It is noteworthy that in the ADHD group, parents, teachers and self-report of CEFI Full-Scale ratings showed a clear trend towards behavioral EF deficits, with scores below the clinical risk cut-off point (T scores < 90). In contrast, in the control group, all raters showed a clear trend towards the absence of behavioral EF deficits, with scores above the clinical risk cut-off point (T scores > 90). These results suggest that even if all raters agree about the presence or absence of behavioral EF impairments, they disagree about their frequency. This suggests that the degree of agreement on the frequency of certain observable behaviors related to EF varies depending on the executive processing demands for each context and are perceived distinctly by each rater, thus implying that they are not equivalent.
In summary, the low agreement between informants highlights the importance of considering all sources of information (parents, teachers, and self-report) in the clinical assessment process, in order to obtain an accurate view of the nature of executive deficits in their respective settings. This is especially important for clinicians and other mental health workers who provide EF treatment to adolescents with ADHD, since this information can guide the selection of more tailored adaptive intervention strategies.
Additionally, rating scales can be valuable in the assessment context because they can be used to record and monitor low-frequency but important behavior over the long term, or identify specific events in multiple settings that might not be captured by other assessment methods (Stein, Hans, & Nanayakkara, 2015; Whitcomb, 2018). Finally, the Bland and Altman plots allowed easy visualization of the agreement between raters evaluating the same variable in different contexts. This may be useful in clinical assessment since they provide a means to contrast quickly and reliably the accuracy of information obtained from multiple sources and to improve the clinical decision-making process.
This study does have certain limitations that restrict its generalizability. Eligible respondents for this study were not randomly selected. Also, the relatively small sample size of the control group regarding the ADHD group, may have made it difficult to detect subtle differences between raters’ agreements, and finally the use of self-report because adolescents may be hesitant to accurately report their performance or behavior, especially if others recognize these as problematic.
Among the study's strengths is the careful process of clinical ADHD diagnosis carried out through the rigorous combination of information gathered from different informants (parents and teachers), through clinical interviews and rating scales. Also, to our knowledge, no one has previously conducted research examining the agreement between all three forms of CEFI. Future studies should replicate this study in larger samples of children and adolescents. Further research could also focus more on differences between typical development and different psychopathological conditions, besides ADHD, in order to assess the relationships between these conditions and the agreement in rating scales of EF.
Notably, the Bland and Altman plots can represent a good way to examine visually both the extent of the disagreement and the strengths and difficulties of the executive profile as expressed by different informants. This can help the clinician to develop executive treatment goals for specific settings and to visually monitor their implementation and results. Routine incorporation of this method into clinical practice can provide useful complementary information in order to increase diagnostic and intervention accuracy.
FundingThis work was partially supported by Grant FAKO-2009 from the Alicia Koplowitz Foundation (JAAC).
We want to thank psychiatrists and psychologists of the Mental Health Center les Corts and Antonio Medina of the Salesians school of Badalona, for their invaluable assistance in the sample recruitment. In the same way, the authors thank to all adolescents, parents and teachers for their collaboration.
