


Some studies suggest that people with intellectual disabilities (ID) might show distortions regarding body image self-perception. The objectives of this study were to investigate whether people with ID could correctly identify their body image and to determine if participating in a weight loss therapy program (WLTP) influenced in any way that perception. For that purpose, an experiment was proposed and all along a weight loss therapy program, a comparison between a body image subjective measure, as the Stunkard scale, and an objective one, as body mass index, was performed. The results obtained showed that individuals with ID (n=24) perceived in a wrong way their body image before any intervention program (58%). After applying the WLTP for ten weeks, an accentuation in this perception distortion (83%), mostly related with underestimation, was observed with respect to actual body mass index values. The strongest conclusion that can be drawn from this study is that people with ID do not correctly identify their body image. Furthermore, participating in WLTP influences their physical self-concept perception in the way that controlling two variables, as exercise and caloric restriction, causes greater disruption in that perception than controlling only one of them.
Algunos estudios sugieren que personas con discapacidad intelectual (DI) podrían presentar distorsiones en la autopercepción de su imagen corporal. Los objetivos de este estudio fueron investigar si la personas con DI podían identificar correctamente su imagen corporal y determinar si participar en un programa terapéutico de pérdida de peso (PTPP) influenció de alguna manera esa percepción. Para ello, a lo largo de un PTPP, se realizó una comparación entre una medida objetiva (IMC) y una medida subjetiva (escala de Stunkard) de imagen corporal. Los resultados mostraron que los individuos con DI (n=24) percibieron de manera errónea su imagen corporal incluso antes de la realización de cualquier programa de intervención (58%). Después de aplicar el PTPP durante diez semanas se observó una acentuación de esta distorsión (83%) con respecto a los valores reales de IMC. La conclusión más importante que se puede sacar de este estudio es que las personas con DI no identifican correctamente su imagen corporal. Asimismo, la participación en PTPP tiene influencia en la imagen corporal, en el sentido de que el control de dos variables, como el ejercicio físico y la restricción calórica, causa una mayor distorsión que el control de solamente una de ellas.
Body image is defined as a multidimensional model which attempts to explain the interpretation that people consciously make of their own body (Plesa-Skwerer, Sullivan, Joffre, & Tager-Flusberg, 2004). It is hierarchically organized into two different dimensions: physical and affective-emotional (Miguez, de la Montana, Gonzalez, & Gonzalez, 2011). Most studies carried out in general population to date, focused on the physical dimension of body image, also named as physical self-concept or body size (Jones, 2012). They generally compared body mass index (BMI) with different contrasted subjective scales, but no consensus conclusions can be drawn from them in terms of accuracy when it comes to the self-assessment of their body image (Knight, Illingworth, & Ricciardelli, 2009; Lynch et al., 2009; Madanat, Hawks, & Angeles, 2011; Miguez el al., 2011; Mikolajczyk et al., 2010; Wardle, Haase, & Steptoe, 2006).
The same analysis of the physical dimension of body image was made in population with intellectual disabilities (ID), although with fewer published studies. People with Williams syndrome and Prader-Willi syndrome, both with very defined obesity phenotypes, were more likely to develop wrong physical self-concepts, showing significant discrepancies between the image that they better identified with and their actual BMI values (Napolitano, Zarcone, Nielsen, Wang, & Caliendo, 2010; Plesa-Skwerer et al., 2004; Weiss, Diamond, Denmark, & Lovald, 2003). Moreover, several studies also reported that ID increased the degree of body dissatisfaction (difference between how they think they looked and how they would like to be) with respect to general population (Reel, Bucciere, & SooHoo, 2013; Yuen & Hanson, 2002).
Consequently, if people with ID were more likely to develop erroneous physical self-concepts of body image, it would be essential to establish the basis of a common construct, grounded on the objective analysis of their reality, in order to acquire their psychological welfare (Bégarie, Maïano, & Ninot, 2011; Garrido, García, Flores, & de Mier, 2012). With this study, we attempt to provide additional knowledge on the physical dimension of body image, for contributing to the development of this construct.
This fact forces us to take into account the high levels of incidence and prevalence of overweight and obesity, associated with high rates of physical inactivity, which are consistently higher in people with ID when compared to those in general population (Bartlo & Klein, 2011; Bégarie et al., 2011; de Winter, Bastiaanse, Hilgenkamp, Evenhuis, & Echteld, 2012; Gazizova, Puri, Singh, & Dhaliwal, 2011; Melville et al., 2008; Reichard & Stolzle, 2011; Wallace & Schlutter, 2008). Thereby, people with ID need to participate in systematic programs of therapeutic exercise oriented to weight loss (Hilgenkamp, Reis, van Wijck, & Evenhuis, 2012; Melville et al., 2011; Temple, Frey, & Stanish, 2006) and, taking advantage of that, it would be interesting to investigate its possible effects on their physical self-concepts and ultimately on their health related behaviors (Pomp, Fleig, Schwarzer, & Lippke, 2013). This could turn out to be a fundamental aspect, especially in Western cultures, to engage and guide population with ID to the practice of physical activities, proper eating behaviors and to avoid harmful behaviors (Silva, Capurro, Saumann, & Slachevsky, 2013).
Therefore, the first objective of this study was to investigate whether people with ID could correctly identify their physical dimension of body image, and the second one was to determine if participating in a weight loss therapy program (WLTP) influenced in any way their perception of this physical self-concept. To achieve this, a comparison between the body image scale proposed by Stunkard, Sorensen, and Schulsinger (1983), and actual body mass index values was performed before and after an intervention with a WLTP.
MethodParticipantsAdults with intellectual disabilities of any age, who possessed the minimal capabilities needed to be independent and would be able to make a change in their health related behaviors, were selected as the target population for the present study.
Between March and May 2012 a hundred and seven people from a regional occupational center were screened. Twenty-four people (17 men and 7 women), aged between 24 and 60 years old, were selected for the study following the inclusion criteria: (1) presenting mild to moderate intellectual disability grade (degree of disability was diagnosed by the medical doctor of the center, but he did not follow any systematic assessment); (2) having minimum physical and mental capabilities to carry out the proposed activities; (3) having no contraindication to perform physical activity; (4) being not under any antipsychotic or anxiolytic pharmacological medication (de Winter, Bastiaanse, Hilgenkamp, Evenhuis, & Echteld, 2012); (5) having a BMI higher than 15 and lower than 40 at the beginning of the program; (6) filling out correctly the informed consent.
Participants who did not meet the inclusion criteria were excluded from the study (Figure 1). Body mass index range for inclusion in the study was settled according to the minimum and maximum showed in the center records, although at the time of measure, five of them presented BMI over 40 and were not physically independent for carrying out the activities proposed. People who could not follow the simple exercise directions needed to perform the activities which will be explained below, were also excluded from participation.

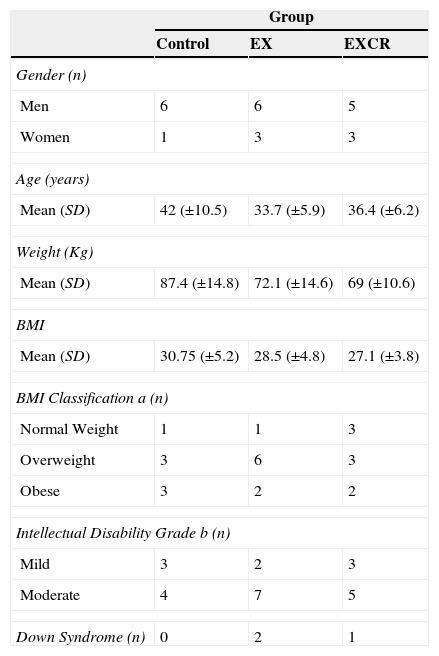
Demographic characteristics for the study sample are summarized in Table 1. Three participants were diagnosed of Down syndrome and twenty-one were not. The whole selection process is illustrated in a flow chart (Figure 1), as recommended by Hartley (2012).
Demographic characteristics of participants distributed by group (n=24).
| Group | |||
|---|---|---|---|
| Control | EX | EXCR | |
| Gender (n) | |||
| Men | 6 | 6 | 5 |
| Women | 1 | 3 | 3 |
| Age (years) | |||
| Mean (SD) | 42 (±10.5) | 33.7 (±5.9) | 36.4 (±6.2) |
| Weight (Kg) | |||
| Mean (SD) | 87.4 (±14.8) | 72.1 (±14.6) | 69 (±10.6) |
| BMI | |||
| Mean (SD) | 30.75 (±5.2) | 28.5 (±4.8) | 27.1 (±3.8) |
| BMI Classification a (n) | |||
| Normal Weight | 1 | 1 | 3 |
| Overweight | 3 | 6 | 3 |
| Obese | 3 | 2 | 2 |
| Intellectual Disability Grade b (n) | |||
| Mild | 3 | 2 | 3 |
| Moderate | 4 | 7 | 5 |
| Down Syndrome (n) | 0 | 2 | 1 |
Note. EX=Exercise; EXCR=Exercise and Caloric Restriction; BMI=Body Mass Index; a=based on Center Disease Control criteria; b=based on American Association on Intellectual and Developmental Disabilities criteria.
To accurately assess possible distortions in body image or body size self-perception in people with ID, a weight loss therapy program (WLTP) was applied. The intervention was randomly distributed between three groups: a group of exercise and caloric restriction (EXCR) with 5 men and 3 women, a group of exercise (EX) with 6 men and 3 women and a control group with 6 men and 1 woman. The previous classroom distribution was respected not to alter the organization of the center and daily activity of participants.
The WLTP lasted 10 weeks (Heller, McCubbin, Drum, & Peterson, 2011). EXCR group feeding was controlled, restricting daily calorie intake based on the American Heart Association recommendations (≤ 30% fat and 2000kcal; Lichtenstein et al., 2006), and they simultaneously carried out a structured exercise program (Ewing, McDermott, Thomas-Koger, Whitner, & Pierce, 2004; Heller, Hsieh, & Rimmer, 2004; Mann, Zhou, McDermott, & Poston, 2006), of one hour long, two times per week. EX group only performed the exercise program and control group continued its normal daily life activities (Heller et al., 2004).
The structured exercise program (SEP) was conducted following the American Heart Association recommendations (Lichtenstein et al., 2006), in an 80m2 fitness room, with 23°C of temperature and 50% of relative humidity. SEP sessions were distributed in: (1) warming up (10minutes), composed by joint mobility exercises, lateral movements, soft circle walking and major muscle groups stretching; (2) main part (40minutes) organized in a first ten minutes part of elliptical cardio work, a second fifteen minutes part of agility training (lateral displacements, vertical jumps, ball throwing and horizontal jumps) and a third fifteen minutes part of toning work (abdominal and lumbar exercises, squats and push-ups) (both second and third part consisted on a minute and a half work and 45seconds rest); (3) cooling down (10minutes), composed by soft circle walking, deep breaths and major muscle groups stretching. Once first half of the program was finished, duration of exercise was increased 5% to prevent adaptation to physical effort.
A qualified caretaker was responsible for carrying out the SEP in both EXCR and EX groups. Positive verbal reinforcement was provided to participants to maintain adherence to program, because motivation is a key component for success in a weight loss program (National Institutes of Health [NIH], 1998).
The study was conducted in accordance with the guidelines and ethics of the Institutional Research Committee, and written informed consent was obtained from all participants or from their parents or legal guardians. Participants were informed that they would be able to withdraw from the program whenever they wished. The study adhered to the Declaration of Helsinki for research involving human subjects (World Medical Association [WMA], 2008).
MeasuresWeight and height were measured with participants wearing no shoes and light clothing (Lynch et al., 2009), using a Tanita® BC-420 MA and a Leicester® stadiometer. The BMI of each participant was calculated using the BMI calculator available on the Centers for Disease Control (CDC) website.
Body image self-perception was assessed using a graphic 1-9 rating scale with figural stimuli to identify and quantify the anthropometric profile which participants felt more identified with (Stunkard et al., 1983). The figures in this scale range from people who are extremely thin (Silhouette 1) to extremely obese (Silhouette 9) (Lynch et al., 2009; Napolitano et al., 2010). Following previous research, these figures were classified into: underweight (Figures 1 and 2), normal weight (Figure 3 and 4), overweight (Figures 5 through 7), and obese (Figures 8 and 9) (Bhuiyan, Gustat, Srinivasan, & Berenson, 2003; Must, Philips, Stunkard, & Naumova, 2002). The variable body image corresponds to the number of the figure selected by participants in response to the prompt: Choose the figure that reflects how you think you look (Lynch et al., 2009). This instrument has shown good validity (Smith, Thompson, Raczynski, & Hilner, 1999) and strong test-retest correlations (p<.001) for the question regarding how participants think they look like (89 females and 92 males) (Thompson & Altabe, 1991).


The first measure of BMI and body image self-perception was performed just before weight loss therapy, the second one after 10 weeks of weight loss program and the third one six months after the end of the program.
The comparison of the three measures allowed us to discern if people with ID had experimented changes in body self perception and if there really was a correlation between the variations in BMI and body image self perception.
Statistical analysisData were analyzed using IBM SPSS Statistics 17.0. Some variables included in the study followed a non-normal distribution (Kolmogorov-Smirnov and Shapiro-Wilk test, p<.05) so we used parametric or non-parametric test when appropriate. BMI skewness and its standard error were 0.60 and 0.47 respectively, while kurtosis and its standard error were 0.42 and 0.91. In the same way, for body image skewness, values were -0.23 and 0.47, while kurtosis values were -0.39 and 0.918. Non-parametric tests were used (Wilcoxon signed rank test) in order to determine the existence of relationships between different variables. The intensity of these relationships was assessed through the Pearson correlation coefficient. A transformation of variables to percentages of variation was also performed to establish them in the same magnitude for posterior comparison.
ResultsFigure 2 shows the values of BMI and body image, measured at baseline, immediately after the end of the WLTP and six months later. For BMI, Wilcoxon test only showed significant differences between the first and second measures (Z=−2.1; p=0.03), and between the second and third measures (Z=−2.52; p=.012), in EXCR group. Meanwhile, for body image, significant differences were found, in both EXCR and EX groups, between the first and second measures (EXCR: Z=−2.74; p=.018) (EX: Z=−2.07; p=.038) and between the second and third measures (EXCR: Z=−2.39; p=.017) (EX: Z=−2.20; p=.028). No significant differences were found in control group for either BMI or body image.
By comparing the measures recorded 6 months after intervention with the ones corresponding to baseline, Figure 2 shows that no significant changes were observed (below 5%) for both BMI and body image.
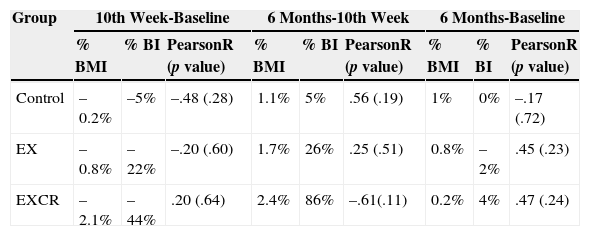
The transformation from the variables differences to percentages of variation is shown in Table 2. This transformation allowed us to correlate BMI and body image and the result obtained by Pearson correlation coefficient, which lacked of statistical significance (p>.05), stated that there was no relationship between the variables (Table 2). Changes in BMI did not imply changes in body image and vice versa.
Percentages of variation in body mass index and body image and Pearson correlation coefficients.
| Group | 10th Week-Baseline | 6 Months-10th Week | 6 Months-Baseline | ||||||
|---|---|---|---|---|---|---|---|---|---|
| % BMI | % BI | PearsonR (p value) | % BMI | % BI | PearsonR (p value) | % BMI | % BI | PearsonR (p value) | |
| Control | –0.2% | –5% | –.48 (.28) | 1.1% | 5% | .56 (.19) | 1% | 0% | –.17 (.72) |
| EX | –0.8% | –22% | –.20 (.60) | 1.7% | 26% | .25 (.51) | 0.8% | –2% | .45 (.23) |
| EXCR | –2.1% | –44% | .20 (.64) | 2.4% | 86% | –.61(.11) | 0.2% | 4% | .47 (.24) |
Note. EX=Exercise; EXCR=Exercise and Caloric Restriction; % BMI=Percentage of variation in Body Mass Index; % BI=Percentage of Variation in Body Image.
Formula: % BMI=(BMI2-BMI)*100/BMI - % BI=(BI2-BI)*100/BI
The reduction of BMI in EX group immediately after the program was minimal. However, significant improvement in body image was achieved, measured in a variation of 22%. This outcome was observed even with higher intensity in EXCR group, achieving a reduction of only 2% in BMI, but with a reduction of 44% in body image. Changes observed in control group were not significant.
The measurement performed 6 months after the completion of the intervention program, showed a rebound effect in body image assessment, for both EX group and EXCR group. Although BMI increased very little (around 1% in both groups), there was a deterioration of body image with variations of 26% and 86% respectively, returning to values recorded at baseline. Control group experienced no substantial changes in either BMI or body image in this period.
Moreover, the outcomes obtained for each participant in body image were compared with those predicted from BMI, according to criteria established by Bhuiyan et al. (2003) and Must et al. (2002). Thereby, the assessment made by each individual was qualified as normal-estimated, underestimated or overestimated, in accordance with predicted values. Before the beginning of the WLTP only 41.7% of the whole sample (n=24) seemed to estimate correctly their perceived body image, while 37.5% tended to underestimate it and 20.8% tended to overestimate it. The evolution of this phenomenon divided by group and through time is described in Figure 3. The percentage of individuals who estimated correctly their body image in comparison with their actual size, decreased significantly after the WLTP in both EX and EXCR groups.
Furthermore, 6 months after the end of the WLPT, these percentages were not comparable with the ones obtained at baseline. This conflicted with the results showed in Figure 2, where no differences between the first and third measures were appreciated in BMI and body image. This fact also corroborates that people with ID do not perceive correctly their body image.
DiscussionThis study compared an objective anthropometric measurement, BMI, with a subjective anthropometric measure, the figure rating scale proposed by Stunkard et al. (1983), in order to determine the existence of possible alterations in body image self-perception in a sample of people with ID, before and after applying a weight loss therapy program.
The outcomes obtained in this research showed that individuals with ID (all of them with BMI ≥ 25) perceived in a wrong way their body image before any intervention program. Only 42% of the sample identified their silhouette in the right range of BMI, compared to 58% who did not identify it properly, either underestimating (37.5%) or overestimating it (20.8%). These data were consistent with those reported by Napolitano et al. (2010) in individuals with Prader-Willi syndrome.
Moreover, if we establish a comparison with studies made in the general population, we found evidence that individuals without ID also tend to make mistakes at estimating body perception, seeing themselves either above or below of what their BMI really shows (Bhuiyan et al., 2003; Cox, Zunker, Wingo, Thomas, & Ard, 2010; Lynch et al., 2009; Miguez et al., 2011; Mikolajczyk et al., 2010; Standley, Sullivan, & Wardle, 2009; Wardle et al., 2006). However, other investigations within the same general population show that people accurately identify their body size compared to BMI (Knight et al., 2009; Madanat et al., 2011; Niccolaou et al., 2008). Since there is no consensus in the scientific community in addressing this issue, if we compare our data with those mentioned above, we can assume that ID would not be a determining factor for presenting a distorted body image self-perception, in relation with the actual BMI.
Nevertheless, when the intervention was distributed randomly between three groups (EXCR, EX and control) and a WLTP was applied for ten weeks, we observed that body perception (subjective measure) presented lower scores in relation to the variations in BMI (objective measure). This could mean that people with ID had a body image self-perception similar to general population while performing basic daily living activities, as demonstrated in the baseline measures. However, after applying the WLTP, the error in estimating body image with respect to BMI, increased up to 90% of individuals in EXCR group and to 100% of individuals in EX group (Figure 3). These data cannot be compared with those in general population because no similar studies were conducted.
If we compare the estimation of body image measurement at baseline, to the one taken ten weeks after (Figure 3), we observe that the error in estimating body size with respect to BMI is mostly related with underestimation (participants chose lower figure numbers than the ones they should according to their BMI), and it was higher in EX group (89%) than in EXCR group (75%), remaining unchanged in control group.
Though, comparing the results in Figure 3 to those presented in Figure 2, we concluded that participants, who had lower scores on the assessment of body image after the WLTP, were those belonging to EXCR group, as they passed from 6.5 in average score to 3.63. On the other hand, EX group members passed from an average score of 5.44 to 4.22. Transforming these scores to percentages of variation for correlating them with those of BMI (Table 2), we found that EXCR group reduced its body image scale scores by 44%, EX group decreased their scores by 22% and control group by only 5%. Variations in BMI fell 2.1%, 0.8% and 0.1%, respectively. Interpreting these results, we set that after a WLTP, individuals form EXCR and EX groups, considered that their body size reduced from overweight to normal weight, but their actual BMI objectively demonstrated that they continued being overweight. This statement is supported by the Pearson correlation test, which demonstrated a lack of correlation between the percentages of variation in body image and BMI, which globally meant that the drop in one variable did not necessary involve a drop in the other one.
After ten weeks of WLTP, EXCR group doubled the reduction in body image punctuation (44%) with respect to EX group (22%). Analyzing these results, it appears that increased physical activity combined with caloric restriction, exerts greater sense of body size reduction than increased physical activity alone, in individuals with ID.
These individuals with ID perceived their bodies thinner after intervention, although their BMI values indicated that they were still overweight. This means they understood that both physical exercise and food control were behaviors that would lead to improvements in their body size. This identification with slimmer silhouettes appeared in EXCR and EX groups, and it might had occurred because they tended to magnify the effects of physical activity and caloric restriction, since it is well known that a ten-week WLTP cannot make people reduce significantly their body size from overweight to normal values (Heller et al., 2011).
Regarding the results concerning the second and third measures presented in Table 2, we observed a rebound effect on body image self-perception six months after the end of the WLTP. Both EXCR and EX groups increased their body image scores, although the increment in EXCR group (86%) was significantly higher than the one observed in EX group (26%). This fact allows us to state again that people with ID tend to magnify the effect of intervention programs, because when they dropped out the prescribed healthy habits, they returned to higher body image scores, similar to the ones recorded at baseline. This distortion in estimating body size was evident immediately after and months after the intervention program, though in different ways, and it was influenced by the number of healthy behaviors practiced, causing greater disruption controlling two variables (exercise and caloric restriction), than only one of them (exercise).
If we relate these outcomes to those obtained by Napolitano et al. (2010), it is important to point out that to assess body satisfaction or dissatisfaction in people with ID, it would also be necessary to assess if they are performing or have performed any intervention program involving physical activity or caloric restriction, because they may be more or less satisfied with their body image if they perceive or do not perceive the healthy effects of a WLTP.
Although results presented here can bring new ideas to implement programs for obesity control in people with ID, this study presents severe limitations, which means that the conclusions drawn in it will have to be interpreted with caution. Firstly, the sample size and demographics are not representative of the population with ID in order to generalize the results. Anyway, this small number of participants is the result of strict inclusion criteria, especially in reference to medication, since it is very difficult to find participants with ID who are not under any antipsychotic or anxiolytic pharmacological treatment. Secondly, although the reliability and validity of the body image figure scale is well demonstrated (Lynch et al., 2009), it has been validated in population without intellectual disabilities, so we have to consider possible confusion in assessing body self-perception accurately in individuals with ID. Thirdly, the possible variation of body image perception over time is also not well known, so there is a potential error in identifying the figures of the scale, depending on the age of individuals. Finally, this study did not include any control group formed by people without ID, so although the results obtained could lead to think that ID might represent an important factor when it comes to interpret the physical dimension of body image, this conclusive statement cannot be drawn.
Some future research which will extend the outcomes presented in this study would be: to determine whether the altered body image is more evident in men than in women after a WLTP, to study which age ranges are more likely to develop this distortion, to check the level of satisfaction with their own body image after applying a WLTP, to include a general population control group in a similar study for analyzing ID as a predisposing factor to alter body image self perception and, finally, to consider using this possible altered perception as a tool for motivation and adherence keeping to obesity control programs in people with ID.
The strongest conclusion that can be drawn from this study is that people with intellectual disabilities do not correctly identify their body image. Furthermore, participating in a weight loss therapy program influences their physical self-concept perception in the way that controlling two variables, as exercise and caloric restriction, causes greater disruption in that perception than controlling only one of them.
Thanks to all participants and workers from occupational center Aspas in Santiago de Compostela (Spain).
Available online 23 May 2014
